14054 S Zenith St · Glenpool, OK
Flood risk 1/10 · Minimal
- FEMA flood zone
- X (unshaded)
- Chance of flooding over 30 yrs
- 0.0%
- Est. flood insurance / yr
- $507 – $1,088
Fire risk 7/10 · Major
- Est. fire insurance / yr
- $2,463 – $4,575
Heat risk 6/10 · Moderate
- Hot days now (above 112°F)
- 7 days/yr
- Hot days in 30 yrs
- 18 days/yr
Wind risk 2/10 · Minimal
- Chance of severe wind over 30 yrs
- 4.0%
Air-quality risk 2/10 · Minimal
- Unhealthy air days now
- 1 days/yr
- Unhealthy air days in 30 yrs
- 1 days/yr
Risk factors via First Street. Map © Google.
Why this score? — see what drove the C+ grade
The composite is a weighted blend of 9 inputs, each scored 0–100. Each bar is that input's sub-score; the figure is the points it added to the 100-point composite (weight × sub-score).
- Cash flow +30.0/30.0
- DSCR +10.0/10.0
- 1% rule +7.7/10.0
- ARV discount +5.9/15.0
- Livability +3.5/5.0
- Rent growth +2.5/5.0
- Condition / age +2.5/5.0
- Schools +2.4/10.0
- Appreciation +0.0/10.0
$129,900
🖨 Deal sheet 📄 Offer letter ✓ Due diligence
Listing remarks MLS
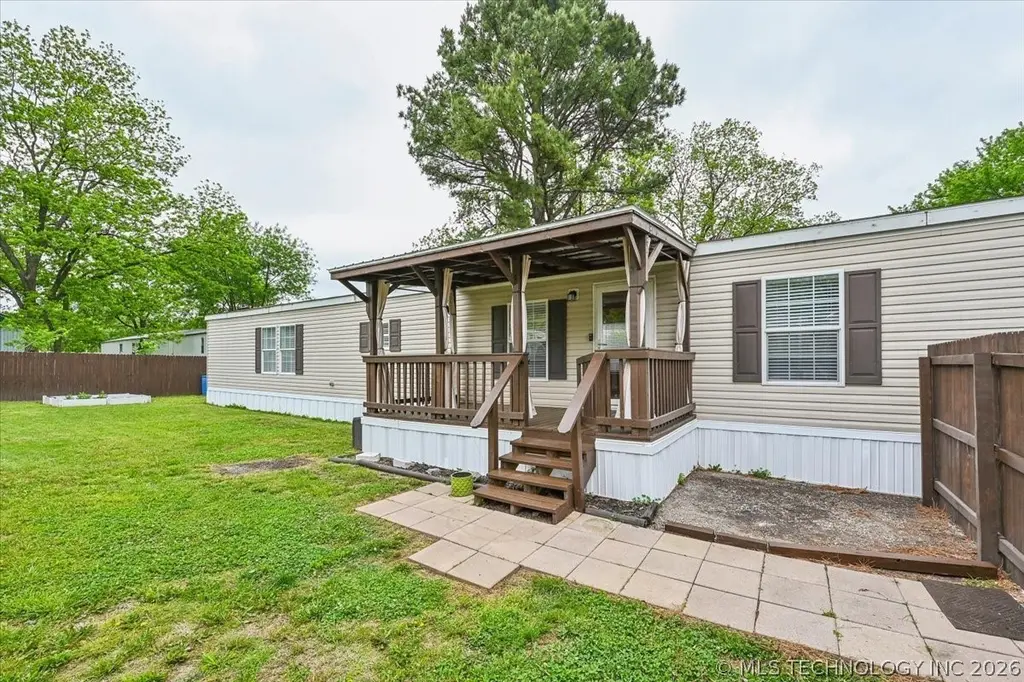
Ready to occupy. Mature trees provide great shade from summer heat, needs TLC. Selling "AS IS".
Key facts
- Open concept
- 7,200 sq ft lot
- Parking
Tags
Property features AI
Finance
- HOA & community: Gutters noted as a community feature
Exterior
- Parking: Driveway; Parking pad
- Security: Smoke detector(s); No safety shelter
- Utilities: Public water; Public sewer; Electricity available; Natural gas available; Cable available; Phone available
- Home design: Single-wide manufactured home; One story; Faces east; Tie-down foundation
- Construction: HardiPlank type and vinyl siding; Asphalt/fiberglass roof; Built (year per public records)
- Exterior features: Concrete and gravel driveways; Covered porch, deck; Landscaping and exterior lighting; Rain gutters; Dog run; Shed(s); Full privacy fencing
Interior
- Kitchen: Refrigerator; Range / Oven; Convection oven; Microwave; Dishwasher; Disposal; Pantry
- Bedrooms: Master bedroom with private bath and walk-in closet (first floor); Additional bedrooms (first floor)
- Flooring: Carpet; Vinyl
- Bathrooms: Two full bathrooms; Master bath with double sink, separate shower, whirlpool tub and vent; Hall bath with bathtub and vent
- Heating & cooling: Central heating (electric); Central air conditioning
- Interior features: Vinyl and insulated storm windows; Insulated doors and storm door(s); Accessible doors; Ceiling fan(s); Laminate counters; Wired for data and cable TV; High speed internet available; Programmable thermostat; Electric oven/range connection; Electric water heater
- Laundry & utility: Inside utility room (first floor); Washer hookup; Electric dryer hookup
Neighborhood map
What this means for you Summary
Snapshot
- This is a 3-bed/2.0-bath manufactured listed at $130k.
Deal economics
- At list price, monthly cash flow is $503 ($6k/yr) — positive.
- The deal already cash-flows at list — no discount required.
- Meets the 1% rule at list price ($2k rent vs $130k).
- Cap rate 10.9% vs local median 3.9% in Glenpool — top-decile yield for the area; either an underpriced asset or a hidden risk that comps aren't pricing in. Stress-test before assuming the spread holds.
Location & tenants
- Location reads 70/100 on livability (#39 in OK) — a middle-class / working-renter tenant base. Strengths: cost of living A+, housing A+, crime A; Watch: schools D+, amenities F, commute F.
- Glenpool (suburban): math 25% / reading 27% proficiency, ranked #78 of 270 in OK (top 29%) — low school quality limits family demand, transient renter base, plan for 1-2y turnover.
- Market conditions: 162 active listings in the ZIP; 2 comparable units currently listed for rent nearby; solid renter incomes; 2,818 units permitted in Tulsa County in 2024 (518 in 5+ unit buildings).
Forward outlook
- Local home prices are declining (-3.0%/yr); year-one equity from $898 of loan paydown is wiped out by about $4k of value loss. Plan a longer hold.
- Tulsa County population projected at +30% by 2050 — long-run rental-demand tailwind backs the buy-and-hold thesis.
- At projected returns (-3.0% appreciation + 3.0% rent growth), your $36k cash investment doubles in ~8 years — after that, you're playing with house money.
Negotiation context
- Only 6 days on market — expect competitive offers; lowballing is unlikely to land.
- 7 sale attempts since 30y ago with the ask held roughly flat each time — persistent listings suggest the price (not the market) is what's stuck; bring a comps-based counter.
- Current owner paid $46k; list at $130k implies a 185% gain — meaningful room to come down on a strong offer.
Risks & watch-outs
- Climate carrying-cost: major wildfire risk; extreme-heat days projected 7→18/yr by 2055 (HVAC capex compounding) — expect insurance premiums to compound above CPI over the hold.
Questions for the listing agent
- Is there a deadline driving the sale (1031 exchange, divorce, estate, relocation)? That informs how much negotiation room exists.
- Schools are D-rated, which usually means shorter tenancies and higher turnover. Who's the typical renter profile here, and what's been the actual vacancy rate?
- What's the average days-on-market for RENTAL listings here right now (not sales)? A rising rental-DOM trend means longer vacancies and softer asking-rent achievability than the comps imply.
- What's the recent tenant-quality profile in this submarket — average credit score on applications, eviction rate, late-payment / NSF rate, and stable-employment percentage? A property-management company in the area should have these aggregated.
- How much new for-sale + rental construction is in the pipeline within 1–3 miles? Heavy new supply typically softens prices + rents 12–24 months out; constrained supply supports both.
Investment metrics
- 1% rule
- 1.27% ✓
- Cap rate
- 10.94%
- Cash-on-cash
- 16.58%
- DSCR
- 1.74
- GRM
- 6.6
CMA / ARV
- ARV (on-the-fly)
- $125,440
- Comps found
- 2
Show comp detail 2 sales within ~0.75 mi
| Address | Dist | Beds/Ba | Sqft | Sold | Price | $/sf | Match |
|---|---|---|---|---|---|---|---|
| 14054 S Zenith St | 0.00mi | 3/2.0 | 1,280 (0%) | 1mo | $125,000 | $98 | 99 |
| 950 W 138th Pl | 0.19mi | 3/2.0 | 1,278 (-0%) | 7mo | $112,000 | $88 | 85 |
Match score weights: distance 35% · size 25% · config 20% · recency 20%. Top-matched comps best support the ARV.
Projected returns pro-forma
-3.0% appreciation · 3.0% rent growth · sell at horizon
- IRR
- 7.7%
- Equity multiple
- 1.30×
- Total profit
- $10,921
- Equity at exit
- $19,369
- IRR
- 16.9%
- Equity multiple
- 2.39×
- Total profit
- $50,575
- Equity at exit
- $11,231
Cash invested: $36,372 (down + closing). Projections, not guarantees.
Landlord ↔ Tenant lean methodology
- Overall (STATE)
- 83 Strongly Landlord-Friendly
- State Oklahoma
- 83 Strongly Landlord-Friendly · R+20
- County
- — inherits STATE
- City
- — inherits STATE
ZIP-level market 74033
- Home prices YoY
- -18.8%
- Active inventory
- 162
- Price-to-rent
- 6.6×
Monthly cashflow live
- Estimated rent
- $1,645 medium interval (Pro) →
- Mortgage (P&I)
- −$681
- Tax from tax record
- −$62 /mo · $744/yr
- Insurance
- −$54
- HOA
- −$0
- Vacancy / Maint / Mgmt
- −$346
- Net cashflow
- $503
Break-even live
UW: 25.0% down · 7.5% · 30yr · 1.5% tax · 5.0% vac · 8.0% maint · 8.0% mgmt
Financing live
Cash to close
- Down payment
- $32,475
- Closing costs
- $3,897
- Reserves months
- —
- Total cash needed
- —
Loan-product check · same deal, 3 products live
Conventional
25% down · 7.5% · 30yr
- Down + closing
- —
- Monthly P&I
- —
- Monthly cashflow
- —
- DSCR
- —
- Eligible?
- —
Personal DTI + credit; lowest rate.
DSCR
20% down · 8.5% · 30yr
- Down + closing
- —
- Monthly P&I
- —
- Monthly cashflow
- —
- DSCR
- —
- Eligible?
- —
No personal income docs; deal must DSCR.
Hard money
10% down · 12.0% · 12mo
- Down + closing
- —
- Monthly P&I
- —
- Monthly cashflow
- —
- DSCR
- —
- Eligible?
- —
Short-term bridge; refi at stabilization.
Rent comps 2 comps
| Address | Beds | Baths | Sqft | Rent | $/sqft | DOM | Units | Dist |
|---|---|---|---|---|---|---|---|---|
| 13743 S Fern St Glenpool, OK | 3.0 | 1.5 | 1139 | $1,450 | $1.27 | 10d | 1 | 0.92mi |
| 13486 S Fern St Glenpool, OK | 3.0 | 1.0 | 976 | $1,245 | $1.28 | 1d | 1 | 1.06mi |
Listing history 18 events
-
2026-04-30status Pending
-
2026-04-24$129,900 Active
-
2021-09-15soldstatus $45,500
-
2021-09-14soldstatus $45,107 Closed 105-char remark
Show marketing remark (105 chars)
Ready to occupy. Mature trees provide great shade from summer heat, needs TLC. Selling "AS IS".
-
2021-08-19status Pending 105-char remark
Show marketing remark (105 chars)
Ready to occupy. Mature trees provide great shade from summer heat, needs TLC. Selling "AS IS".
-
2021-08-02$45,000 Active 105-char remark
Show marketing remark (105 chars)
Ready to occupy. Mature trees provide great shade from summer heat, needs TLC. Selling "AS IS".
-
2013-01-07historical
-
2012-12-07$15,000
-
2012-05-29historical
-
2012-04-05$20,000
-
2010-07-02historical
-
2010-05-07$25,000
-
1998-12-05historical
-
1998-06-05$33,500
-
1996-11-13historical
-
1996-09-10$38,500
-
1993-06-29soldstatus $17,000
-
1987-03-01soldstatus $12,000
ⓘ Source: listings_history table (triggers on properties + properties_extension) + one-shot
backfill from property_details.listing_events for pre-trigger history.
Tax reassessment forecast OK · Resets to sale price
- Current annual tax
- $744 · $62/mo
- Projected year-2 tax
- $1,169 · $97/mo
- Expected delta
- +$425/yr (+$35/mo · 57.1%)
ⓘ Screening estimate from a state-policy table — verify with the county assessor before closing.
Climate risk First Street
- Flood 1/10 Low FEMA zone X (unshaded) · 0% chance over 30 yrs
- Wildfire 7/10 Severe
- Heat 6/10 Major 7 d/yr ≥112°F today · 18 d/yr by 30 yrs out
- Wind 2/10 Low 4% chance of damaging wind over 30 yrs
- Air quality 2/10 Low 1 unhealthy d/yr today · 1 by 30 yrs out
Nearby sold comps map
Loading sold comps map…
Walkable amenities ~0.75 mi
Loading nearby amenities…
Taxation est. · year 1
- Rental income
- $19,745
- − Mortgage interest
- −$7,276
- − Property taxes
- −$744
- − Insurance
- −$650
- − Repairs & maintenance
- −$1,580
- − Management
- −$1,580
- − Depreciation
- −$3,779
- Taxable income
- $4,137
- Est. tax owed @ 24.0%
- −$993
- After-tax cash flow
- $5,038/yr
For passive investors: Depreciation is non-cash, so a rental often shows a tax loss while cash-flowing — sheltering income. Rental losses are passive: they offset passive income freely, and up to $25,000/yr can offset ordinary (W-2) income if you actively participate and your MAGI is under $100k (phasing out to $0 by $150k); unused losses carry forward. On sale, claimed depreciation is recaptured at up to 25%, and gains may owe capital-gains tax (a 1031 exchange can defer both). Figures are a year-1 estimate at your 24.0% rate — not tax advice; consult a CPA.
Schools (NCES district)
- District
- Glenpool
- NCES district ID
- 4012720
- Math proficiency
- 25% ▼ -10.00%
- Reading proficiency
- 27% ▼ -6.00%
- Median HH income
- $60,823
- Composite
- 23.92/100
- National rank
- #7789
- State rank
- #78 of 270 in OK
Livability — Glenpool
- Score
- 70/100
- State rank
- #39
- US rank
- #7699
Category grades
Schools grade is shown separately in the Schools card above.
Census & demographics
- Census place
- Glenpool, OK
- County
- Tulsa County · 640,811 people
- City population
- 13,745
- Metro
- Tulsa, OK
- Population (ZIP)
- 13,745
- Household income
- $80,542
- Rent vs Own
- Severe rent burden
- 288.0
Population outlook (Tulsa County) Hauer SSP2
- Today (2025)
- 723,846 people
- By 2030
- 766,033 · +5.8%
- By 2040
- 851,386 · +17.6%
- By 2050
- 938,389 · +29.6%
- By 2075
- 1,166,011 · +61.1%
- By 2100
- 1,350,277 · +86.5%
Race, ethnicity, and origin ACS 2023
- Neighborhood character
- Diverse neighborhood (Simpson 0.61)
- Race & ethnicity
- White 61% Two or more races 17% Hispanic / Latino 11% Native American 7% Asian 4% Black 4%
- Hispanic origin (detail)
- Mexican 8%
- Common ancestry
- Lithuanian 3% Slovak 2% Romanian 2%
- Foreign-born
- 7% · Canada, Philippines, South Korea
- Languages at home
- 89% English-only · Spanish 6% Other Asian/Pacific 2% Tagalog/Filipino 1%
Political lean MEDSL · Tulsa
- 2024 margin
- R (+15.2) · D 41.3% · R 56.5% · Other 2.2%
- 2008→2024 swing
- +9.2pp toward D · 2008: -24.5pp · 2024: -15.2pp
- All cycles
- 2024: R+15.2 2020: R+15.6 2016: R+22.9 2012: R+27.4 2008: R+24.5
Not yet ingested
- Civics
- —
Market trends
- HPI YoY
- ▼ -51.90%
- Current HPI
- 223.9379
- Rent YoY
- —
- Metro
- Tulsa, OK
- State GDP YoY
- ▲ 1.55%
- F500 in state
- 6
Industry mix (Fortune 500 HQ in OK)
| Industry | F500 HQs | Revenue |
|---|---|---|
| Energy | 3 | $48B |
|
||
Price history
+982.5% since first listed18 events — show timeline
- 2026-04-30 Pending — MLS Technology, Inc.
- 2026-04-24 Listed $129,900 MLS Technology, Inc.
- 2021-09-15 Sold (Public Records) $45,500 Public Records
- 2021-09-14 Sold (MLS) $45,107 MLS Technology, Inc.
- 2021-08-19 Pending — MLS Technology, Inc.
- 2021-08-02 Listed $45,000 MLS Technology, Inc.
- 2013-01-07 Listing Removed — MLS Technology, Inc.
- 2012-12-07 Listed $15,000 MLS Technology, Inc.
- 2012-05-29 Listing Removed — MLS Technology, Inc.
- 2012-04-05 Listed $20,000 MLS Technology, Inc.
- 2010-07-02 Listing Removed — MLS Technology, Inc.
- 2010-05-07 Listed $25,000 MLS Technology, Inc.
- 1998-12-05 Listing Removed — MLS Technology, Inc.
- 1998-06-05 Listed $33,500 MLS Technology, Inc.
- 1996-11-13 Listing Removed — MLS Technology, Inc.
- 1996-09-10 Listed $38,500 MLS Technology, Inc.
- 1993-06-29 Sold (Public Records) $17,000 Public Records
- 1987-03-01 Sold (Public Records) $12,000 Public Records
Property tax history
+7.6%/yrLatest (2025): $744 · -0.1% YoY. Source: county tax records.
Cash-flow waterfall
monthlySold comps — $/sqft
last 12 mo · ≤1 miLoading sold comps…