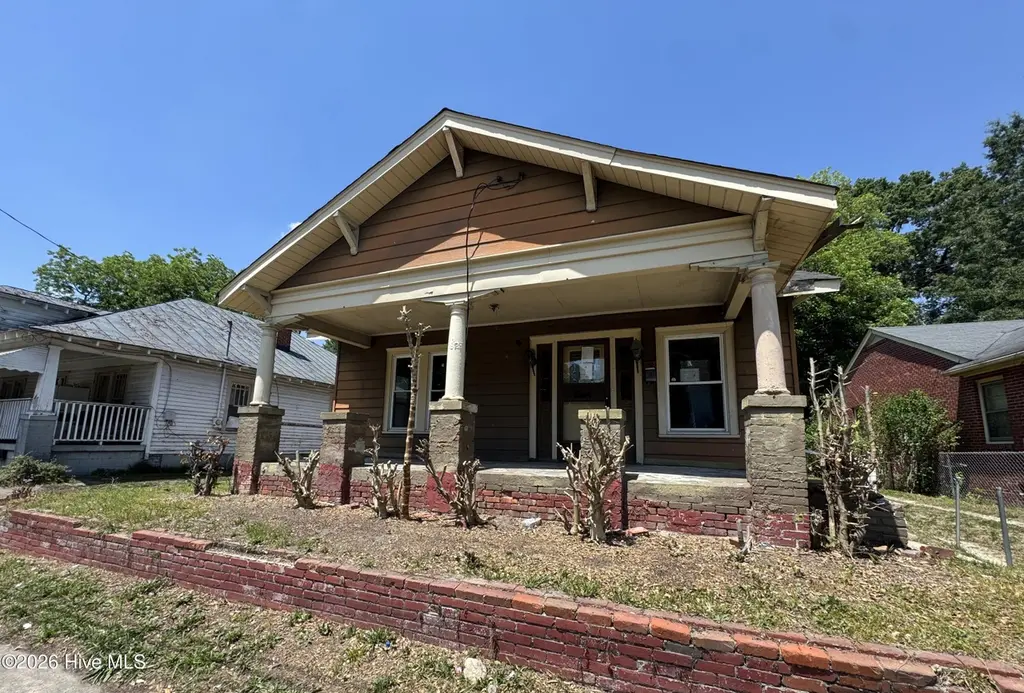
822 W Thomas St · Rocky Mount, NC
Flood risk 1/10 · Minimal
- FEMA flood zone
- X (unshaded)
- Chance of flooding over 30 yrs
- 0.0%
- Est. flood insurance / yr
- $507 – $1,088
Fire risk 3/10 · Minor
- Est. fire insurance / yr
- $906 – $1,684
Heat risk 8/10 · Major
- Hot days now (above 109°F)
- 7 days/yr
- Hot days in 30 yrs
- 16 days/yr
Wind risk 6/10 · Moderate
- Chance of severe wind over 30 yrs
- 73.0%
Air-quality risk 2/10 · Minimal
- Unhealthy air days now
- 1 days/yr
- Unhealthy air days in 30 yrs
- 2 days/yr
Risk factors via First Street. Map © Google.
Why this score? — see what drove the B- grade
The composite is a weighted blend of 9 inputs, each scored 0–100. Each bar is that input's sub-score; the figure is the points it added to the 100-point composite (weight × sub-score).
- Cash flow +30.0/30.0
- 1% rule +10.0/10.0
- DSCR +10.0/10.0
- ARV discount +7.5/15.0
- Livability +3.5/5.0
- Rent growth +2.5/5.0
- Condition / age +2.5/5.0
- Schools +2.2/10.0
- Appreciation +0.0/10.0
$52,000
🖨 Deal sheet 📄 Offer letter ✓ Due diligence
Listing remarks
Built in 1925, this one level home offers approximately 1192 finished square feet, three bedrooms and one full bath and covered front porch. This home sits on an approximate 7405 sqft lot. This home is in need of repairs and TLC. Seller WILL NOT ACTIVATE UTILITIES. Buyer to view home, inspect and confirm all listing information prior to making offer. Seller will NOT allow water service to be turned on for any reason. Property sold "AS-IS" without contingencies. Buyer to check with City/County/Zoning/Tax and other records to determine details to their satisfaction.
Key facts
- 7,405 sq ft lot
- Built 1925
- Listed 6 days
Property features AI
Exterior
- Parking: Unpaved parking
- Utilities: Water available
- Home design: Single-family residence; One story; Entry level on main floor
- Construction: Wood siding/frame construction; Built with crawl space foundation
- Exterior features: Front porch; Partial fencing; Shingle roof; City street and state road frontage
Interior
- Bathrooms: 1 full bathroom
- Heating & cooling: Wall furnace (natural gas); No cooling
- Interior features: Crawl space basement; Total of 5 rooms; Has a view
Neighborhood map
What this means for you Summary
Snapshot
- This is a 3-bed/1.0-bath single-family listed at $52k.
Deal economics
- At list price, monthly cash flow is $924 ($11k/yr) — positive.
- The deal already cash-flows at list — no discount required.
- Meets the 1% rule at list price ($2k rent vs $52k).
- Cap rate 27.6% vs local median 4.5% in Rocky Mount — top-decile yield for the area; either an underpriced asset or a hidden risk that comps aren't pricing in. Stress-test before assuming the spread holds.
Location & tenants
- Location reads 70/100 on livability (#134 in NC) — a middle-class / working-renter tenant base. Strengths: cost of living A+, housing A+, health & safety A+; Watch: crime F, amenities F, employment F.
- Nash-Rocky Mount Schools (rural): math 20% / reading 32% proficiency, ranked #155 of 178 in NC (top 87%) — low school quality limits family demand, transient renter base, plan for 1-2y turnover.
- Zoned schools: Benvenue Elementary (math 14% / reading 25%, grade F, #1,242 of 1,410 statewide, top 90%, 580 students, 88% FRL); Rocky Mount Middle (math 7% / reading 26%, grade F, #449 of 475 statewide, top 96%, 407 students, 97% FRL); Rocky Mount High (math 27% / reading 36%, grade F, #449 of 535 statewide, top 85%, 1,072 students, 76% FRL) — zoned schools average 87% FRL vs 59% district-wide (27 pts higher); higher-poverty schools than district average — tighter screening recommended.
- Market conditions: Rents soft (-0.2%/yr); 392 active listings in the ZIP; 500 units permitted in Nash County in 2024 (0 in 5+ unit buildings).
- This rent runs 31% of the median local income ($61k/yr) — at the standard rent-burdened threshold; future hikes will face affordability resistance.
Forward outlook
- Local home prices are declining (-3.0%/yr); year-one equity from $360 of loan paydown is wiped out by about $2k of value loss. Plan a longer hold.
- Nash County population projected at -12% by 2050 — secular population decline; favor cash flow + early exit over multi-decade hold.
- At projected returns (-3.0% appreciation + 0.0% rent growth), your $15k cash investment doubles in ~2 years — after that, you're playing with house money.
Negotiation context
- Only 7 days on market — expect competitive offers; lowballing is unlikely to land.
Risks & watch-outs
- Watch-outs: built in 1925 — expect roof / HVAC / electrical / plumbing capex.
- Climate carrying-cost: major wind risk, 73% chance of damaging wind over 30y; extreme-heat days projected 7→16/yr by 2055 (HVAC capex compounding) — expect insurance premiums to compound above CPI over the hold.
Questions for the listing agent
- Built in 1925 — when were the roof, HVAC, electrical panel, plumbing, and water heater last replaced?
- Is there a deadline driving the sale (1031 exchange, divorce, estate, relocation)? That informs how much negotiation room exists.
- Schools are F-rated, which usually means shorter tenancies and higher turnover. Who's the typical renter profile here, and what's been the actual vacancy rate?
- Crime grade is F in this area — have there been break-ins, vandalism, or insurance claims at this property in the last 3 years? What carrier currently insures it and at what premium?
- What's the average days-on-market for RENTAL listings here right now (not sales)? A rising rental-DOM trend means longer vacancies and softer asking-rent achievability than the comps imply.
- What's the recent tenant-quality profile in this submarket — average credit score on applications, eviction rate, late-payment / NSF rate, and stable-employment percentage? A property-management company in the area should have these aggregated.
- How much new for-sale + rental construction is in the pipeline within 1–3 miles? Heavy new supply typically softens prices + rents 12–24 months out; constrained supply supports both.
Investment metrics
- 1% rule
- 3.01% ✓
- Cap rate
- 27.62%
- Cash-on-cash
- 76.18%
- DSCR
- 4.39
- GRM
- 2.8
CMA / ARV
- ARV (on-the-fly)
- $154,960
- Comps found
- 12
Show comp detail 12 sales within ~0.75 mi
| Address | Dist | Beds/Ba | Sqft | Sold | Price | $/sf | Match |
|---|---|---|---|---|---|---|---|
| 1005 W Thomas St | 0.13mi | 2/1.0 (-1) | 1,150 (-4%) | 2mo | $118,000 | $103 | 82 |
| 1112 Western Ave | 0.31mi | 3/1.5 | 1,176 (-1%) | 12mo | $178,000 | $151 | 71 |
| 216 S Tillery St | 0.31mi | 3/1.0 | 1,324 (+11%) | 4mo | $74,500 | $56 | 64 |
| 711 Mill St | 0.40mi | 3/4.0 | 1,121 (-6%) | 3mo | $199,000 | $178 | 57 |
| 1417 Sunset Ave | 0.56mi | 3/2.0 | 1,103 (-8%) | 2mo | $142,000 | $129 | 55 |
| 1319 W Thomas St | 0.44mi | 3/1.0 | 1,056 (-11%) | 14mo | $149,900 | $142 | 49 |
| 733 Cedarbrook Dr | 0.69mi | 3/1.0 | 1,322 (+11%) | 2mo | $84,000 | $64 | 48 |
| 708 Cedarbrook Dr | 0.64mi | 3/1.5 | 1,315 (+10%) | 6mo | $159,900 | $122 | 45 |
| 736 Cedarbrook Dr | 0.71mi | 4/2.0 (+1) | 1,260 (+6%) | 8mo | $168,500 | $134 | 41 |
| 210 Earl St | 0.43mi | 2/1.0 (-1) | 1,026 (-14%) | 13mo | $133,000 | $130 | 41 |
| 704 S Pine St | 0.66mi | 3/1.0 | 1,020 (-14%) | 7mo | $67,000 | $66 | 39 |
| 1205 W West Haven Blvd | 0.65mi | 3/1.5 | 1,362 (+14%) | 8mo | $273,000 | $200 | 38 |
Match score weights: distance 35% · size 25% · config 20% · recency 20%. Top-matched comps best support the ARV.
Projected returns pro-forma
-3.0% appreciation · 0.0% rent growth · sell at horizon
- IRR
- 72.8%
- Equity multiple
- 4.15×
- Total profit
- $45,848
- Equity at exit
- $7,753
- IRR
- 75.8%
- Equity multiple
- 7.73×
- Total profit
- $97,972
- Equity at exit
- $4,496
Cash invested: $14,560 (down + closing). Projections, not guarantees.
Landlord ↔ Tenant lean methodology
- Overall (STATE)
- 85 Strongly Landlord-Friendly
- State North Carolina
- 85 Strongly Landlord-Friendly · R+3
- County
- — inherits STATE
- City
- — inherits STATE
ZIP-level market 27804
- Rents YoY
- -0.2%
- Active inventory
- 392
- Price-to-rent
- 2.8×
Monthly cashflow live
- Estimated rent
- $1,566 medium interval (Pro) →
- Mortgage (P&I)
- −$273
- Tax from tax record
- −$18 /mo · $219/yr
- Insurance
- −$22
- HOA
- −$0
- Vacancy / Maint / Mgmt
- −$329
- Net cashflow
- $924
Break-even live
UW: 25.0% down · 7.5% · 30yr · 1.5% tax · 5.0% vac · 8.0% maint · 8.0% mgmt
Financing live
Cash to close
- Down payment
- $13,000
- Closing costs
- $1,560
- Reserves months
- —
- Total cash needed
- —
Loan-product check · same deal, 3 products live
Conventional
25% down · 7.5% · 30yr
- Down + closing
- —
- Monthly P&I
- —
- Monthly cashflow
- —
- DSCR
- —
- Eligible?
- —
Personal DTI + credit; lowest rate.
DSCR
20% down · 8.5% · 30yr
- Down + closing
- —
- Monthly P&I
- —
- Monthly cashflow
- —
- DSCR
- —
- Eligible?
- —
No personal income docs; deal must DSCR.
Hard money
10% down · 12.0% · 12mo
- Down + closing
- —
- Monthly P&I
- —
- Monthly cashflow
- —
- DSCR
- —
- Eligible?
- —
Short-term bridge; refi at stabilization.
Listing history 13 events
-
2026-06-19days on market $52,000 Active 7 DOM
-
2026-06-18days on market $52,000 Active 6 DOM
-
2026-06-17days on market $52,000 Active 5 DOM
-
2026-06-16days on market $52,000 Active 4 DOM
-
2026-06-15days on market $52,000 Active 3 DOM
-
2026-06-13remarks 570-char remark
-
2026-06-13days on market $52,000 Active 1 DOM
-
2026-06-03days on market $52,000 Active 11 DOM
-
2026-06-02days on market $52,000 Active 10 DOM
-
2026-06-01days on market $52,000 Active 9 DOM
-
2026-05-31days on market $52,000 Active 8 DOM
-
2026-05-30days on market $52,000 Active 7 DOM
-
2026-05-22$52,000 Active
ⓘ Source: listings_history table (triggers on properties + properties_extension) + one-shot
backfill from property_details.listing_events for pre-trigger history.
Tax reassessment forecast NC · Resets to sale price
- Current annual tax
- $219 · $18/mo
- Projected year-2 tax
- $426 · $36/mo
- Expected delta
- +$207/yr (+$17/mo · 94.7%)
ⓘ Screening estimate from a state-policy table — verify with the county assessor before closing.
Climate risk First Street
- Flood 1/10 Low FEMA zone X (unshaded) · 0% chance over 30 yrs
- Wildfire 3/10 Moderate
- Heat 8/10 Severe 7 d/yr ≥109°F today · 16 d/yr by 30 yrs out
- Wind 6/10 Major 73% chance of damaging wind over 30 yrs
- Air quality 2/10 Low 1 unhealthy d/yr today · 2 by 30 yrs out
Nearby sold comps map
Loading sold comps map…
Walkable amenities ~0.75 mi
Loading nearby amenities…
Taxation est. · year 1
- Rental income
- $18,788
- − Mortgage interest
- −$2,913
- − Property taxes
- −$219
- − Insurance
- −$260
- − Repairs & maintenance
- −$1,503
- − Management
- −$1,503
- − Depreciation
- −$1,513
- Taxable income
- $10,877
- Est. tax owed @ 24.0%
- −$2,611
- After-tax cash flow
- $8,481/yr
For passive investors: Depreciation is non-cash, so a rental often shows a tax loss while cash-flowing — sheltering income. Rental losses are passive: they offset passive income freely, and up to $25,000/yr can offset ordinary (W-2) income if you actively participate and your MAGI is under $100k (phasing out to $0 by $150k); unused losses carry forward. On sale, claimed depreciation is recaptured at up to 25%, and gains may owe capital-gains tax (a 1031 exchange can defer both). Figures are a year-1 estimate at your 24.0% rate — not tax advice; consult a CPA.
Schools (NCES district)
- District
- Nash-Rocky Mount Schools
- NCES district ID
- 3703270
- Math proficiency
- 20% ▼ -3.00%
- Reading proficiency
- 32% ▲ 1.00%
- Median HH income
- $41,553
- Composite
- 22.04/100
- National rank
- #8198
- State rank
- #155 of 178 in NC
Livability — Rocky Mount
- Score
- 70/100
- State rank
- #134
- US rank
- #7692
Category grades
Schools grade is shown separately in the Schools card above.
Census & demographics
- Census place
- Rocky Mount, NC
- County
- Nash County · 50,768 people
- City population
- 70,300
- Metro
- Rocky Mount, NC
- Population (ZIP)
- 30,713
- Household income
- $61,359
- Rent vs Own
- Severe rent burden
- 710.0
Population outlook (Nash County) Hauer SSP2
- Today (2025)
- 91,107 people
- By 2030
- 89,193 · -2.1%
- By 2040
- 84,959 · -6.7%
- By 2050
- 80,517 · -11.6%
- By 2075
- 72,941 · -19.9%
- By 2100
- 63,602 · -30.2%
Race, ethnicity, and origin ACS 2023
- Neighborhood character
- Diverse neighborhood (Simpson 0.59)
- Race & ethnicity
- Black 52% White 38% Hispanic / Latino 6% Two or more races 3% Asian 1%
- Hispanic origin (detail)
- Mexican 2%
- Common ancestry
- Lithuanian 1% Italian 1% Slovak 1%
- Foreign-born
- 4% · Canada
- Languages at home
- 94% English-only · Spanish 5% Other Indo-European 1%
Political lean MEDSL · Nash
- 2024 margin
- Toss-up / Even · D 48.7% · R 50.5%
- 2008→2024 swing
- -0.4pp no change · 2008: -1.3pp · 2024: -1.8pp
- All cycles
- 2024: R+1.8 2020: D+0.2 2016: R+0.2 2012: D+0.9 2008: R+1.3
Not yet ingested
- Civics
- —
Market trends
- HPI YoY
- ▼ -142.83%
- Current HPI
- 183.0082
- Rent YoY
- ▼ -0.17%
- Metro
- Rocky Mount, NC
- State GDP YoY
- ▲ 3.28%
- F500 in state
- 26
Industry mix (Fortune 500 HQ in NC)
| Industry | F500 HQs | Revenue |
|---|---|---|
| Financial Services | 2 | $213B |
|
||
| Retail | 2 | $95B |
|
||
| Industrial Conglomerate | 1 | $38B |
|
||
| Metals / Steel | 1 | $35B |
|
||
| Utilities | 1 | $30B |
|
||
| Industrial Machinery | 1 | $19B |
|
||
Price history
1 event — show timeline
- 2026-05-22 Listed $52,000 Hive MLS
Property tax history
+13.7%/yrLatest (2025): $219 · +0.0% YoY. Source: county tax records.
Cash-flow waterfall
monthlySold comps — $/sqft
last 12 mo · ≤1 miLoading sold comps…