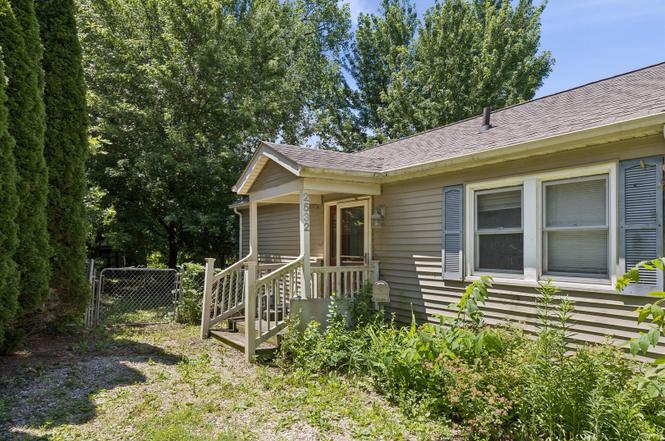
2532 Roberts St · Bettendorf, IA
Flood risk 1/10 · Minimal
- FEMA flood zone
- X (unshaded)
- Chance of flooding over 30 yrs
- 0.0%
- Est. flood insurance / yr
- $473 – $860
Fire risk 1/10 · Minimal
- Est. fire insurance / yr
- $902 – $1,676
Heat risk 3/10 · Minor
- Hot days now (above 103°F)
- 7 days/yr
- Hot days in 30 yrs
- 16 days/yr
Wind risk 2/10 · Minimal
- Chance of severe wind over 30 yrs
- —
Air-quality risk 3/10 · Minor
- Unhealthy air days now
- 2 days/yr
- Unhealthy air days in 30 yrs
- 3 days/yr
Risk factors via First Street. Map © Google.
Why this score? — see what drove the D- grade
The composite is a weighted blend of 9 inputs, each scored 0–100. Each bar is that input's sub-score; the figure is the points it added to the 100-point composite (weight × sub-score).
- Cash flow +11.2/30.0
- Schools +6.5/10.0
- ARV discount +4.9/15.0
- Livability +4.0/5.0
- DSCR +3.3/10.0
- Rent growth +3.2/5.0
- 1% rule +3.1/10.0
- Condition / age +2.5/5.0
- Appreciation +0.0/10.0
$217,500
🖨 Deal sheet (PDF) 📄 Offer letter ✓ Due diligence
Listing remarks MLS
Bettendorf home ready for its new owner! Tucked away in a quiet neighborhood, you will be amazed at what this property has to offer. This 3BR, 2BA home was remodeled & expanded in 2010. Transformation included a large family/great room and new kitchen with an open floor plan, main floor laundry room, deck & 2 car garage. Enjoy outdoor living from the covered porch, deck or in the large yard that is completely fenced. Two driveways: one at front door, 2nd driveway with garage plus a parking pad for your RV, boat or additional guest parking. Sliding doors to deck from both the family/great room and master bedroom. Gas line has been installed for a gas fireplace to be added in family/great room. Additional features that enhance this home: Vaulted ceiling in family/great room, ceiling fans throughout, kitchen pantry and gardening shed. Dishwasher, microwave & refrigerator included (no stove). Vacant/easy to show.
Key facts
- Open floor plan
- Updated bath
- Large yard
Tags
Property features AI
Finance
- Other: Living area source: Assessor; Parcel number listed
- HOA & community: No master association fee required
Exterior
- Utilities: Public water; Public sewer
- Home design: Detached single-family home; One-story layout; Approximately 1,352 finished main-level living area; Total finished and unfinished area about 1,968; Home is over 100 years old; Built before 1978
- Construction: Aluminum siding; Asphalt roof; Concrete perimeter foundation
- Exterior features: Deck; Fenced yard; Lot between 0.25 and 0.49 acre
Interior
- Kitchen: Range; Microwave; Dishwasher; Refrigerator; Kitchen on main level (14 x 12)
- Bedrooms: Three bedrooms on the main level (Master 10 x 17, Bedroom 2 10 x 11, Bedroom 3 9 x 9)
- Bathrooms: One full bath; One half bath; Master bath is a half bath; No tub
- Heating & cooling: Natural gas forced air heating; Central air conditioning
- Interior features: Five total rooms; Unfinished full basement with egress window
- Laundry & utility: Washer; Dryer; Main-level laundry (4 x 6)
Neighborhood map
What this means for you Summary
Snapshot
- This is a 2-bed/1.5-bath single-family listed at $218k.
Deal economics
- At list price, monthly cash flow is $-82 ($-985/yr) — negative.
- To cash-flow at today's rent, offer at most $203k (6.7% below list).
- To meet the 1% rule (rent ≥ 1% of price), the offer needs to be $176k (18.9% below list).
- Recommended offer: $176k (18.9% below list) — sets the bar for 1% rule.
- Cap rate 5.8% vs local median 3.0% in Bettendorf — top-decile yield for the area; either an underpriced asset or a hidden risk that comps aren't pricing in. Stress-test before assuming the spread holds.
Location & tenants
- Location reads 81/100 on livability (#73 in IA, #1,579 nationally) — a professional / high-income tenant draw. Strengths: crime A+, employment A+, housing A+; Watch: amenities F, commute F.
- Bettendorf Community School District (suburban): math 74% / reading 75% proficiency, ranked #57 of 289 in IA (top 20%) — strong family-tenant draw, lease renewals of 3-5y typical.
- Zoned schools: Neil Armstrong Elementary School (math 57% / reading 62%, grade B-, #390 of 616 statewide, top 69%, 272 students, 52% FRL); Bettendorf Middle School (math 77% / reading 75%, grade A, #59 of 246 statewide, top 26%, 987 students, 32% FRL); Bettendorf High School (math 71% / reading 77%, grade B+, #103 of 336 statewide, top 32%, 1,482 students, 31% FRL).
- Market conditions: Rents rising (+2.9%/yr); 432 active listings in the ZIP; 7 comparable units currently listed for rent nearby; rentals at typical pace (median 23d on market — plan ~3-4 weeks tenant-placement turnaround); 43% of comp listings sitting > 30 days — soft ceiling on asking rent; solid renter incomes; 805 units permitted in Scott County in 2024 (479 in 5+ unit buildings).
Forward outlook
- Local home prices are declining (-3.0%/yr); year-one equity from $2k of loan paydown is wiped out by about $7k of value loss. Plan a longer hold.
- Scott County population projected at +19% by 2050 — long-run rental-demand tailwind backs the buy-and-hold thesis.
Negotiation context
- Only 3 days on market — expect competitive offers; lowballing is unlikely to land.
- 4 sale attempts since 26y ago with the ask held roughly flat each time — persistent listings suggest the price (not the market) is what's stuck; bring a comps-based counter.
- Current owner paid $164k; 33% above their basis — modest negotiation headroom, anchor on the comps not their cost.
Risks & watch-outs
- Watch-outs: built in 1919 — expect roof / HVAC / electrical / plumbing capex.
Questions for the listing agent
- What do current leases actually rent for vs. the listed asking? Can we see a recent rent roll and the last 12 months of T-12 income?
- Built in 1919 — when were the roof, HVAC, electrical panel, plumbing, and water heater last replaced?
- Is there a deadline driving the sale (1031 exchange, divorce, estate, relocation)? That informs how much negotiation room exists.
- Schools are A-rated — typically a magnet for longer-tenancy family renters. What's the average tenant stay here, and is there a school-zone premium baked into asking?
- The area grade is low — what's the realistic commute time and amenity access for the typical tenant pool here? Any planned neighborhood developments (good or bad) we should know about?
- What's the average days-on-market for RENTAL listings here right now (not sales)? A rising rental-DOM trend means longer vacancies and softer asking-rent achievability than the comps imply.
- What's the recent tenant-quality profile in this submarket — average credit score on applications, eviction rate, late-payment / NSF rate, and stable-employment percentage? A property-management company in the area should have these aggregated.
- How much new for-sale + rental construction is in the pipeline within 1–3 miles? Heavy new supply typically softens prices + rents 12–24 months out; constrained supply supports both.
Investment metrics
- 1% rule
- 0.81% ✗
- Cap rate
- 5.84%
- Cash-on-cash
- -1.62%
- DSCR
- 0.93
- GRM
- 10.3
CMA / ARV
- ARV (on-the-fly)
- $205,504
- Comps found
- 12
Show comp detail 12 sales within ~0.75 mi
| Address | Dist | Beds/Ba | Sqft | Sold | Price | $/sf | Match |
|---|---|---|---|---|---|---|---|
| 2538 Bellevue Ave | 0.17mi | 3/2.0 (+1) | 1,400 (+4%) | 2mo | $201,000 | $144 | 77 |
| 822 28th St | 0.13mi | 3/2.0 (+1) | 1,150 (-15%) | 0mo | $168,000 | $146 | 62 |
| 922 19th St | 0.43mi | 3/2.5 (+1) | 1,364 (+1%) | 10mo | $270,000 | $198 | 61 |
| 2838 Bellevue Ave | 0.30mi | 2/1.5 | 1,149 (-15%) | 1mo | $190,000 | $165 | 60 |
| 723 31st St | 0.44mi | 3/1.5 (+1) | 1,376 (+2%) | 15mo | $186,000 | $135 | 59 |
| 1 Riverview Ln | 0.60mi | 3/1.0 (+1) | 1,352 (0%) | 8mo | $205,000 | $152 | 58 |
| 605 16th St | 0.65mi | 3/2.0 (+1) | 1,297 (-4%) | 7mo | $139,900 | $108 | 50 |
| 2910 Central Ave | 0.31mi | 3/1.0 (+1) | 1,152 (-15%) | 12mo | $147,500 | $128 | 44 |
| 1019 31st St | 0.48mi | 3/2.5 (+1) | 1,481 (+10%) | 12mo | $235,000 | $159 | 42 |
| 1955 N Oak St | 0.45mi | 3/2.0 (+1) | 1,164 (-14%) | 8mo | $173,500 | $149 | 42 |
| 1815 Lincoln Rd | 0.63mi | 3/2.0 (+1) | 1,245 (-8%) | 10mo | $242,500 | $195 | 42 |
| 1609 Alcoa Ave | 0.72mi | 3/2.0 (+1) | 1,286 (-5%) | 14mo | $217,000 | $169 | 40 |
Match score weights: distance 35% · size 25% · config 20% · recency 20%. Top-matched comps best support the ARV.
Projected returns pro-forma
-3.0% appreciation · 2.88% rent growth · sell at horizon
- IRR
- -19.1%
- Equity multiple
- 0.33×
- Total profit
- $-40,675
- Equity at exit
- $32,430
- IRR
- -11.9%
- Equity multiple
- 0.29×
- Total profit
- $-42,982
- Equity at exit
- $18,805
Cash invested: $60,900 (down + closing). Projections, not guarantees.
Landlord ↔ Tenant lean methodology
- Overall (STATE)
- 83 Strongly Landlord-Friendly
- State Iowa
- 83 Strongly Landlord-Friendly · R+6
- County
- — inherits STATE
- City
- — inherits STATE
ZIP-level market 52722
- Rents YoY
- 2.9%
- Active inventory
- 432
- Price-to-rent
- 10.3×
Monthly cashflow live
- Estimated rent
- $1,763 high interval (Pro) →
- Mortgage (P&I)
- −$1,141
- Tax from tax record
- −$244 /mo · $2,922/yr
- Insurance
- −$91
- HOA
- −$0
- Vacancy / Maint / Mgmt
- −$370
- Net cashflow
- $-82
Break-even live
Sensitivity live
| Price | -10% $41 | -5% $-21 | +0% $-82 | +5% $-144 | +10% $-205 |
|---|---|---|---|---|---|
| Rent | -10% $-221 | -5% $-152 | +0% $-82 | +5% $-12 | +10% $57 |
| Rate | -1.0pp $27 | -0.5pp $-27 | base $-82 | +0.5pp $-138 | +1.0pp $-196 |
UW: 25.0% down · 7.5% · 30yr · 1.5% tax · 5.0% vac · 8.0% maint · 8.0% mgmt
Financing live
Cash to close
- Down payment
- $54,375
- Closing costs
- $6,525
- Reserves months
- —
- Total cash needed
- —
Loan-product check · same deal, 3 products live
Conventional
25% down · 7.5% · 30yr
- Down + closing
- —
- Monthly P&I
- —
- Monthly cashflow
- —
- DSCR
- —
- Eligible?
- —
Personal DTI + credit; lowest rate.
DSCR
20% down · 8.5% · 30yr
- Down + closing
- —
- Monthly P&I
- —
- Monthly cashflow
- —
- DSCR
- —
- Eligible?
- —
No personal income docs; deal must DSCR.
Hard money
10% down · 12.0% · 12mo
- Down + closing
- —
- Monthly P&I
- —
- Monthly cashflow
- —
- DSCR
- —
- Eligible?
- —
Short-term bridge; refi at stabilization.
Rent comps 7 comps
| Address | Beds | Baths | Sqft | Rent | $/sqft | DOM | Units | Dist |
|---|---|---|---|---|---|---|---|---|
| 2500 Grant St Unit 212 Bettendorf, IA | 2.0 | 1.0 | 1304 | $2,315 | $1.78 | 45d | 1 | 0.21mi |
| 1815 Cody St Bettendorf, IA | 3.0 | 2.0 | 1008 | $1,800 | $1.79 | 23d | 1 | 0.57mi |
| 1212 16th 1/2 St Bettendorf, IA | 3.0 | 1.0 | 894 | $1,795 | $2.01 | 46d | 1 | 0.69mi |
| 1156 Devils Glen Rd Bettendorf, IA | 3.0 | 1.0–2.0 | 800 | $1,543 | $1.93 | 15d | 9 | 0.71mi |
| 1414 Central Ave Bettendorf, IA | 3.0 | 2.0 | 1295 | $1,995 | $1.54 | 45d | 1 | 0.79mi |
| 2900 River Dr Moline, IL | 1.0–3.0 | 1.0–2.0 | 1137 | $1,399 | $1.23 | 23d | 1 | 1.12mi |
| 730 Lincoln Rd Bettendorf, IA | 2.0 | 1.0 | 984 | $1,300 | $1.32 | 23d | 1 | 1.39mi |
Listing history 3 events
-
2026-06-21days on market $217,500 Active 3 DOM
-
2026-06-18remarks 645-char remark
-
2026-06-18$217,500 Active 1 DOM
ⓘ Source: listings_history table (triggers on properties + properties_extension) + one-shot
backfill from property_details.listing_events for pre-trigger history.
Tax reassessment forecast IA · Partial reset (capped growth)
- Current annual tax
- $2,922 · $244/mo
- Projected year-2 tax
- $3,168 · $264/mo
- Expected delta
- +$246/yr (+$21/mo · 8.4%)
ⓘ Screening estimate from a state-policy table — verify with the county assessor before closing.
Climate risk First Street
- Flood 1/10 Low FEMA zone X (unshaded) · 0% chance over 30 yrs
- Wildfire 1/10 Low
- Heat 3/10 Moderate 7 d/yr ≥103°F today · 16 d/yr by 30 yrs out
- Wind 2/10 Low
- Air quality 3/10 Moderate 2 unhealthy d/yr today · 3 by 30 yrs out
Nearby sold comps map
Loading sold comps map…
Walkable amenities ~0.75 mi
Loading nearby amenities…
Taxation est. · year 1
- Rental income
- $21,154
- − Mortgage interest
- −$12,183
- − Property taxes
- −$2,922
- − Insurance
- −$1,088
- − Repairs & maintenance
- −$1,692
- − Management
- −$1,692
- − Depreciation
- −$6,327
- Taxable loss
- −$4,751
- Est. tax savings @ 24.0%
- +$1,140
- After-tax cash flow
- $155/yr
For passive investors: Depreciation is non-cash, so a rental often shows a tax loss while cash-flowing — sheltering income. Rental losses are passive: they offset passive income freely, and up to $25,000/yr can offset ordinary (W-2) income if you actively participate and your MAGI is under $100k (phasing out to $0 by $150k); unused losses carry forward. On sale, claimed depreciation is recaptured at up to 25%, and gains may owe capital-gains tax (a 1031 exchange can defer both). Figures are a year-1 estimate at your 24.0% rate — not tax advice; consult a CPA.
Schools (NCES district)
- District
- Bettendorf Community School District
- NCES district ID
- 1904860
- Math proficiency
- 74% ▼ -6.00%
- Reading proficiency
- 75% ▼ -2.00%
- Median HH income
- $66,823
- Composite
- 64.71/100
- National rank
- #522
- State rank
- #57 of 289 in IA
Livability — Bettendorf
- Score
- 81/100
- State rank
- #73
- US rank
- #1579
Category grades
Schools grade is shown separately in the Schools card above.
Census & demographics
- Census place
- Bettendorf, IA
- County
- Scott County · 144,583 people
- City population
- 41,264
- Metro
- Davenport-Moline-Rock Island, IA-IL
- Population (ZIP)
- 41,264
- Household income
- $101,546
- Rent vs Own
- Severe rent burden
- 935.0
Population outlook (Scott County) Hauer SSP2
- Today (2025)
- 188,878 people
- By 2030
- 196,648 · +4.1%
- By 2040
- 210,860 · +11.6%
- By 2050
- 224,359 · +18.8%
- By 2075
- 258,884 · +37.1%
- By 2100
- 286,447 · +51.7%
Race, ethnicity, and origin ACS 2023
- Neighborhood character
- Predominantly White (82%)
- Race & ethnicity
- White 82% Asian 7% Two or more races 7% Hispanic / Latino 5% Black 2%
- Common ancestry
- Portuguese 3% Italian 3% Romanian 2%
- Foreign-born
- 7% · Canada, China, Vietnam
- Languages at home
- 92% English-only · Other Asian/Pacific 2% Spanish 2% Other Indo-European 1%
Political lean MEDSL · Scott
- 2024 margin
- Toss-up / Even · D 47.3% · R 51.2% · Other 1.4%
- 2008→2024 swing
- -18.4pp toward R · 2008: 14.6pp · 2024: -3.9pp
- All cycles
- 2024: R+3.9 2020: D+3.5 2016: D+1.4 2012: D+13.8 2008: D+14.6
Not yet ingested
- Civics
- —
Market trends
- HPI YoY
- ▼ -111.45%
- Current HPI
- 194.8355
- Rent YoY
- ▲ 2.88%
- Metro
- Davenport-Moline-Rock Island, IA-IL
- State GDP YoY
- ▲ 2.48%
- F500 in state
- 4
Industry mix (Fortune 500 HQ in IA)
| Industry | F500 HQs | Revenue |
|---|---|---|
| Financial Services | 1 | $16B |
|
||
| Retail / Convenience | 1 | $15B |
|
||
Price history
+198.4% since first listed9 events — show timeline
- 2026-06-18 Listed $217,500 MRED as Distributed by MLS Grid
- 2021-08-06 Listing Removed — RMLSA as Distributed by MLS Grid
- 2020-06-08 Sold (MLS) $164,000 RMLSA as Distributed by MLS Grid
- 2020-06-08 Sold (MLS) $164,000 MRED as Distributed by MLS Grid
- 2020-05-01 Listed $159,900 RMLSA as Distributed by MLS Grid
- 2020-05-01 Listed $159,900 MRED as Distributed by MLS Grid
- 2000-09-18 Sold (MLS) $74,000 RMLSA as Distributed by MLS Grid
- 2000-07-03 Listed $72,900 RMLSA as Distributed by MLS Grid
- 1998-07-03 Listing Removed — MRED as Distributed by MLS Grid
Property tax history
+6.3%/yrLatest (2025): $2,922 · -9.0% YoY. Source: county tax records.
Cash-flow waterfall
monthlySold comps — $/sqft
last 12 mo · ≤1 miLoading sold comps…