 🏗️ New Construction
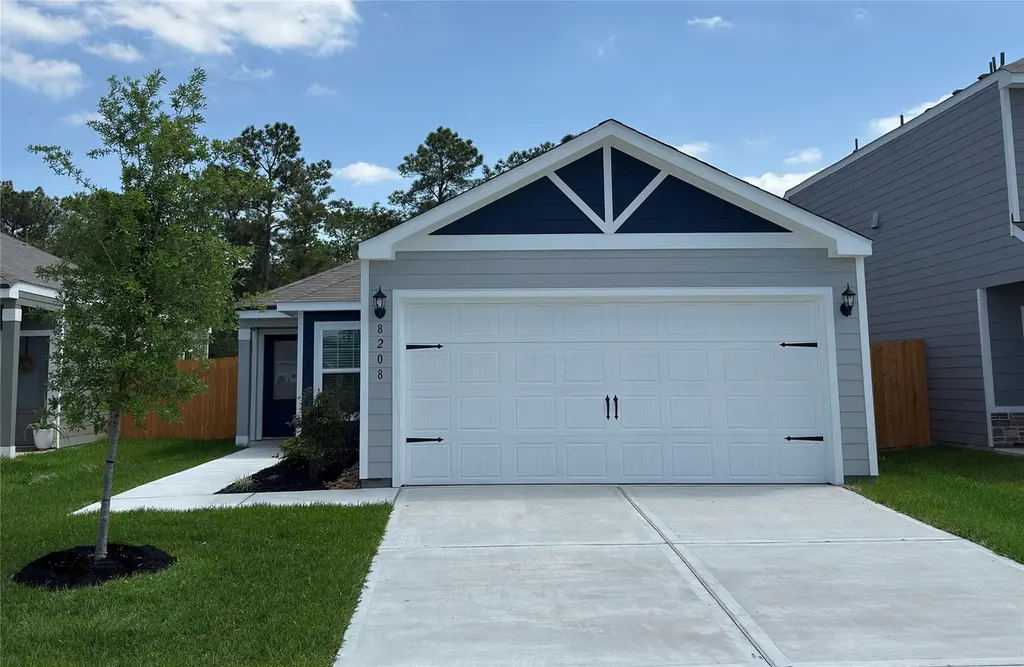
8208 Sunberry Shadow Dr · Houston, TX
Flood risk No data
- FEMA flood zone
- —
- Chance of flooding over 30 yrs
- —
- Est. flood insurance / yr
- —
Fire risk No data
- Est. fire insurance / yr
- —
Heat risk No data
- Hot days now (above threshold)
- —
- Hot days in 30 yrs
- —
Wind risk No data
- Chance of severe wind over 30 yrs
- —
Air-quality risk No data
- Unhealthy air days now
- —
- Unhealthy air days in 30 yrs
- —
Risk factors via First Street. Map © Google.
Why this score? — see what drove the D- grade
The composite is a weighted blend of 9 inputs, each scored 0–100. Each bar is that input's sub-score; the figure is the points it added to the 100-point composite (weight × sub-score).
- Appreciation +9.3/10.0
- ARV discount +7.5/15.0
- Cash flow +6.9/30.0
- Livability +3.7/5.0
- Schools +2.7/10.0
- Rent growth +2.6/5.0
- Condition / age +2.5/5.0
- 1% rule +2.0/10.0
- DSCR +1.1/10.0
$252,900
🖨 Deal sheet 📄 Offer letter ✓ Due diligence
Listing remarks
The Atticus floor plan offers comfortable, single-story living with 3 bedrooms, 2 bathrooms and 1,076 sq ft in the desirable Wayside Village community. Designed with everyday life in mind, this open-concept home features a chef-ready kitchen with granite countertops, Whirlpool® energy-efficient appliances and beautiful wood cabinetry. The kitchen flows seamlessly into the spacious family room, creating the perfect space for relaxing or entertaining. The private primary suite includes a large walk-in closet and en-suite bath, while two additional bedrooms offer flexibility for guests or a home office.
Key facts
- Single-story living
- Chef-ready kitchen
- Granite countertops
Tags
Property features AI
Finance
- Financial info: Lease considered
- HOA & community: Has association (LEAD); Annual association fee; Association amenities include trails; Curbs in community
Exterior
- Parking: Attached 2-car garage with garage door opener
- Security: Owned security system; Smoke detectors
- Utilities: Public water; Public sewer
- Home design: Residential property; New construction (2026); Slab foundation; Composition roof
- Construction: Built by LGI Homes; Composition roof; Slab foundation; Year built 2026
- Exterior features: Deck; Patio; Private yard; Fence — backyard; Subdivision setting; Concrete road surface
Interior
- Kitchen: Dishwasher; Electric cooktop; Electric oven; Microwave; Disposal; Refrigerator; ENERGY STAR qualified appliances
- Bedrooms: Primary bedroom (First floor) — 14 x 12; Bedroom (First floor) — 10 x 10; Bedroom (First floor) — 10 x 11
- Flooring: Carpet; Plank flooring; Vinyl
- Bathrooms: 2 full bathrooms; Primary bathroom (First floor) — 5 x 8; Bathroom (First floor) — 5 x 8
- Heating & cooling: Central heating (electric, heat pump); Central air conditioning (electric)
- Interior features: Breakfast bar; Granite counters; Kitchen and family room combo; Pantry; Tub/shower; Window treatments; Ceiling fans; Kitchen and dining combo; Programmable thermostat; Low emissivity windows; Window coverings; 9 total rooms
- Laundry & utility: Utility room (First floor) — 6 x 6; Washer hookup; Electric dryer hookup
Neighborhood map
What this means for you Summary
Snapshot
- This is a 3-bed/2.0-bath single-family listed at $253k.
Deal economics
- At list price, monthly cash flow is $-372 ($-4k/yr) — negative.
- To cash-flow at today's rent, offer at most $195k (23.0% below list).
- To meet the 1% rule (rent ≥ 1% of price), the offer needs to be $175k (30.8% below list).
- Recommended offer: $175k (30.8% below list) — sets the bar for 1% rule.
- Cap rate 4.5% vs local median 3.2% in Houston — top-decile yield for the area; either an underpriced asset or a hidden risk that comps aren't pricing in. Stress-test before assuming the spread holds.
Location & tenants
- Location reads 74/100 on livability (#184 in TX, #4,771 nationally) — a middle-class / working-renter tenant base. Strengths: amenities A+, cost of living A+, housing A+; Watch: crime F.
- Houston ISD (urban): math 27% / reading 35% proficiency, ranked #593 of 826 in TX (top 72%) — families likely to look elsewhere, expect single-tenant / working-renter base with shorter leases; 71% free/reduced lunch — lower-income household profile, screen leases tightly.
- Zoned schools: Forest Brook Middle (math 12% / reading 14%, grade F, #1,609 of 1,662 statewide, top 97%, 613 students, 98% FRL); North Forest H S (math 13% / reading 18%, grade F, #1,505 of 1,632 statewide, top 92%, 974 students, 97% FRL) — zoned schools average 98% FRL vs 71% district-wide (27 pts higher); higher-poverty schools than district average — tighter screening recommended.
- Zoned-school proficiency averages 14% at this address vs 31% district-wide (-17 pts) — the specific schools serving this property underperform the Houston ISD average; the district grade overstates school quality for this exact location.
- Market conditions: Rents flat; 372 active listings in the ZIP; 26 comparable units currently listed for rent nearby; rentals lingering (median 44d on market — plan ~5-8 weeks vacancy on turnover, expect pricing pressure); 50% of comp listings sitting > 30 days — soft ceiling on asking rent; 29,883 units permitted in Harris County in 2024 (8,621 in 5+ unit buildings).
- This rent runs 44% of the median local income ($48k/yr) — at the standard rent-burdened threshold; future hikes will face affordability resistance.
Forward outlook
- In year one you build about $23k of equity ($2k loan paydown + $21k appreciation (8.7% local appreciation)).
- Harris County population projected at +47% by 2050 — long-run rental-demand tailwind backs the buy-and-hold thesis.
- By year 2, paydown + projected appreciation supports a ~$37k cash-out refi (75% LTV) — recoverable capital for the next deal without selling this one.
Negotiation context
- Only 6 days on market — expect competitive offers; lowballing is unlikely to land.
- 15 sale attempts with the ask held roughly flat each time — persistent listings suggest the price (not the market) is what's stuck; bring a comps-based counter.
Questions for the listing agent
- What do current leases actually rent for vs. the listed asking? Can we see a recent rent roll and the last 12 months of T-12 income?
- What does the HOA fee cover, when was the last increase, and are there any pending special assessments or reserve-fund shortfalls?
- Is there a deadline driving the sale (1031 exchange, divorce, estate, relocation)? That informs how much negotiation room exists.
- Schools are D-rated, which usually means shorter tenancies and higher turnover. Who's the typical renter profile here, and what's been the actual vacancy rate?
- Crime grade is F in this area — have there been break-ins, vandalism, or insurance claims at this property in the last 3 years? What carrier currently insures it and at what premium?
- The area grade is low — what's the realistic commute time and amenity access for the typical tenant pool here? Any planned neighborhood developments (good or bad) we should know about?
- What's the average days-on-market for RENTAL listings here right now (not sales)? A rising rental-DOM trend means longer vacancies and softer asking-rent achievability than the comps imply.
- What's the recent tenant-quality profile in this submarket — average credit score on applications, eviction rate, late-payment / NSF rate, and stable-employment percentage? A property-management company in the area should have these aggregated.
- How much new for-sale + rental construction is in the pipeline within 1–3 miles? Heavy new supply typically softens prices + rents 12–24 months out; constrained supply supports both.
Investment metrics
- 1% rule
- 0.70% ✗
- Cap rate
- 4.50%
- Cash-on-cash
- -6.42%
- DSCR
- 0.71
- GRM
- 11.8
CMA / ARV
- ARV (on-the-fly)
- $248,556
- Comps found
- 12
Show comp detail 12 sales within ~0.75 mi
| Address | Dist | Beds/Ba | Sqft | Sold | Price | $/sf | Match |
|---|---|---|---|---|---|---|---|
| 8203 Burnt Orchid Dr | 0.14mi | 3/2.0 | 1,076 (0%) | 1mo | $249,900 | $232 | 93 |
| 10410 Sunny Petal Circle Dr | 0.01mi | 3/2.0 | 1,076 (0%) | 14mo | $248,900 | $231 | 88 |
| 10404 Sunny Petal Circle Dr | 0.01mi | 3/2.0 | 1,076 (0%) | 14mo | $253,900 | $236 | 88 |
| 8112 Sunberry Shadow Dr | 0.06mi | 3/2.0 | 1,076 (0%) | 12mo | $251,900 | $234 | 87 |
| 8116 Sunberry Shadow Dr | 0.12mi | 3/2.0 | 1,076 (0%) | 14mo | $258,900 | $241 | 83 |
| 8033 Alpine Bearberry Dr | 0.29mi | 3/2.0 | 1,076 (0%) | 8mo | $250,900 | $233 | 80 |
| 8044 Parker Rd | 0.22mi | 3/2.0 | 1,140 (+6%) | 13mo | $175,000 | $154 | 69 |
| 7706 Lakewood Dr | 0.65mi | 4/1.5 (+1) | 1,084 (+1%) | 1mo | $209,000 | $193 | 61 |
| 10713 Red Orchid | 0.49mi | 3/2.0 | 1,012 (-6%) | 12mo | $221,070 | $218 | 57 |
| 10707 Red Orchid | 0.47mi | 3/2.0 | 1,012 (-6%) | 14mo | $199,000 | $197 | 57 |
| 7738 Parker Rd | 0.57mi | 3/1.5 | 1,174 (+9%) | 12mo | $160,000 | $136 | 46 |
| 8328 Caddo Rd | 0.58mi | 2/1.0 (-1) | 934 (-13%) | 12mo | $85,000 | $91 | 32 |
Match score weights: distance 35% · size 25% · config 20% · recency 20%. Top-matched comps best support the ARV.
Projected returns pro-forma
8.65% appreciation · 0.44% rent growth · sell at horizon
- IRR
- 16.0%
- Equity multiple
- 2.22×
- Total profit
- $84,758
- Equity at exit
- $199,907
- IRR
- 14.9%
- Equity multiple
- 4.68×
- Total profit
- $256,263
- Equity at exit
- $407,867
Cash invested: $69,596 (down + closing). Projections, not guarantees.
Landlord ↔ Tenant lean methodology
- Overall (STATE)
- 87 Strongly Landlord-Friendly
- State Texas
- 87 Strongly Landlord-Friendly · R+5
- County
- — inherits STATE
- City
- — inherits STATE
ZIP-level market 77016
- Home prices YoY
- 2.8%
- Rents YoY
- 0.4%
- Active inventory
- 372
- Price-to-rent
- 12.1×
Monthly cashflow live
- Estimated rent
- $1,749 high interval (Pro) →
- Mortgage (P&I)
- −$1,303
- Tax est. 1.5%
- −$311 /mo · $3,728/yr
- Insurance
- −$104
- HOA
- −$36
- Vacancy / Maint / Mgmt
- −$367
- Net cashflow
- $-372
Break-even live
UW: 25.0% down · 7.5% · 30yr · 1.5% tax · 5.0% vac · 8.0% maint · 8.0% mgmt
Financing live
Cash to close
- Down payment
- $62,139
- Closing costs
- $7,457
- Reserves months
- —
- Total cash needed
- —
Loan-product check · same deal, 3 products live
Conventional
25% down · 7.5% · 30yr
- Down + closing
- —
- Monthly P&I
- —
- Monthly cashflow
- —
- DSCR
- —
- Eligible?
- —
Personal DTI + credit; lowest rate.
DSCR
20% down · 8.5% · 30yr
- Down + closing
- —
- Monthly P&I
- —
- Monthly cashflow
- —
- DSCR
- —
- Eligible?
- —
No personal income docs; deal must DSCR.
Hard money
10% down · 12.0% · 12mo
- Down + closing
- —
- Monthly P&I
- —
- Monthly cashflow
- —
- DSCR
- —
- Eligible?
- —
Short-term bridge; refi at stabilization.
Rent comps 26 comps
| Address | Beds | Baths | Sqft | Rent | $/sqft | DOM | Units | Dist |
|---|---|---|---|---|---|---|---|---|
| 10708 Lavender Cotton Ln Houston, TX | 3.0 | 2.0 | 1406 | $2,150 | $1.53 | 43d | 1 | 0.31mi |
| 8003 Alpine Bearberry Dr Houston, TX | 3.0–4.0 | 2.0–2.5 | 1696 | $2,000 | $1.18 | 7d | 1 | 0.32mi |
| 10314 Woodwick St Unit 1283919P Houston, TX | 3.0 | 2.5 | 1496 | $3,782 | $2.53 | 7d | 1 | 0.52mi |
| 8213 Bigwood St Unit A Houston, TX | 3.0 | 2.5 | 1150 | $1,595 | $1.39 | 43d | 1 | 0.56mi |
| 7726 Spinet St Houston, TX | 4.0 | 2.0 | 1456 | $2,375 | $1.63 | 7d | 1 | 0.56mi |
| 8302 Caddo Rd Houston, TX | 2.0 | 1.0 | 896 | $1,450 | $1.62 | 43d | 1 | 0.57mi |
| 8122 Sterlingshire St Unit B Houston, TX | 3.0 | 2.0 | 1160 | $1,450 | $1.25 | 15d | 1 | 0.63mi |
| 8122 Sterlingshire St Unit A Houston, TX | 3.0 | 2.0 | 1160 | $1,525 | $1.31 | 15d | 1 | 0.63mi |
| 8126 Sterlingshire St Unit B Houston, TX | 3.0 | 2.0 | 1150 | $1,350 | $1.17 | 24d | 1 | 0.63mi |
| 10750 Nyla Spring St Houston, TX | 3.0 | 2.0 | 1500 | $1,975 | $1.32 | 18d | 1 | 0.87mi |
| 6822 Leedale St Houston, TX | 3.0 | 1.0 | 978 | $1,500 | $1.53 | 43d | 1 | 0.95mi |
| 9550 N Wayside Dr Houston, TX | 1.0–3.0 | 1.0–2.0 | 896 | $1,399 | $1.56 | 1d | 5 | 0.99mi |
| 6823 Hanley Ln Houston, TX | 3.0 | 2.0 | 1303 | $1,610 | $1.24 | 5d | 1 | 1.02mi |
| 8346 Tidwell Rd Unit B Houston, TX | 3.0 | 2.0 | 980 | $1,000 | $1.02 | 43d | 1 | 1.07mi |
| 8350 Tidwell Rd Unit A Houston, TX | 3.0 | 2.0 | 980 | $975 | $0.99 | 43d | 1 | 1.08mi |
| 8600 Sterlingshire St Houston, TX | 1.0–2.0 | 1.0 | 732 | $1,050 | $1.43 | 24d | 2 | 1.08mi |
| 7314 Saunders Rd Houston, TX | 4.0 | 2.0 | 1339 | $1,723 | $1.29 | 14d | 1 | 1.11mi |
| 7252 Parker Rd Houston, TX | 3.0 | 1.0 | 916 | $1,650 | $1.80 | 43d | 1 | 1.14mi |
| 9700 Mesa Dr Houston, TX | 1.0–3.0 | 1.0–2.0 | 784 | $989 | $1.26 | 1d | 8 | 1.23mi |
| 7176 Parker Rd Houston, TX | 4.0 | 2.0 | 1152 | $1,200 | $1.04 | 43d | 1 | 1.30mi |
| 8006 Lynette St Houston, TX | 3.0 | 1.0 | 1400 | $1,475 | $1.05 | 24d | 1 | 1.34mi |
| 9222 Hillis St Houston, TX | 3.0 | 2.0 | 1498 | $1,850 | $1.23 | 43d | 1 | 1.36mi |
| 7201 Hallshire Dr Houston, TX | 2.0 | 1.0 | 985 | $740 | $0.75 | 43d | 1 | 1.48mi |
| 7201 Hallshire Dr Unit 235 Houston, TX | 3.0 | 1.0 | 1100 | $850 | $0.77 | 43d | 1 | 1.48mi |
| 7201 Hallshire Dr Unit 222 Houston, TX | 2.0 | 1.0 | 985 | $700 | $0.71 | 43d | 1 | 1.48mi |
| 8711 Southwark St Unit A Houston, TX | 3.0 | 2.0 | 1150 | $1,750 | $1.52 | 43d | 1 | 1.50mi |
HOA detail
- Monthly dues
- $36 · $432/yr
- Likely covers
- pool
Listing history 45 events
-
2026-06-18days on market $252,900 Active 6 DOM
-
2026-06-17days on market $252,900 Active 5 DOM
-
2026-06-16days on market $252,900 Active 4 DOM
-
2026-06-15days on market $252,900 Active 3 DOM
-
2026-06-13days on market $252,900 Active 1 DOM
-
2026-06-10days on market $252,900 Active 19 DOM
-
2026-06-08days on market $252,900 Active 18 DOM
-
2026-06-07days on market $252,900 Active 17 DOM
-
2026-06-04days on market $252,900 Active 14 DOM
-
2026-06-01days on market $252,900 Active 11 DOM
-
2026-05-31days on market $252,900 Active 10 DOM
-
2026-05-15status Pending
-
2026-05-08$252,900 Active
-
2026-04-20historical
-
2026-04-16status Active
-
2026-04-14status Pending
-
2026-04-02price $252,900
-
2026-03-06$249,900 Active
-
2026-02-26historical $1,935
-
2026-02-25historical
-
2026-01-31$1,935
-
2026-01-30$257,900 Active
-
2026-01-08historical $1,935
-
2026-01-06historical
-
2025-12-17$1,935
-
2025-12-12historical $1,935
-
2025-12-12$1,935
-
2025-12-11historical $1,935
-
2025-12-04$257,900 Active
-
2025-11-25historical
-
2025-11-13$1,935
-
2025-10-31status Active
-
2025-10-20status Pending
-
2025-10-17$257,900 Active
-
2025-09-23historical
-
2025-08-22$264,900 Active
-
2025-08-18historical
-
2025-08-05price $264,900
-
2025-07-18$254,900 Active
-
2025-07-16historical
-
2025-07-02price $254,900
-
2025-06-26historical $1,995
-
2025-06-25price $1,995
-
2025-06-19$2,010
-
2025-06-18$256,900 Active
ⓘ Source: listings_history table (triggers on properties + properties_extension) + one-shot
backfill from property_details.listing_events for pre-trigger history.
Nearby sold comps map
Loading sold comps map…
Walkable amenities ~0.75 mi
Loading nearby amenities…
Taxation est. · year 1
- Rental income
- $20,987
- − Mortgage interest
- −$13,923
- − Property taxes
- −$3,728
- − Insurance
- −$1,243
- − Repairs & maintenance
- −$1,679
- − Management
- −$1,679
- − HOA
- −$432
- − Depreciation
- −$7,231
- Taxable loss
- −$8,928
- Est. tax savings @ 24.0%
- +$2,143
- After-tax cash flow
- $-2,322/yr
For passive investors: Depreciation is non-cash, so a rental often shows a tax loss while cash-flowing — sheltering income. Rental losses are passive: they offset passive income freely, and up to $25,000/yr can offset ordinary (W-2) income if you actively participate and your MAGI is under $100k (phasing out to $0 by $150k); unused losses carry forward. On sale, claimed depreciation is recaptured at up to 25%, and gains may owe capital-gains tax (a 1031 exchange can defer both). Figures are a year-1 estimate at your 24.0% rate — not tax advice; consult a CPA.
Schools (NCES district)
- District
- Houston ISD
- NCES district ID
- 4823640
- Math proficiency
- 27% ▼ -18.00%
- Reading proficiency
- 35% ▼ -6.00%
- Median HH income
- $46,054
- Composite
- 26.63/100
- National rank
- #7173
- State rank
- #593 of 826 in TX
Livability — Houston
- Score
- 74/100
- State rank
- #184
- US rank
- #4771
Category grades
Schools grade is shown separately in the Schools card above.
Census & demographics
- Census place
- Houston, TX
- County
- Harris County · 4,702,590 people
- City population
- 3,226,434
- Metro
- Houston-The Woodlands-Sugar Land, TX
- Population (ZIP)
- 29,841
- Household income
- $47,677
- Rent vs Own
- Severe rent burden
- 1297.0
Population outlook (Harris County) Hauer SSP2
- Today (2025)
- 5,571,493 people
- By 2030
- 6,089,821 · +9.3%
- By 2040
- 7,142,806 · +28.2%
- By 2050
- 8,185,864 · +46.9%
- By 2075
- 10,574,329 · +89.8%
- By 2100
- 12,109,958 · +117.4%
Race, ethnicity, and origin ACS 2023
- Neighborhood character
- Majority Black (56%)
- Race & ethnicity
- Black 56% Hispanic / Latino 42% Two or more races 28%
- Hispanic origin (detail)
- Mexican 34%
- Foreign-born
- 18% · Canada
- Languages at home
- 61% English-only · Spanish 37%
Political lean MEDSL · Harris
- 2024 margin
- Lean D (+5.5) · D 52.0% · R 46.4% · Other 1.6%
- 2008→2024 swing
- +3.9pp toward D · 2008: 1.6pp · 2024: 5.5pp
- All cycles
- 2024: D+5.5 2020: D+13.3 2016: D+12.4 2012: D+0.1 2008: D+1.6
Not yet ingested
- Civics
- —
Market trends
- HPI YoY
- ▲ 8.65%
- Current HPI
- 315.6765
- Rent YoY
- ▲ 0.44%
- Metro
- Houston-The Woodlands-Sugar Land, TX
- State GDP YoY
- ▲ 3.95%
- F500 in state
- 110
Industry mix (Fortune 500 HQ in TX)
| Industry | F500 HQs | Revenue |
|---|---|---|
| Energy | 16 | $1,198B |
|
||
| Technology | 5 | $198B |
|
||
| Engineering / Construction | 4 | $72B |
|
||
| Energy Services | 3 | $60B |
|
||
| Utilities | 3 | $41B |
|
||
| Healthcare | 2 | $330B |
|
||
Price history
-1.6% since first listed34 events — show timeline
- 2026-05-15 Pending — HARMLS
- 2026-05-08 Listed $252,900 HARMLS
- 2026-04-20 Listing Removed — HARMLS
- 2026-04-16 Relisted — HARMLS
- 2026-04-14 Pending — HARMLS
- 2026-04-02 Price Changed $252,900 HARMLS
- 2026-03-06 Listed $249,900 HARMLS
- 2026-02-26 Rental Removed $1,935 HARMLS
- 2026-02-25 Listing Removed — HARMLS
- 2026-01-31 Listed for Rent $1,935 HARMLS
- 2026-01-30 Listed $257,900 HARMLS
- 2026-01-08 Rental Removed $1,935 HARMLS
- 2026-01-06 Listing Removed — HARMLS
- 2025-12-17 Listed for Rent $1,935 HARMLS
- 2025-12-12 Rental Removed $1,935 HARMLS
- 2025-12-12 Listed for Rent $1,935 HARMLS
- 2025-12-11 Rental Removed $1,935 HARMLS
- 2025-12-04 Listed $257,900 HARMLS
- 2025-11-25 Listing Removed — HARMLS
- 2025-11-13 Listed for Rent $1,935 HARMLS
- 2025-10-31 Relisted — HARMLS
- 2025-10-20 Pending — HARMLS
- 2025-10-17 Listed $257,900 HARMLS
- 2025-09-23 Listing Removed — HARMLS
- 2025-08-22 Listed $264,900 HARMLS
- 2025-08-18 Listing Removed — HARMLS
- 2025-08-05 Price Changed $264,900 HARMLS
- 2025-07-18 Listed $254,900 HARMLS
- 2025-07-16 Listing Removed — HARMLS
- 2025-07-02 Price Changed $254,900 HARMLS
- 2025-06-26 Rental Removed $1,995 HARMLS
- 2025-06-25 Price Changed $1,995 HARMLS
- 2025-06-19 Listed for Rent $2,010 HARMLS
- 2025-06-18 Listed $256,900 HARMLS
Cash-flow waterfall
monthlySold comps — $/sqft
last 12 mo · ≤1 miLoading sold comps…