3461 Dillward Dr · Columbus, OH
Flood risk 1/10 · Minimal
- FEMA flood zone
- X (unshaded)
- Chance of flooding over 30 yrs
- 0.0%
- Est. flood insurance / yr
- $473 – $860
Fire risk 1/10 · Minimal
- Est. fire insurance / yr
- $713 – $1,323
Heat risk 4/10 · Minor
- Hot days now (above 100°F)
- 7 days/yr
- Hot days in 30 yrs
- 18 days/yr
Wind risk 2/10 · Minimal
- Chance of severe wind over 30 yrs
- 1.0%
Air-quality risk 2/10 · Minimal
- Unhealthy air days now
- 1 days/yr
- Unhealthy air days in 30 yrs
- 3 days/yr
Risk factors via First Street. Map © Google.
Why this score? — see what drove the D grade
The composite is a weighted blend of 9 inputs, each scored 0–100. Each bar is that input's sub-score; the figure is the points it added to the 100-point composite (weight × sub-score).
- Cash flow +15.0/30.0
- ARV discount +7.5/15.0
- 1% rule +5.0/10.0
- DSCR +5.0/10.0
- Livability +4.0/5.0
- Rent growth +2.3/5.0
- Condition / age +2.2/5.0
- Schools +1.7/10.0
- Appreciation +0.0/10.0
$1
🖨 Deal sheet 📄 Offer letter ✓ Due diligence
Listing remarks MLS
Home in need of major rehab. Extensive water damage due to roof leak. Priced to sell - Good investment property!!! All buyers must be Pre-Approved! * * * BEST AND FINAL OFFERS UNTIL TUES 12/19 AT NOON! * * *
Key facts
- 8,276 sq ft lot
- 2 garage spots
- Built 1969
Property features AI
Finance
- Other: Standard listing conditions
- Financial info: Taxes reported for 2024
Exterior
- Parking: Attached garage with 2 spaces
- Utilities: Public water; Public sewer
- Home design: Single-family residence; Tri-level; Built in 1969
- Construction: Block foundation; Built in 1969
- Exterior features: Block foundation; Lot is about 0.19 acres; Subdivision: Somerset 1
Interior
- Bathrooms: 1 full bathroom
- Interior features: Approximately 1371 living area (source: Realist); No common walls
Neighborhood map
What this means for you Summary
Snapshot
- This is a 3-bed/1.5-bath single-family listed at $1. Condition is rated fair.
Deal economics
- At list price, monthly cash flow is $1k ($16k/yr) — positive.
- The deal already cash-flows at list — no discount required.
- Meets the 1% rule at list price ($2k rent vs $1).
- Cap rate 1622414.7% vs local median 3.8% in Columbus — top-decile yield for the area; either an underpriced asset or a hidden risk that comps aren't pricing in. Stress-test before assuming the spread holds.
Location & tenants
- Location reads 81/100 on livability (#97 in OH, #1,491 nationally) — a professional / high-income tenant draw. Strengths: commute A+, cost of living A+, housing A+; Watch: employment C-, crime F.
- Columbus City School District (urban): math 15% / reading 26% proficiency, ranked #626 of 656 in OH (top 95%) — low school quality limits family demand, transient renter base, plan for 1-2y turnover; 72% free/reduced lunch — lower-income household profile, screen leases tightly.
- Market conditions: Rents soft (-0.8%/yr); 103 active listings in the ZIP; 15 comparable units currently listed for rent nearby; rentals leasing fast (median 2d on market — plan ~1-2 weeks tenant-placement turnaround); 8,139 units permitted in Franklin County in 2024 (5,940 in 5+ unit buildings).
- This rent runs 39% of the median local income ($52k/yr) — at the standard rent-burdened threshold; future hikes will face affordability resistance.
Forward outlook
- Local home prices are declining (-3.0%/yr); year-one equity from $0 of loan paydown is wiped out by about $0 of value loss. Plan a longer hold.
- Franklin County population projected at +34% by 2050 — long-run rental-demand tailwind backs the buy-and-hold thesis.
- At projected returns (-3.0% appreciation + 0.0% rent growth), your $0 cash investment doubles in ~1 year — after that, you're playing with house money.
Negotiation context
- Only 8 days on market — expect competitive offers; lowballing is unlikely to land.
- 3 sale attempts since 20y ago with the ask held roughly flat each time — persistent listings suggest the price (not the market) is what's stuck; bring a comps-based counter.
Questions for the listing agent
- Have any recent inspections been done? Can we get a copy of the seller's disclosures and any deferred-maintenance estimates?
- Built in 1969 — when were the roof, HVAC, electrical panel, plumbing, and water heater last replaced?
- Is there a deadline driving the sale (1031 exchange, divorce, estate, relocation)? That informs how much negotiation room exists.
- Crime grade is F in this area — have there been break-ins, vandalism, or insurance claims at this property in the last 3 years? What carrier currently insures it and at what premium?
- The area grade is low — what's the realistic commute time and amenity access for the typical tenant pool here? Any planned neighborhood developments (good or bad) we should know about?
- What's the average days-on-market for RENTAL listings here right now (not sales)? A rising rental-DOM trend means longer vacancies and softer asking-rent achievability than the comps imply.
- What's the recent tenant-quality profile in this submarket — average credit score on applications, eviction rate, late-payment / NSF rate, and stable-employment percentage? A property-management company in the area should have these aggregated.
- How much new for-sale + rental construction is in the pipeline within 1–3 miles? Heavy new supply typically softens prices + rents 12–24 months out; constrained supply supports both.
Investment metrics
- 1% rule
- 171141.00% ✓
- Cap rate
- 1622414.68%
- Cash-on-cash
- 5794315.67%
- DSCR
- 257815.44
- GRM
- 0.0
CMA / ARV
- ARV (median comp)
- $266,911
- List price
- $1
- Delta
- -100.00%
- Verdict
- UNDERPRICED
- Comps
- 20 within 1.0 mi
Show comp detail 12 sales within ~0.75 mi
| Address | Dist | Beds/Ba | Sqft | Sold | Price | $/sf | Match |
|---|---|---|---|---|---|---|---|
| 3356 E Bodman Dr | 0.16mi | 3/1.5 | 1,296 (-6%) | 1mo | $281,000 | $217 | 83 |
| 3389 Dillward Dr | 0.12mi | 3/1.0 | 1,470 (+7%) | 2mo | $150,000 | $102 | 78 |
| 2743 Jenifer Pl | 0.18mi | 3/1.0 | 1,280 (-7%) | 5mo | $200,000 | $156 | 74 |
| 2731 Gatewood Rd | 0.25mi | 4/1.5 (+1) | 1,437 (+5%) | 3mo | $260,000 | $181 | 73 |
| 3616 Glenbar Dr | 0.23mi | 4/2.0 (+1) | 1,295 (-6%) | 3mo | $234,900 | $181 | 70 |
| 3427 Crossing Hill Way | 0.22mi | 3/2.0 | 1,208 (-12%) | 6mo | $312,000 | $258 | 63 |
| 3241 Kenray Dr | 0.39mi | 3/1.5 | 1,260 (-8%) | 7mo | $220,000 | $175 | 63 |
| 3063 Chelford Dr | 0.58mi | 3/1.0 | 1,284 (-6%) | 1mo | $222,500 | $173 | 60 |
| 3118 Elmreeb Dr | 0.49mi | 3/1.0 | 1,232 (-10%) | 2mo | $264,900 | $215 | 57 |
| 3106 Caralee Dr | 0.58mi | 3/2.0 | 1,442 (+5%) | 8mo | $280,000 | $194 | 56 |
| 3120 Chelford Dr | 0.50mi | 3/1.5 | 1,181 (-14%) | 6mo | $267,000 | $226 | 49 |
| 2694 Kantian Dr | 0.57mi | 3/2.5 | 1,523 (+11%) | 5mo | $305,100 | $200 | 47 |
Match score weights: distance 35% · size 25% · config 20% · recency 20%. Top-matched comps best support the ARV.
Projected returns pro-forma
-3.0% appreciation · 0.0% rent growth · sell at horizon
- IRR
- —
- Equity multiple
- 289716.11×
- Total profit
- $81,120
- Equity at exit
- $0
- IRR
- —
- Equity multiple
- 579431.63×
- Total profit
- $162,241
- Equity at exit
- $0
Cash invested: $0 (down + closing). Projections, not guarantees.
Landlord ↔ Tenant lean methodology
- Overall (STATE)
- 73 Landlord-Friendly
- State Ohio
- 73 Landlord-Friendly · R+6
- County
- — inherits STATE
- City
- — inherits STATE
ZIP-level market 43219
- Rents YoY
- -0.8%
- Active inventory
- 103
Monthly cashflow live
- Estimated rent
- $1,711 high interval (Pro) →
- Mortgage (P&I)
- −$0
- Tax est. 1.5%
- −$0 /mo · $0/yr
- Insurance
- −$0
- HOA
- −$0
- Vacancy / Maint / Mgmt
- −$359
- Net cashflow
- $1,352
Break-even live
UW: 25.0% down · 7.5% · 30yr · 1.5% tax · 5.0% vac · 8.0% maint · 8.0% mgmt
Financing live
Cash to close
- Down payment
- $0
- Closing costs
- $0
- Reserves months
- —
- Total cash needed
- —
Loan-product check · same deal, 3 products live
Conventional
25% down · 7.5% · 30yr
- Down + closing
- —
- Monthly P&I
- —
- Monthly cashflow
- —
- DSCR
- —
- Eligible?
- —
Personal DTI + credit; lowest rate.
DSCR
20% down · 8.5% · 30yr
- Down + closing
- —
- Monthly P&I
- —
- Monthly cashflow
- —
- DSCR
- —
- Eligible?
- —
No personal income docs; deal must DSCR.
Hard money
10% down · 12.0% · 12mo
- Down + closing
- —
- Monthly P&I
- —
- Monthly cashflow
- —
- DSCR
- —
- Eligible?
- —
Short-term bridge; refi at stabilization.
Rent comps 15 comps
| Address | Beds | Baths | Sqft | Rent | $/sqft | DOM | Units | Dist |
|---|---|---|---|---|---|---|---|---|
| 3520 Red Hook Xing Columbus, OH | 1.0–2.0 | 1.0–2.0 | 805 | $1,345 | $1.67 | 2d | 10 | 0.32mi |
| 2591 Venturi House Columbus, OH | 1.0–3.0 | 1.0–2.5 | 1009 | $1,930 | $1.91 | 2d | 15 | 0.34mi |
| 3701 Governors Club Blvd Columbus, OH | 1.0–2.0 | 1.0–2.0 | 855 | $1,576 | $1.84 | 1d | 70 | 0.37mi |
| 3700 Lifestyle Blvd Columbus, OH | 2.0 | 2.0 | 1050 | $1,338 | $1.27 | 2d | 5 | 0.48mi |
| 3780 Codet Rd Columbus, OH | 1.0–3.0 | 1.0–2.0 | 953 | $2,290 | $2.40 | 2d | 25 | 0.57mi |
| 3785 Codet Rd Westerville, OH | 1.0–3.0 | 1.0–2.0 | 953 | $2,080 | $2.18 | 2d | 34 | 0.62mi |
| 4120 McNery Dr Unit 1496122P Columbus, OH | 4.0 | 3.0 | 1603 | $6,990 | $4.36 | 3d | 1 | 0.75mi |
| 2235 McCutcheon Rd Columbus, OH | 1.0–2.0 | 1.0–2.0 | 819 | $1,525 | $1.86 | 7d | 1 | 0.78mi |
| 1905 Stelzer Rd Columbus, OH | 1.0–2.0 | 1.0–2.0 | 828 | $1,635 | $1.97 | 2d | 22 | 1.22mi |
| 363 Regents Rd Columbus, OH | 4.0 | 1.5 | 1447 | $1,995 | $1.38 | 20d | 1 | 1.26mi |
| 4011 Easton Way Columbus, OH | 1.0–2.0 | 1.0–2.5 | 1016 | $2,230 | $2.19 | 2d | 39 | 1.27mi |
| 3030 Sunbury Ridge Dr Columbus, OH | 1.0–2.0 | 1.0–1.5 | 1000 | $1,719 | $1.72 | 1d | 20 | 1.30mi |
| 2183 Painted Cliff Dr Columbus, OH | 3.0 | 2.5 | 1356 | $2,235 | $1.65 | 2d | 1 | 1.31mi |
| 2695 Divot Pl Unit 2676 Columbus, OH | 3.0 | 2.0 | 1050 | $1,149 | $1.09 | 43d | 1 | 1.33mi |
| 2901 Bridgewalk St Unit 2901 Columbus, OH | 3.0 | 1.5 | 950 | $1,295 | $1.36 | 23d | 1 | 1.41mi |
Listing history 8 events
-
2026-05-06status Pending 96-char remark
-
2026-04-28$1 Active 96-char remark
-
2026-01-22status Pending
-
2026-01-22historical
-
2025-12-30$1 Active
-
2007-01-05soldstatus $36,000
Show marketing remark (212 chars)
Home in need of major rehab. Extensive water damage due to roof leak. Priced to sell - Good investment property!!! All buyers must be Pre-Approved! * * * BEST AND FINAL OFFERS UNTIL TUES 12/19 AT NOON! * * *
-
2006-12-19historical
Show marketing remark (212 chars)
Home in need of major rehab. Extensive water damage due to roof leak. Priced to sell - Good investment property!!! All buyers must be Pre-Approved! * * * BEST AND FINAL OFFERS UNTIL TUES 12/19 AT NOON! * * *
-
2006-12-13$38,900
Show marketing remark (212 chars)
Home in need of major rehab. Extensive water damage due to roof leak. Priced to sell - Good investment property!!! All buyers must be Pre-Approved! * * * BEST AND FINAL OFFERS UNTIL TUES 12/19 AT NOON! * * *
ⓘ Source: listings_history table (triggers on properties + properties_extension) + one-shot
backfill from property_details.listing_events for pre-trigger history.
Climate risk First Street
- Flood 1/10 Low FEMA zone X (unshaded) · 0% chance over 30 yrs
- Wildfire 1/10 Low
- Heat 4/10 Moderate 7 d/yr ≥100°F today · 18 d/yr by 30 yrs out
- Wind 2/10 Low 100% chance of damaging wind over 30 yrs
- Air quality 2/10 Low 1 unhealthy d/yr today · 3 by 30 yrs out
Nearby sold comps map
Loading sold comps map…
Walkable amenities ~0.75 mi
Loading nearby amenities…
Taxation est. · year 1
- Rental income
- $20,537
- − Mortgage interest
- −$0
- − Property taxes
- −$0
- − Insurance
- −$0
- − Repairs & maintenance
- −$1,643
- − Management
- −$1,643
- − Depreciation
- −$0
- Taxable income
- $17,251
- Est. tax owed @ 24.0%
- −$4,140
- After-tax cash flow
- $12,084/yr
For passive investors: Depreciation is non-cash, so a rental often shows a tax loss while cash-flowing — sheltering income. Rental losses are passive: they offset passive income freely, and up to $25,000/yr can offset ordinary (W-2) income if you actively participate and your MAGI is under $100k (phasing out to $0 by $150k); unused losses carry forward. On sale, claimed depreciation is recaptured at up to 25%, and gains may owe capital-gains tax (a 1031 exchange can defer both). Figures are a year-1 estimate at your 24.0% rate — not tax advice; consult a CPA.
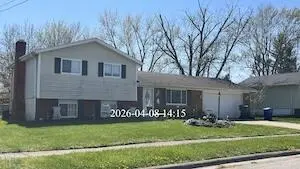
Condition & rehab AI · 1 photo
This split-level home requires moderate repairs to exterior siding and roof, along with routine maintenance to landscaping. Updates to paint and replace siding and roof would significantly increase its resale and rental value.
Repairs flagged
- Moderate Exterior siding — Weathered appearance
- Moderate Roof — Aged appearance
Value-add opportunities
- Both Paint exterior and interior walls — Fresh paint enhances curb appeal and interior aesthetics
- Both Replace exterior siding — New siding improves curb appeal and structural integrity
- Both Replace roof — New roof extends the home's lifespan and improves energy efficiency
Renovation cost estimate screening
| Repair item | Severity | Est. cost |
|---|---|---|
| Exterior siding · Weathered appearance | Moderate | $3,000–15,000 |
| Roof · Aged appearance | Moderate | $3,000–15,000 |
| Total estimated repair cost · 2 items | $6,000–30,000 |
Value-add ROI direction
- Both Paint exterior and interior walls — Fresh paint enhances curb appeal and interior aesthetics ↑
- Both Replace exterior siding — New siding improves curb appeal and structural integrity ↑
- Both Replace roof — New roof extends the home's lifespan and improves energy efficiency ↑
ⓘ Cost ranges are severity-bucket heuristics (US national rule-of-thumb). Get contractor quotes + a written scope before underwriting a rehab budget.
Schools (NCES district)
- District
- Columbus City School District
- NCES district ID
- 3904380
- Math proficiency
- 15% ▼ -17.00%
- Reading proficiency
- 26% ▼ -12.00%
- Median HH income
- $38,483
- Composite
- 17.19/100
- National rank
- #9105
- State rank
- #626 of 656 in OH
Livability — Columbus
- Score
- 81/100
- State rank
- #97
- US rank
- #1491
Category grades
Schools grade is shown separately in the Schools card above.
Census & demographics
- Census place
- Columbus, OH
- County
- Franklin County · 1,351,780 people
- City population
- 612,189
- Metro
- Columbus, OH
- Population (ZIP)
- 32,338
- Household income
- $52,094
- Rent vs Own
- Severe rent burden
- 2016.0
Population outlook (Franklin County) Hauer SSP2
- Today (2025)
- 1,456,139 people
- By 2030
- 1,556,890 · +6.9%
- By 2040
- 1,757,349 · +20.7%
- By 2050
- 1,950,539 · +34.0%
- By 2075
- 2,376,171 · +63.2%
- By 2100
- 2,636,796 · +81.1%
Race, ethnicity, and origin ACS 2023
- Neighborhood character
- Majority Black (65%)
- Race & ethnicity
- Black 65% White 17% Hispanic / Latino 10% Two or more races 7% Asian 4%
- Hispanic origin (detail)
- Mexican 6%
- Common ancestry
- Swedish 1% Lithuanian 1% Swiss 1%
- Foreign-born
- 20% · Canada, India, China
- Languages at home
- 76% English-only · Spanish 7% Other Indo-European 3% Chinese 1%
Political lean MEDSL · Franklin
- 2024 margin
- Strong D (+28.4) · D 63.7% · R 35.3% · Other 1.0%
- 2008→2024 swing
- +7.7pp toward D · 2008: 20.7pp · 2024: 28.4pp
- All cycles
- 2024: D+28.4 2020: D+31.4 2016: D+25.9 2012: D+21.7 2008: D+20.7
Not yet ingested
- Civics
- —
Market trends
- HPI YoY
- ▼ -137.02%
- Current HPI
- 172.3872
- Rent YoY
- ▼ -0.84%
- Metro
- Columbus, OH
- State GDP YoY
- ▲ 1.98%
- F500 in state
- 48
Industry mix (Fortune 500 HQ in OH)
| Industry | F500 HQs | Revenue |
|---|---|---|
| Insurance | 3 | $145B |
|
||
| Industrial Machinery | 3 | $49B |
|
||
| Financial Services | 3 | $24B |
|
||
| Consumer Goods | 2 | $93B |
|
||
| Aerospace / Defense | 2 | $47B |
|
||
| Utilities | 2 | $33B |
|
||
Price history
-7.5% since first listed8 events — show timeline
- 2026-05-06 Pending — CBRMLS
- 2026-04-28 Listed $1 CBRMLS
- 2026-01-22 Pending — CBRMLS
- 2026-01-22 Listing Removed — CBRMLS
- 2025-12-30 Listed $1 CBRMLS
- 2007-01-05 Sold (MLS) $36,000 CBRMLS
- 2006-12-19 Listing Removed — CBRMLS
- 2006-12-13 Listed $38,900 CBRMLS
Property tax history
+6.0%/yrLatest (2024): $2,952 · +0.9% YoY. Source: county tax records.
Cash-flow waterfall
monthlySold comps — $/sqft
last 12 mo · ≤1 miLoading sold comps…