0 Grove St · Royston, GA
Flood risk 1/10 · Minimal
- FEMA flood zone
- X (unshaded)
- Chance of flooding over 30 yrs
- 0.0%
- Est. flood insurance / yr
- $507 – $1,088
Fire risk 4/10 · Minor
- Est. fire insurance / yr
- $963 – $1,789
Heat risk 5/10 · Moderate
- Hot days now (above 105°F)
- 7 days/yr
- Hot days in 30 yrs
- 16 days/yr
Wind risk 4/10 · Minor
- Chance of severe wind over 30 yrs
- 11.0%
Air-quality risk 3/10 · Minor
- Unhealthy air days now
- 2 days/yr
- Unhealthy air days in 30 yrs
- 4 days/yr
Risk factors via First Street. Map © Google.
Why this score? — see what drove the B+ grade
The composite is a weighted blend of 9 inputs, each scored 0–100. Each bar is that input's sub-score; the figure is the points it added to the 100-point composite (weight × sub-score).
- Cash flow +30.0/30.0
- 1% rule +10.0/10.0
- DSCR +10.0/10.0
- Appreciation +10.0/10.0
- ARV discount +7.5/15.0
- Schools +3.0/10.0
- Livability +2.9/5.0
- Rent growth +2.5/5.0
- Condition / age +2.5/5.0
$59,500
🖨 Deal sheet 📄 Offer letter ✓ Due diligence
Listing remarks MLS
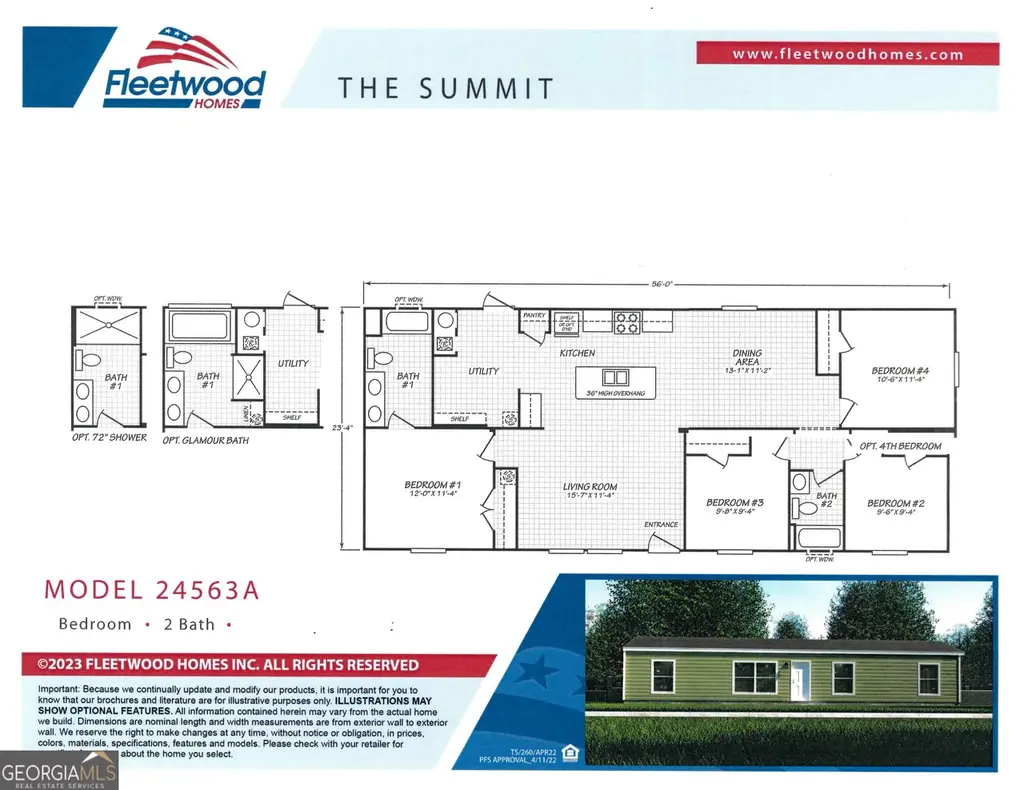
Brand-new 4 bedroom, 2 bathroom mobile home planned to be placed on this 0.82-acre lot in Royston, GA this fall. Home will offer approximately 1,344 sq ft with an open layout and peaceful setting. Current photos include the model home to showcase the planned home and potential of the property. Conveniently located just minutes from downtown Royston, shopping, and schools while still offering a quiet country feel. Great opportunity to own a new home on a spacious lot before improvements are completed.
Key facts
- 0.82-acre lot
- 0.82 acre lot
- Listed 28 days
Tags
Neighborhood map
What this means for you Summary
Snapshot
- This is a other listed at $60k.
Deal economics
- At list price, monthly cash flow is $674 ($8k/yr) — positive.
- The deal already cash-flows at list — no discount required.
- Meets the 1% rule at list price ($1k rent vs $60k).
- Recommended offer: $59k (1.5% below list) — sets the bar for market timing.
- Cap rate 19.9% vs local median 4.0% in Royston — top-decile yield for the area; either an underpriced asset or a hidden risk that comps aren't pricing in. Stress-test before assuming the spread holds.
Location & tenants
- Location reads 58/100 on livability (#421 in GA) — a working-class tenant base; expect higher turnover. Strengths: cost of living A+, housing A, crime B+; Watch: schools F, amenities F, commute F.
- Franklin County (rural): math 38% / reading 35% proficiency, ranked #61 of 174 in GA (top 35%) — families likely to look elsewhere, expect single-tenant / working-renter base with shorter leases.
- Market conditions: 95 active listings in the ZIP; 9 comparable units currently listed for rent nearby; rentals leasing fast (median 14d on market — plan ~1-2 weeks tenant-placement turnaround); 163 units permitted in Franklin County in 2024 (0 in 5+ unit buildings).
Forward outlook
- In year one you build about $6k of equity ($411 loan paydown + $6k appreciation (10.0% local appreciation)).
- At projected returns (10.0% appreciation + 3.0% rent growth), your $17k cash investment doubles in ~2 years — after that, you're playing with house money.
- By year 6, paydown + projected appreciation supports a ~$37k cash-out refi (75% LTV) — recoverable capital for the next deal without selling this one.
Negotiation context
- It's been on market 29 days — a 2% lower offer ($59k) is reasonable based on typical stale-listing flexibility.
- 4 sale attempts; this cycle's ask has dropped $160k (73%) from the opening price — seller is motivated, your offer sets the floor, not the list.
Risks & watch-outs
- Climate carrying-cost: extreme-heat days projected 7→16/yr by 2055 (HVAC capex compounding) — expect insurance premiums to compound above CPI over the hold.
Questions for the listing agent
- Is there a deadline driving the sale (1031 exchange, divorce, estate, relocation)? That informs how much negotiation room exists.
- Schools are F-rated, which usually means shorter tenancies and higher turnover. Who's the typical renter profile here, and what's been the actual vacancy rate?
- What's the average days-on-market for RENTAL listings here right now (not sales)? A rising rental-DOM trend means longer vacancies and softer asking-rent achievability than the comps imply.
- What's the recent tenant-quality profile in this submarket — average credit score on applications, eviction rate, late-payment / NSF rate, and stable-employment percentage? A property-management company in the area should have these aggregated.
- How much new for-sale + rental construction is in the pipeline within 1–3 miles? Heavy new supply typically softens prices + rents 12–24 months out; constrained supply supports both.
Investment metrics
- 1% rule
- 2.18% ✓
- Cap rate
- 19.88%
- Cash-on-cash
- 48.53%
- DSCR
- 3.16
- GRM
- 3.8
CMA / ARV
- ARV (median comp)
- $187,077
- List price
- $59,500
- Delta
- 17.06%
- Verdict
- OVERPRICED
- Comps
- 20 within 1.0 mi
Projected returns pro-forma
10.0% appreciation · 3.0% rent growth · sell at horizon
- IRR
- 62.3%
- Equity multiple
- 5.52×
- Total profit
- $75,301
- Equity at exit
- $53,602
- IRR
- 55.9%
- Equity multiple
- 12.28×
- Total profit
- $187,967
- Equity at exit
- $115,595
Cash invested: $16,660 (down + closing). Projections, not guarantees.
Landlord ↔ Tenant lean methodology
- Overall (STATE)
- 90 Strongly Landlord-Friendly
- State Georgia
- 90 Strongly Landlord-Friendly · R+3
- County
- — inherits STATE
- City
- — inherits STATE
ZIP-level market 30662
- Home prices YoY
- 17.9%
- Active inventory
- 95
- Price-to-rent
- 3.8×
Monthly cashflow live
- Estimated rent
- $1,296 high interval (Pro) →
- Mortgage (P&I)
- −$312
- Tax from tax record
- −$13 /mo · $161/yr
- Insurance
- −$25
- HOA
- −$0
- Vacancy / Maint / Mgmt
- −$272
- Net cashflow
- $674
Break-even live
UW: 25.0% down · 7.5% · 30yr · 1.5% tax · 5.0% vac · 8.0% maint · 8.0% mgmt
Financing live
Cash to close
- Down payment
- $14,875
- Closing costs
- $1,785
- Reserves months
- —
- Total cash needed
- —
Loan-product check · same deal, 3 products live
Conventional
25% down · 7.5% · 30yr
- Down + closing
- —
- Monthly P&I
- —
- Monthly cashflow
- —
- DSCR
- —
- Eligible?
- —
Personal DTI + credit; lowest rate.
DSCR
20% down · 8.5% · 30yr
- Down + closing
- —
- Monthly P&I
- —
- Monthly cashflow
- —
- DSCR
- —
- Eligible?
- —
No personal income docs; deal must DSCR.
Hard money
10% down · 12.0% · 12mo
- Down + closing
- —
- Monthly P&I
- —
- Monthly cashflow
- —
- DSCR
- —
- Eligible?
- —
Short-term bridge; refi at stabilization.
Rent comps 9 comps
| Address | Beds | Baths | Sqft | Rent | $/sqft | DOM | Units | Dist |
|---|---|---|---|---|---|---|---|---|
| 189 Mason St Unit 3 Royston, GA | 2.0 | 2.0 | 726 | $1,175 | $1.62 | 43d | 1 | 0.32mi |
| 189 Mason St Unit 12 Royston, GA | 3.0 | 2.0 | — | $1,375 | — | 13d | 1 | 0.32mi |
| 20 Breanna Way Royston, GA | 3.0 | 2.5 | 1380 | $2,500 | $1.81 | 13d | 1 | 0.40mi |
| 359 Railroad St Apt A Royston, GA | 1.0 | 1.0 | — | $750 | — | 13d | 1 | 0.43mi |
| 137 Carlton St Unit 145 Royston, GA | 2.0 | 1.5 | 1000 | $1,200 | $1.20 | 13d | 1 | 0.52mi |
| 237 Turner St Unit E Royston, GA | 1.0 | 1.0 | 400 | $800 | $2.00 | 21d | 1 | 0.53mi |
| 339 Dovetown Rd Royston, GA | 1.0 | 1.0 | — | $766 | — | 13d | 1 | 0.56mi |
| 22 Freedom Point Rd Royston, GA | 3.0 | 2.0 | 1800 | $1,500 | $0.83 | 13d | 1 | 0.64mi |
| 57 Shady Cir Royston, GA | 2.0 | 2.0 | 820 | $1,195 | $1.46 | 13d | 1 | 0.96mi |
Listing history 23 events
-
2026-06-19days on market $59,500 Active 29 DOM
-
2026-06-18days on market $59,500 Active 28 DOM
-
2026-06-17pricedays on market $59,500 Active 27 DOM
-
2026-06-16days on market $219,000 Active 34 DOM
-
2026-06-15days on market $219,000 Active 33 DOM
-
2026-06-14days on market $219,000 Active 31 DOM
-
2026-06-12days on market $219,000 Active 30 DOM
-
2026-06-09days on market $219,000 Active 27 DOM
-
2026-06-08days on market $219,000 Active 26 DOM
-
2026-06-07days on market $219,000 Active 25 DOM
-
2026-06-07days on market $219,000 Active 24 DOM
-
2026-06-03days on market $219,000 Active 21 DOM
-
2026-06-02days on market $219,000 Active 20 DOM
-
2026-06-01days on market $219,000 Active 19 DOM
-
2026-05-31days on market $219,000 Active 18 DOM
-
2026-05-31days on market $219,000 Active 17 DOM
-
2026-05-15historical
-
2026-05-13$219,000 New 505-char remark
Show marketing remark (505 chars)
Brand-new 4 bedroom, 2 bathroom mobile home planned to be placed on this 0.82-acre lot in Royston, GA this fall. Home will offer approximately 1,344 sq ft with an open layout and peaceful setting. Current photos include the model home to showcase the planned home and potential of the property. Conveniently located just minutes from downtown Royston, shopping, and schools while still offering a quiet country feel. Great opportunity to own a new home on a spacious lot before improvements are completed.
-
2026-04-20status Back On Market
-
2026-03-13historical Active Under Contract
-
2026-03-13status Back On Market
-
2026-03-10historical
-
2026-02-10$70,000 New
ⓘ Source: listings_history table (triggers on properties + properties_extension) + one-shot
backfill from property_details.listing_events for pre-trigger history.
Tax reassessment forecast GA · Resets to sale price
- Current annual tax
- $161 · $13/mo
- Projected year-2 tax
- $547 · $46/mo
- Expected delta
- +$386/yr (+$32/mo · 240.0%)
ⓘ Screening estimate from a state-policy table — verify with the county assessor before closing.
Climate risk First Street
- Flood 1/10 Low FEMA zone X (unshaded) · 0% chance over 30 yrs
- Wildfire 4/10 Moderate
- Heat 5/10 Major 7 d/yr ≥105°F today · 16 d/yr by 30 yrs out
- Wind 4/10 Moderate 11% chance of damaging wind over 30 yrs
- Air quality 3/10 Moderate 2 unhealthy d/yr today · 4 by 30 yrs out
Nearby sold comps map
Loading sold comps map…
Walkable amenities ~0.75 mi
Loading nearby amenities…
Taxation est. · year 1
- Rental income
- $15,555
- − Mortgage interest
- −$3,333
- − Property taxes
- −$161
- − Insurance
- −$298
- − Repairs & maintenance
- −$1,244
- − Management
- −$1,244
- − Depreciation
- −$1,731
- Taxable income
- $7,544
- Est. tax owed @ 24.0%
- −$1,810
- After-tax cash flow
- $6,275/yr
For passive investors: Depreciation is non-cash, so a rental often shows a tax loss while cash-flowing — sheltering income. Rental losses are passive: they offset passive income freely, and up to $25,000/yr can offset ordinary (W-2) income if you actively participate and your MAGI is under $100k (phasing out to $0 by $150k); unused losses carry forward. On sale, claimed depreciation is recaptured at up to 25%, and gains may owe capital-gains tax (a 1031 exchange can defer both). Figures are a year-1 estimate at your 24.0% rate — not tax advice; consult a CPA.
Schools (NCES district)
- District
- Franklin County
- NCES district ID
- 1302250
- Math proficiency
- 38% ▼ -1.00%
- Reading proficiency
- 35% ▼ -3.00%
- Median HH income
- $35,985
- Composite
- 30.28/100
- National rank
- #6281
- State rank
- #61 of 174 in GA
Livability — Royston
- Score
- 58/100
- State rank
- #421
- US rank
- #20753
Category grades
Schools grade is shown separately in the Schools card above.
Census & demographics
- Census place
- Royston, GA
- County
- Franklin County · 7,950 people
- City population
- 7,950
- Metro
- Athens-Clarke County, GA
- Population (ZIP)
- 7,950
- Household income
- $53,487
- Rent vs Own
- Severe rent burden
- 72.0
Population outlook (Franklin County) Hauer SSP2
- Today (2025)
- 22,625 people
- By 2030
- 22,725 · +0.4%
- By 2040
- 22,806 · +0.8%
- By 2050
- 22,713 · +0.4%
- By 2075
- 22,514 · -0.5%
- By 2100
- 20,768 · -8.2%
Race, ethnicity, and origin ACS 2023
- Neighborhood character
- Predominantly White (77%)
- Race & ethnicity
- White 77% Black 11% Two or more races 5% Hispanic / Latino 4% Asian 4%
- Common ancestry
- Slovak 2% Romanian 1% Lithuanian 1%
- Foreign-born
- 6% · Vietnam, Canada
- Languages at home
- 91% English-only · Vietnamese 4% Spanish 3% German/W. Germanic 1%
Political lean MEDSL · Franklin
- 2024 margin
- Solid R (+72.6) · D 13.6% · R 86.2%
- 2008→2024 swing
- -21.1pp toward R · 2008: -51.5pp · 2024: -72.6pp
- All cycles
- 2024: R+72.6 2020: R+69.5 2016: R+68.6 2012: R+59.5 2008: R+51.5
Not yet ingested
- Civics
- —
Market trends
- HPI YoY
- ▲ 62.43%
- Current HPI
- 410.693
- Rent YoY
- —
- Metro
- Athens-Clarke County, GA
- State GDP YoY
- ▲ 2.66%
- F500 in state
- 28
Industry mix (Fortune 500 HQ in GA)
| Industry | F500 HQs | Revenue |
|---|---|---|
| Paper / Packaging | 2 | $29B |
|
||
| Retail | 1 | $160B |
|
||
| Transportation / Logistics | 1 | $91B |
|
||
| Airlines | 1 | $62B |
|
||
| Consumer Goods | 1 | $47B |
|
||
| Utilities | 1 | $25B |
|
||
Price history
+212.9% since first listed7 events — show timeline
- 2026-05-15 Listing Removed — GAMLS
- 2026-05-13 Listed $219,000 GAMLS
- 2026-04-20 Relisted — GAMLS
- 2026-03-13 Contingent — GAMLS
- 2026-03-13 Relisted — GAMLS
- 2026-03-10 Listing Removed — GAMLS
- 2026-02-10 Listed $70,000 GAMLS
Property tax history
+0.0%/yrLatest (2025): $161 · +30.6% YoY. Source: county tax records.
Cash-flow waterfall
monthlySold comps — $/sqft
last 12 mo · ≤1 miLoading sold comps…