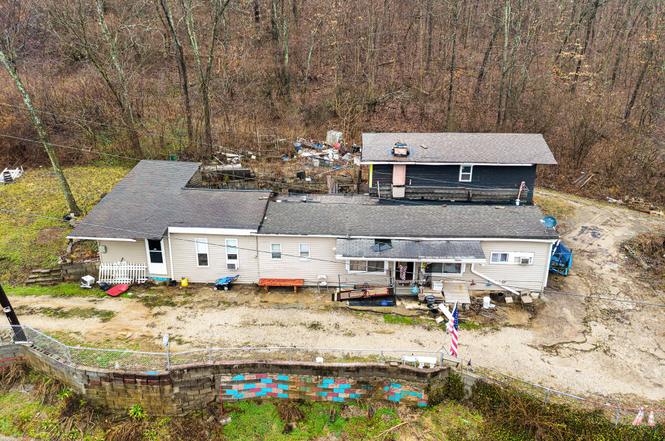
3085 Point Pleasant Rd · Hebron, KY
Flood risk 1/10 · Minimal
- FEMA flood zone
- X (unshaded)
- Chance of flooding over 30 yrs
- 0.0%
- Est. flood insurance / yr
- $507 – $1,088
Fire risk 1/10 · Minimal
- Est. fire insurance / yr
- $839 – $1,559
Heat risk 4/10 · Minor
- Hot days now (above 101°F)
- 7 days/yr
- Hot days in 30 yrs
- 19 days/yr
Wind risk 2/10 · Minimal
- Chance of severe wind over 30 yrs
- 1.0%
Air-quality risk 3/10 · Minor
- Unhealthy air days now
- 3 days/yr
- Unhealthy air days in 30 yrs
- 5 days/yr
Risk factors via First Street. Map © Google.
Why this score? — see what drove the B grade
The composite is a weighted blend of 9 inputs, each scored 0–100. Each bar is that input's sub-score; the figure is the points it added to the 100-point composite (weight × sub-score).
- Cash flow +30.0/30.0
- 1% rule +10.0/10.0
- DSCR +10.0/10.0
- ARV discount +7.5/15.0
- Schools +4.1/10.0
- Livability +4.0/5.0
- Rent growth +2.5/5.0
- Condition / age +2.5/5.0
- Appreciation +0.0/10.0
$115,000
🖨 Deal sheet 📄 Offer letter ✓ Due diligence
Listing remarks
3 Bedroom, 3 bathroom home with so much potential is being sold ''AS IS'' Ideal for investors or buyers looking for a renovation opportunity! Price reflects the renovations and updates needed.
Key facts
- 0.83 acre lot
- Parking
- Built 1940
Property features AI
Exterior
- Parking: Driveway
- Utilities: Cistern water; Septic tank sewer; Propane service
- Home design: Single-family residence; One level
- Construction: Built in 1940; Aluminum siding, brick, and wood siding exterior; Shingle roof; Block foundation
- Exterior features: Wood-frame windows
Interior
- Kitchen: Electric range; Microwave; Refrigerator
- Bedrooms: Primary bedroom (16 x 10); Bedroom 2 (12 x 10); Bedroom 3 (10 x 12)
- Bathrooms: 3 full bathrooms
- Heating & cooling: Forced air heating
- Interior features: Wood-burning fireplace; Crawl space basement
Neighborhood map
What this means for you Summary
Snapshot
- This is a 2-bed/1.0-bath single-family listed at $115k.
Deal economics
- At list price, monthly cash flow is $770 ($9k/yr) — positive.
- The deal already cash-flows at list — no discount required.
- Meets the 1% rule at list price ($2k rent vs $115k).
- Recommended offer: $105k (9.0% below list) — sets the bar for market timing.
- Cap rate 14.3% vs local median 3.8% in Hebron — top-decile yield for the area; either an underpriced asset or a hidden risk that comps aren't pricing in. Stress-test before assuming the spread holds.
Location & tenants
- Location reads 80/100 on livability (#69 in KY, #1,700 nationally) — a professional / high-income tenant draw. Strengths: crime A+, employment A+, cost of living A+; Watch: amenities F, commute F.
- Boone County (suburban): math 43% / reading 49% proficiency, ranked #12 of 165 in KY (top 7%) — families likely to look elsewhere, expect single-tenant / working-renter base with shorter leases.
- Zoned schools: Chester Goodridge Elementary School (math 39% / reading 51%, grade D-, #143 of 676 statewide, top 22%, 633 students, 45% FRL); Conner Middle School (math 50% / reading 62%, grade B-, #6 of 217 statewide, top 2%, 896 students, 35% FRL); Conner High School (math 47% / reading 51%, grade D, #15 of 254 statewide, top 6%, 1,443 students, 33% FRL).
- Market conditions: 198 active listings in the ZIP; high-income renter base; 1,430 units permitted in Boone County in 2024 (928 in 5+ unit buildings).
- This rent is only 16% of the median local income ($137k/yr) — well below the 30% rent-burden line; pricing power to push rent on renewal without tenant pushback.
Forward outlook
- Local home prices are declining (-3.0%/yr); year-one equity from $795 of loan paydown is wiped out by about $3k of value loss. Plan a longer hold.
- Boone County population projected at +24% by 2050 — long-run rental-demand tailwind backs the buy-and-hold thesis.
- At projected returns (-3.0% appreciation + 3.0% rent growth), your $32k cash investment doubles in ~5 years — after that, you're playing with house money.
Negotiation context
- It's been on market 104 days — a 9% lower offer ($105k) is reasonable based on typical stale-listing flexibility.
- 6 sale attempts since 30y ago with the ask held roughly flat each time — persistent listings suggest the price (not the market) is what's stuck; bring a comps-based counter.
- Current owner paid $58k; list at $115k implies a 98% gain — meaningful room to come down on a strong offer.
Risks & watch-outs
- Watch-outs: built in 1940 — expect roof / HVAC / electrical / plumbing capex.
Questions for the listing agent
- It's been on market 104 days. Have you received any prior offers? Is the seller open to a 9% concession, seller financing, or rate buy-down credit?
- Built in 1940 — when were the roof, HVAC, electrical panel, plumbing, and water heater last replaced?
- Why hasn't it sold? Are there any deal-killer items the seller is aware of (foundation, flood, title, zoning, code violations)?
- Is there a deadline driving the sale (1031 exchange, divorce, estate, relocation)? That informs how much negotiation room exists.
- Schools are A-rated — typically a magnet for longer-tenancy family renters. What's the average tenant stay here, and is there a school-zone premium baked into asking?
- What's the average days-on-market for RENTAL listings here right now (not sales)? A rising rental-DOM trend means longer vacancies and softer asking-rent achievability than the comps imply.
- What's the recent tenant-quality profile in this submarket — average credit score on applications, eviction rate, late-payment / NSF rate, and stable-employment percentage? A property-management company in the area should have these aggregated.
- How much new for-sale + rental construction is in the pipeline within 1–3 miles? Heavy new supply typically softens prices + rents 12–24 months out; constrained supply supports both.
Investment metrics
- 1% rule
- 1.61% ✓
- Cap rate
- 14.33%
- Cash-on-cash
- 28.70%
- DSCR
- 2.28
- GRM
- 5.2
CMA / ARV
No comps found within radius.
Projected returns pro-forma
-3.0% appreciation · 3.0% rent growth · sell at horizon
- IRR
- 23.0%
- Equity multiple
- 1.94×
- Total profit
- $30,383
- Equity at exit
- $17,147
- IRR
- 30.9%
- Equity multiple
- 3.78×
- Total profit
- $89,473
- Equity at exit
- $9,943
Cash invested: $32,200 (down + closing). Projections, not guarantees.
Landlord ↔ Tenant lean methodology
- Overall (STATE)
- 83 Strongly Landlord-Friendly
- State Kentucky
- 83 Strongly Landlord-Friendly · R+16
- County
- — inherits STATE
- City
- — inherits STATE
ZIP-level market 41048
- Home prices YoY
- -31.1%
- Active inventory
- 198
- Price-to-rent
- 5.2×
Monthly cashflow live
- Estimated rent
- $1,848 medium interval (Pro) →
- Mortgage (P&I)
- −$603
- Tax from tax record
- −$39 /mo · $467/yr
- Insurance
- −$48
- HOA
- −$0
- Vacancy / Maint / Mgmt
- −$388
- Net cashflow
- $770
Break-even live
UW: 25.0% down · 7.5% · 30yr · 1.5% tax · 5.0% vac · 8.0% maint · 8.0% mgmt
Financing live
Cash to close
- Down payment
- $28,750
- Closing costs
- $3,450
- Reserves months
- —
- Total cash needed
- —
Loan-product check · same deal, 3 products live
Conventional
25% down · 7.5% · 30yr
- Down + closing
- —
- Monthly P&I
- —
- Monthly cashflow
- —
- DSCR
- —
- Eligible?
- —
Personal DTI + credit; lowest rate.
DSCR
20% down · 8.5% · 30yr
- Down + closing
- —
- Monthly P&I
- —
- Monthly cashflow
- —
- DSCR
- —
- Eligible?
- —
No personal income docs; deal must DSCR.
Hard money
10% down · 12.0% · 12mo
- Down + closing
- —
- Monthly P&I
- —
- Monthly cashflow
- —
- DSCR
- —
- Eligible?
- —
Short-term bridge; refi at stabilization.
Listing history 30 events
-
2026-06-18days on market $115,000 Active 104 DOM
-
2026-06-17days on market $115,000 Active 103 DOM
-
2026-06-16days on market $115,000 Active 102 DOM
-
2026-06-15days on market $115,000 Active 101 DOM
-
2026-06-13days on market $115,000 Active 99 DOM
-
2026-06-09days on market $115,000 Active 95 DOM
-
2026-06-08days on market $115,000 Active 94 DOM
-
2026-06-07days on market $115,000 Active 93 DOM
-
2026-06-05days on market $115,000 Active 90 DOM
-
2026-06-03days on market $115,000 Active 89 DOM
-
2026-06-02days on market $115,000 Active 88 DOM
-
2026-06-01days on market $115,000 Active 87 DOM
-
2026-05-31days on market $115,000 Active 86 DOM
-
2026-04-20price $115,000
-
2026-03-06$120,000 Active
-
2025-03-24historical
-
2025-01-06price $105,000
-
2025-01-06$105,000 Active
-
2025-01-06historical
-
2024-12-10price $110,000
-
2024-12-03$125,000 Active
-
2023-04-07historical
-
2023-03-29price $82,000
-
2023-02-19$85,000 Active
-
2022-05-19soldstatus $58,000
-
2012-12-03soldstatus $20,000
-
2012-08-27$25,000
-
1996-05-23soldstatus $32,000
-
1996-05-22soldstatus $32,000
-
1996-03-15$34,900
ⓘ Source: listings_history table (triggers on properties + properties_extension) + one-shot
backfill from property_details.listing_events for pre-trigger history.
Tax reassessment forecast KY · Resets to sale price
- Current annual tax
- $467 · $39/mo
- Projected year-2 tax
- $989 · $82/mo
- Expected delta
- +$522/yr (+$44/mo · 111.9%)
ⓘ Screening estimate from a state-policy table — verify with the county assessor before closing.
Climate risk First Street
- Flood 1/10 Low FEMA zone X (unshaded) · 0% chance over 30 yrs
- Wildfire 1/10 Low
- Heat 4/10 Moderate 7 d/yr ≥101°F today · 19 d/yr by 30 yrs out
- Wind 2/10 Low 100% chance of damaging wind over 30 yrs
- Air quality 3/10 Moderate 3 unhealthy d/yr today · 5 by 30 yrs out
Nearby sold comps map
Loading sold comps map…
Walkable amenities ~0.75 mi
Loading nearby amenities…
Taxation est. · year 1
- Rental income
- $22,178
- − Mortgage interest
- −$6,442
- − Property taxes
- −$467
- − Insurance
- −$575
- − Repairs & maintenance
- −$1,774
- − Management
- −$1,774
- − Depreciation
- −$3,345
- Taxable income
- $7,801
- Est. tax owed @ 24.0%
- −$1,872
- After-tax cash flow
- $7,370/yr
For passive investors: Depreciation is non-cash, so a rental often shows a tax loss while cash-flowing — sheltering income. Rental losses are passive: they offset passive income freely, and up to $25,000/yr can offset ordinary (W-2) income if you actively participate and your MAGI is under $100k (phasing out to $0 by $150k); unused losses carry forward. On sale, claimed depreciation is recaptured at up to 25%, and gains may owe capital-gains tax (a 1031 exchange can defer both). Figures are a year-1 estimate at your 24.0% rate — not tax advice; consult a CPA.
Schools (NCES district)
- District
- Boone County
- NCES district ID
- 2100510
- Math proficiency
- 43% ▼ -10.00%
- Reading proficiency
- 49% ▼ -12.00%
- Median HH income
- $68,096
- Composite
- 41.18/100
- National rank
- #3550
- State rank
- #12 of 165 in KY
Livability — Hebron
- Score
- 80/100
- State rank
- #69
- US rank
- #1700
Category grades
Schools grade is shown separately in the Schools card above.
Census & demographics
- County
- Boone County · 99,563 people
- City population
- 16,211
- Metro
- Cincinnati, OH-KY-IN
- Population (ZIP)
- 16,211
- Household income
- $137,398
- Rent vs Own
- Severe rent burden
- 169.0
Population outlook (Boone County) Hauer SSP2
- Today (2025)
- 144,066 people
- By 2030
- 152,005 · +5.5%
- By 2040
- 166,776 · +15.8%
- By 2050
- 178,974 · +24.2%
- By 2075
- 204,515 · +42.0%
- By 2100
- 215,306 · +49.4%
Race, ethnicity, and origin ACS 2023
- Neighborhood character
- Predominantly White (86%)
- Race & ethnicity
- White 86% Hispanic / Latino 7% Two or more races 6% Asian 2% Black 2%
- Hispanic origin (detail)
- Mexican 3% Puerto Rican 2%
- Common ancestry
- Slovak 2% Lithuanian 2% Scottish 2%
- Foreign-born
- 6% · Canada
- Languages at home
- 91% English-only · Spanish 5% Other Indo-European 1% German/W. Germanic 1%
Political lean MEDSL · Boone
- 2024 margin
- Solid R (+37.2) · D 30.6% · R 67.8% · Other 1.7%
- 2008→2024 swing
- -2.7pp toward R · 2008: -34.5pp · 2024: -37.2pp
- All cycles
- 2024: R+37.2 2020: R+35.7 2016: R+41.8 2012: R+38.7 2008: R+34.5
Not yet ingested
- Civics
- —
Market trends
- HPI YoY
- ▼ -85.70%
- Current HPI
- 189.8568
- Rent YoY
- —
- Metro
- Cincinnati, OH-KY-IN
- State GDP YoY
- ▲ 1.81%
- F500 in state
- 4
Industry mix (Fortune 500 HQ in KY)
| Industry | F500 HQs | Revenue |
|---|---|---|
| Healthcare | 1 | $118B |
|
||
| Food / Beverage | 1 | $7B |
|
||
Price history
+229.5% since first listed17 events — show timeline
- 2026-04-20 Price Changed $115,000 NKMLS
- 2026-03-06 Listed $120,000 NKMLS
- 2025-03-24 Listing Removed — NKMLS
- 2025-01-06 Price Changed $105,000 NKMLS
- 2025-01-06 Listing Removed — NKMLS
- 2025-01-06 Listed $105,000 NKMLS
- 2024-12-10 Price Changed $110,000 NKMLS
- 2024-12-03 Listed $125,000 NKMLS
- 2023-04-07 Listing Removed — NKMLS
- 2023-03-29 Price Changed $82,000 NKMLS
- 2023-02-19 Listed $85,000 NKMLS
- 2022-05-19 Sold (Public Records) $58,000 Public Records
- 2012-12-03 Sold (MLS) $20,000 NKMLS
- 2012-08-27 Listed $25,000 NKMLS
- 1996-05-23 Sold (Public Records) $32,000 Public Records
- 1996-05-22 Sold (MLS) $32,000 NKMLS
- 1996-03-15 Listed $34,900 NKMLS
Property tax history
-3.2%/yrLatest (2025): $467 · -4.8% YoY. Source: county tax records.
Cash-flow waterfall
monthlySold comps — $/sqft
last 12 mo · ≤1 miLoading sold comps…