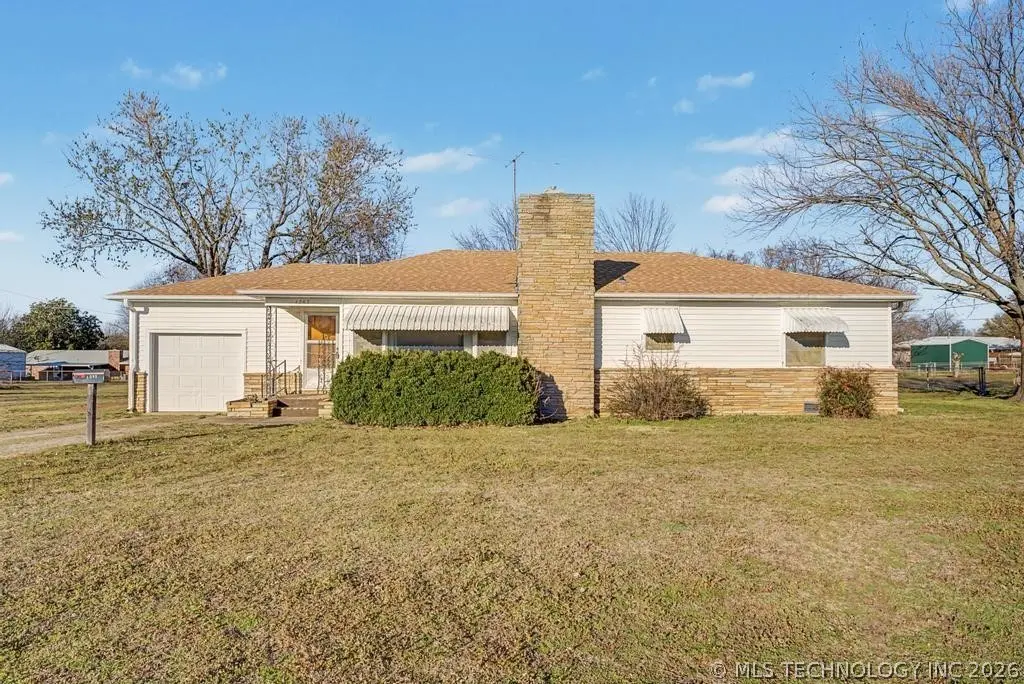
1202 W Davis Dr · Nowata, OK
Flood risk No data
- FEMA flood zone
- —
- Chance of flooding over 30 yrs
- —
- Est. flood insurance / yr
- —
Fire risk No data
- Est. fire insurance / yr
- —
Heat risk No data
- Hot days now (above threshold)
- —
- Hot days in 30 yrs
- —
Wind risk No data
- Chance of severe wind over 30 yrs
- —
Air-quality risk No data
- Unhealthy air days now
- —
- Unhealthy air days in 30 yrs
- —
Risk factors via First Street. Map © Google.
Why this score? — see what drove the D+ grade
The composite is a weighted blend of 9 inputs, each scored 0–100. Each bar is that input's sub-score; the figure is the points it added to the 100-point composite (weight × sub-score).
- Cash flow +18.7/30.0
- Appreciation +8.4/10.0
- DSCR +5.9/10.0
- 1% rule +3.8/10.0
- ARV discount +3.7/15.0
- Livability +2.9/5.0
- Rent growth +2.5/5.0
- Condition / age +2.5/5.0
- Schools +1.2/10.0
$124,860
🖨 Deal sheet 📄 Offer letter ✓ Due diligence
Key facts
- 0.6 acre lot
- Garage
- Built 1949
Property features AI
Exterior
- Parking: Attached garage (1 car)
- Security: No safety shelter
- Utilities: Public water; Public sewer
- Home design: Single-story home; Faces south; Slab foundation
- Construction: Wood siding and wood frame construction; Built (year source: public records)
- Exterior features: Front porch; Shed(s)
Interior
- Kitchen: Cooktop; Double oven; Oven; Range; Refrigerator
- Bedrooms: Three bedrooms on the first level (including a master bedroom)
- Flooring: Carpet
- Bathrooms: 1 full bathroom
- Heating & cooling: Central heating; Central air conditioning
- Interior features: Laminate counters; Cable TV; Ceiling fan(s); Gas log fireplace
- Laundry & utility: Washer hookup
Neighborhood map
What this means for you Summary
Snapshot
- This is a 3-bed/1.0-bath single-family listed at $125k.
Deal economics
- At list price, monthly cash flow is $124 ($1k/yr) — positive.
- The deal already cash-flows at list — no discount required.
- To meet the 1% rule (rent ≥ 1% of price), the offer needs to be $109k (12.5% below list).
- Recommended offer: $109k (12.5% below list) — sets the bar for 1% rule.
- Cap rate 7.5% vs local median 4.7% in Nowata — top-decile yield for the area; either an underpriced asset or a hidden risk that comps aren't pricing in. Stress-test before assuming the spread holds.
Location & tenants
- Location reads 58/100 on livability (#455 in OK) — a working-class tenant base; expect higher turnover. Strengths: cost of living A+, housing A+; Watch: schools F, amenities F, commute F.
- Nowata (town): math 10% / reading 18% proficiency, ranked #234 of 270 in OK (top 87%) — low school quality limits family demand, transient renter base, plan for 1-2y turnover; 61% free/reduced lunch — lower-income household profile, screen leases tightly.
- Market conditions: 50 active listings in the ZIP; 8 units permitted in Nowata County in 2024 (0 in 5+ unit buildings).
Forward outlook
- In year one you build about $9k of equity ($863 loan paydown + $8k appreciation (6.8% local appreciation)).
- Nowata County population projected at +4% by 2050 — modest demand growth; plan on rents tracking national, not racing it.
- At projected returns (6.8% appreciation + 3.0% rent growth), your $35k cash investment doubles in ~3 years — after that, you're playing with house money.
- By year 4, paydown + projected appreciation supports a ~$32k cash-out refi (75% LTV) — recoverable capital for the next deal without selling this one.
Negotiation context
- It's been on market 37 days — a 3% lower offer ($121k) is reasonable based on typical stale-listing flexibility.
Risks & watch-outs
- Watch-outs: built in 1949 — expect roof / HVAC / electrical / plumbing capex.
Questions for the listing agent
- It's been on market 37 days. Have you received any prior offers? Is the seller open to a 12% concession, seller financing, or rate buy-down credit?
- Built in 1949 — when were the roof, HVAC, electrical panel, plumbing, and water heater last replaced?
- Is there a deadline driving the sale (1031 exchange, divorce, estate, relocation)? That informs how much negotiation room exists.
- Schools are F-rated, which usually means shorter tenancies and higher turnover. Who's the typical renter profile here, and what's been the actual vacancy rate?
- The area grade is low — what's the realistic commute time and amenity access for the typical tenant pool here? Any planned neighborhood developments (good or bad) we should know about?
- What's the average days-on-market for RENTAL listings here right now (not sales)? A rising rental-DOM trend means longer vacancies and softer asking-rent achievability than the comps imply.
- What's the recent tenant-quality profile in this submarket — average credit score on applications, eviction rate, late-payment / NSF rate, and stable-employment percentage? A property-management company in the area should have these aggregated.
- How much new for-sale + rental construction is in the pipeline within 1–3 miles? Heavy new supply typically softens prices + rents 12–24 months out; constrained supply supports both.
Investment metrics
- 1% rule
- 0.88% ✗
- Cap rate
- 7.49%
- Cash-on-cash
- 4.26%
- DSCR
- 1.19
- GRM
- 9.5
CMA / ARV
- ARV (on-the-fly)
- $115,244
- Comps found
- 9
Show comp detail 9 sales within ~0.75 mi
| Address | Dist | Beds/Ba | Sqft | Sold | Price | $/sf | Match |
|---|---|---|---|---|---|---|---|
| 1202 W Davis Dr | 0.00mi | 3/1.0 | 1,226 (0%) | 0mo | $122,500 | $100 | 100 |
| 929 W Shawnee St | 0.12mi | 3/1.5 | 1,332 (+9%) | 8mo | $146,000 | $110 | 71 |
| 327 Mississippi St | 0.16mi | 3/1.5 | 1,315 (+7%) | 19mo | $153,000 | $116 | 62 |
| 418 W Delaware Ave | 0.50mi | 4/1.0 (+1) | 1,248 (+2%) | 12mo | $115,000 | $92 | 59 |
| 349 N Pine St | 0.64mi | 3/1.0 | 1,206 (-2%) | 16mo | $113,500 | $94 | 55 |
| 707 W Shawnee Ave | 0.31mi | 3/1.5 | 1,127 (-8%) | 23mo | $143,000 | $127 | 51 |
| 328 W Choctaw Ave | 0.52mi | 3/1.0 | 1,306 (+6%) | 22mo | $88,000 | $67 | 46 |
| 206 S Hickory St | 0.65mi | 3/1.5 | 1,352 (+10%) | 11mo | $105,000 | $78 | 41 |
| 324 W Modoc | 0.66mi | 2/2.0 (-1) | 1,260 (+3%) | 24mo | $45,000 | $36 | 36 |
Match score weights: distance 35% · size 25% · config 20% · recency 20%. Top-matched comps best support the ARV.
Projected returns pro-forma
6.75% appreciation · 3.0% rent growth · sell at horizon
- IRR
- 20.5%
- Equity multiple
- 2.42×
- Total profit
- $49,563
- Equity at exit
- $84,514
- IRR
- 19.4%
- Equity multiple
- 4.95×
- Total profit
- $138,242
- Equity at exit
- $158,750
Cash invested: $34,961 (down + closing). Projections, not guarantees.
Landlord ↔ Tenant lean methodology
- Overall (STATE)
- 83 Strongly Landlord-Friendly
- State Oklahoma
- 83 Strongly Landlord-Friendly · R+20
- County
- — inherits STATE
- City
- — inherits STATE
ZIP-level market 74048
- Home prices YoY
- 2.9%
- Active inventory
- 50
- Price-to-rent
- 9.5×
Monthly cashflow live
- Estimated rent
- $1,093 medium interval (Pro) →
- Mortgage (P&I)
- −$655
- Tax from tax record
- −$32 /mo · $387/yr
- Insurance
- −$52
- HOA
- −$0
- Vacancy / Maint / Mgmt
- −$229
- Net cashflow
- $124
Break-even live
UW: 25.0% down · 7.5% · 30yr · 1.5% tax · 5.0% vac · 8.0% maint · 8.0% mgmt
Financing live
Cash to close
- Down payment
- $31,215
- Closing costs
- $3,746
- Reserves months
- —
- Total cash needed
- —
Loan-product check · same deal, 3 products live
Conventional
25% down · 7.5% · 30yr
- Down + closing
- —
- Monthly P&I
- —
- Monthly cashflow
- —
- DSCR
- —
- Eligible?
- —
Personal DTI + credit; lowest rate.
DSCR
20% down · 8.5% · 30yr
- Down + closing
- —
- Monthly P&I
- —
- Monthly cashflow
- —
- DSCR
- —
- Eligible?
- —
No personal income docs; deal must DSCR.
Hard money
10% down · 12.0% · 12mo
- Down + closing
- —
- Monthly P&I
- —
- Monthly cashflow
- —
- DSCR
- —
- Eligible?
- —
Short-term bridge; refi at stabilization.
Listing history 3 events
-
2026-04-26status Pending
-
2026-04-17price $124,860
-
2026-03-20$134,860 Active
ⓘ Source: listings_history table (triggers on properties + properties_extension) + one-shot
backfill from property_details.listing_events for pre-trigger history.
Tax reassessment forecast OK · Resets to sale price
- Current annual tax
- $387 · $32/mo
- Projected year-2 tax
- $1,124 · $94/mo
- Expected delta
- +$737/yr (+$61/mo · 190.4%)
ⓘ Screening estimate from a state-policy table — verify with the county assessor before closing.
Nearby sold comps map
Loading sold comps map…
Walkable amenities ~0.75 mi
Loading nearby amenities…
Taxation est. · year 1
- Rental income
- $13,113
- − Mortgage interest
- −$6,994
- − Property taxes
- −$387
- − Insurance
- −$624
- − Repairs & maintenance
- −$1,049
- − Management
- −$1,049
- − Depreciation
- −$3,632
- Taxable loss
- −$623
- Est. tax savings @ 24.0%
- +$149
- After-tax cash flow
- $1,640/yr
For passive investors: Depreciation is non-cash, so a rental often shows a tax loss while cash-flowing — sheltering income. Rental losses are passive: they offset passive income freely, and up to $25,000/yr can offset ordinary (W-2) income if you actively participate and your MAGI is under $100k (phasing out to $0 by $150k); unused losses carry forward. On sale, claimed depreciation is recaptured at up to 25%, and gains may owe capital-gains tax (a 1031 exchange can defer both). Figures are a year-1 estimate at your 24.0% rate — not tax advice; consult a CPA.
Schools (NCES district)
- District
- Nowata
- NCES district ID
- 4021930
- Math proficiency
- 10% ▼ -26.00%
- Reading proficiency
- 18% ▼ -15.00%
- Median HH income
- $37,644
- Composite
- 11.73/100
- National rank
- #9689
- State rank
- #234 of 270 in OK
Livability — Nowata
- Score
- 58/100
- State rank
- #455
- US rank
- #21518
Category grades
Schools grade is shown separately in the Schools card above.
Census & demographics
- Census place
- Nowata, OK
- City population
- 5,592
- Population (ZIP)
- 5,592
Population outlook (Nowata County) Hauer SSP2
- Today (2025)
- 10,711 people
- By 2030
- 10,803 · +0.9%
- By 2040
- 10,984 · +2.5%
- By 2050
- 11,094 · +3.6%
- By 2075
- 11,730 · +9.5%
- By 2100
- 11,734 · +9.6%
Race, ethnicity, and origin ACS 2023
- Neighborhood character
- Diverse neighborhood (Simpson 0.58)
- Race & ethnicity
- White 64% Native American 16% Two or more races 14% Hispanic / Latino 4% Black 2%
- Common ancestry
- Iranian 2% Slovak 2% European 2%
- Foreign-born
- 1% · Vietnam
- Languages at home
- 97% English-only · Spanish 1%
Political lean MEDSL · Nowata
- 2024 margin
- Solid R (+67.0) · D 15.8% · R 82.8% · Other 1.5%
- 2008→2024 swing
- -30.5pp toward R · 2008: -36.5pp · 2024: -67.0pp
- All cycles
- 2024: R+67.0 2020: R+66.0 2016: R+60.9 2012: R+39.0 2008: R+36.5
Not yet ingested
- Civics
- —
Market trends
- HPI YoY
- ▲ 6.75%
- Current HPI
- 237.1251
- Rent YoY
- —
- Metro
- —
- State GDP YoY
- ▲ 1.55%
- F500 in state
- 6
Industry mix (Fortune 500 HQ in OK)
| Industry | F500 HQs | Revenue |
|---|---|---|
| Energy | 3 | $48B |
|
||
Price history
-7.4% since first listed3 events — show timeline
- 2026-04-26 Pending — MLS Technology, Inc.
- 2026-04-17 Price Changed $124,860 MLS Technology, Inc.
- 2026-03-20 Listed $134,860 MLS Technology, Inc.
Property tax history
+4.2%/yrLatest (2025): $387 · +5.4% YoY. Source: county tax records.
Cash-flow waterfall
monthlySold comps — $/sqft
last 12 mo · ≤1 miLoading sold comps…