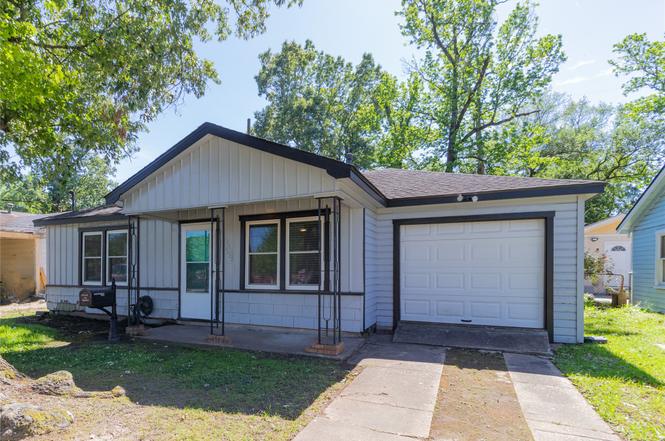
4425 Harding Dr · Beaumont, TX
Flood risk 3/10 · Minor
- FEMA flood zone
- X
- Chance of flooding over 30 yrs
- 0.2%
- Est. flood insurance / yr
- $507 – $1,088
Fire risk 1/10 · Minimal
- Est. fire insurance / yr
- $1,222 – $2,270
Heat risk 9/10 · Severe
- Hot days now (above 109°F)
- 7 days/yr
- Hot days in 30 yrs
- 23 days/yr
Wind risk 9/10 · Severe
- Chance of severe wind over 30 yrs
- 99.0%
Air-quality risk 2/10 · Minimal
- Unhealthy air days now
- 1 days/yr
- Unhealthy air days in 30 yrs
- 1 days/yr
Risk factors via First Street. Map © Google.
Why this score? — see what drove the B- grade
The composite is a weighted blend of 9 inputs, each scored 0–100. Each bar is that input's sub-score; the figure is the points it added to the 100-point composite (weight × sub-score).
- Cash flow +25.7/30.0
- DSCR +8.6/10.0
- Appreciation +7.7/10.0
- ARV discount +7.5/15.0
- 1% rule +7.1/10.0
- Livability +3.2/5.0
- Rent growth +2.5/5.0
- Condition / age +2.5/5.0
- Schools +1.5/10.0
$95,000
🖨 Deal sheet (PDF) 📄 Offer letter ✓ Due diligence
Listing remarks MLS
This home has 3 bedrooms and 2 full bathrooms. Driveway leads to the 1 car attached garage. From the front patio you enter the living room that is neutral colors and has a built in bookcase for great storage. Kitchen has white cabinets, stainless refrigerator and a gas stove. All walls and floors are neutral colors. 2 bedrooms have ceiling fans. Covered back patio to sit and watch the kids enjoy the spacious backyard with several great trees that provide shade. There is also a metal storage shed in the back. Be sure to call and make an appointment to see this one!
Key facts
- Functional kitchen
- Private backyard
- Secure parking
Tags
Property features AI
Finance
- Other: Lease not considered
Exterior
- Parking: Garage; 1-car garage
- Utilities: Public water; Public sewer
- Home design: Residential property; Built in 1962; Slab foundation; Composition roof
- Construction: Vinyl siding construction
- Exterior features: Subdivision lot
Interior
- Kitchen: Kitchen (first level)
- Bedrooms: Primary bedroom (first level); Bedroom (first level); Bedroom (first level)
- Bathrooms: 2 full bathrooms
- Heating & cooling: Central heating (gas); Central electric air conditioning
- Interior features: Living room; Total of 5 rooms
Neighborhood map
What this means for you Summary
Snapshot
- This is a 3-bed/2.0-bath single-family listed at $95k.
Deal economics
- At list price, monthly cash flow is $229 ($3k/yr) — positive.
- The deal already cash-flows at list — no discount required.
- Meets the 1% rule at list price ($1k rent vs $95k).
- Cap rate 9.2% vs local median 5.3% in Beaumont — top-decile yield for the area; either an underpriced asset or a hidden risk that comps aren't pricing in. Stress-test before assuming the spread holds.
Location & tenants
- Location reads 64/100 on livability (#739 in TX) — a middle-class / working-renter tenant base. Strengths: cost of living A+, housing A+, health & safety A+; Watch: employment D, crime F, amenities F.
- Beaumont ISD (urban): math 14% / reading 22% proficiency, ranked #789 of 826 in TX (top 96%) — low school quality limits family demand, transient renter base, plan for 1-2y turnover; 69% free/reduced lunch — lower-income household profile, screen leases tightly.
- Zoned schools: Smith Middle (math 4% / reading 8%, grade F, #1,659 of 1,662 statewide, top 100%, 475 students, 90% FRL, charter); Beaumont United H S (math 8% / reading 16%, grade F, #1,554 of 1,632 statewide, top 95%, 2,131 students, 86% FRL) — zoned schools average 88% FRL vs 69% district-wide (19 pts higher); higher-poverty schools than district average — tighter screening recommended.
- Market conditions: 80 active listings in the ZIP; 16 comparable units currently listed for rent nearby; rentals at typical pace (median 25d on market — plan ~3-4 weeks tenant-placement turnaround); 44% of comp listings sitting > 30 days — soft ceiling on asking rent; lower-income renter base — watch delinquency; 343 units permitted in Jefferson County in 2024 (0 in 5+ unit buildings).
- This rent runs 43% of the median local income ($32k/yr) — at the standard rent-burdened threshold; future hikes will face affordability resistance.
Forward outlook
- In year one you build about $6k of equity ($657 loan paydown + $5k appreciation (5.4% local appreciation)).
- At projected returns (5.4% appreciation + 3.0% rent growth), your $27k cash investment doubles in ~3 years — after that, you're playing with house money.
- By year 6, paydown + projected appreciation supports a ~$31k cash-out refi (75% LTV) — recoverable capital for the next deal without selling this one.
Negotiation context
- Only 1 days on market — expect competitive offers; lowballing is unlikely to land.
- 6 sale attempts since 8y ago with the ask held roughly flat each time — persistent listings suggest the price (not the market) is what's stuck; bring a comps-based counter.
Risks & watch-outs
- Climate carrying-cost: severe wind risk, 99% chance of damaging wind over 30y; extreme-heat days projected 7→23/yr by 2055 (HVAC capex compounding) — expect insurance premiums to compound above CPI over the hold.
Questions for the listing agent
- Built in 1962 — when were the roof, HVAC, electrical panel, plumbing, and water heater last replaced?
- Is there a deadline driving the sale (1031 exchange, divorce, estate, relocation)? That informs how much negotiation room exists.
- Schools are D-rated, which usually means shorter tenancies and higher turnover. Who's the typical renter profile here, and what's been the actual vacancy rate?
- Crime grade is F in this area — have there been break-ins, vandalism, or insurance claims at this property in the last 3 years? What carrier currently insures it and at what premium?
- What's the average days-on-market for RENTAL listings here right now (not sales)? A rising rental-DOM trend means longer vacancies and softer asking-rent achievability than the comps imply.
- What's the recent tenant-quality profile in this submarket — average credit score on applications, eviction rate, late-payment / NSF rate, and stable-employment percentage? A property-management company in the area should have these aggregated.
- How much new for-sale + rental construction is in the pipeline within 1–3 miles? Heavy new supply typically softens prices + rents 12–24 months out; constrained supply supports both.
Investment metrics
- 1% rule
- 1.21% ✓
- Cap rate
- 9.18%
- Cash-on-cash
- 10.31%
- DSCR
- 1.46
- GRM
- 6.9
CMA / ARV
- ARV (median comp)
- $95,000
- List price
- $95,000
- Delta
- 5.26%
- Verdict
- FAIR
- Comps
- 11 within 1.0 mi
Show comp detail 3 sales within ~0.75 mi
| Address | Dist | Beds/Ba | Sqft | Sold | Price | $/sf | Match |
|---|---|---|---|---|---|---|---|
| 3630 Steelton St | 0.64mi | 2/1.0 (-1) | 856 (+2%) | 3mo | $115,000 | $134 | 55 |
| 3975 Steelton St | 0.47mi | 3/1.0 | 908 (+8%) | 14mo | $99,900 | $110 | 49 |
| 3845 W Lynwood Dr | 0.55mi | 2/1.0 (-1) | 734 (-13%) | 20mo | $35,000 | $48 | 28 |
Match score weights: distance 35% · size 25% · config 20% · recency 20%. Top-matched comps best support the ARV.
Projected returns pro-forma
5.43% appreciation · 3.0% rent growth · sell at horizon
- IRR
- 22.7%
- Equity multiple
- 2.46×
- Total profit
- $38,863
- Equity at exit
- $56,364
- IRR
- 21.9%
- Equity multiple
- 4.91×
- Total profit
- $103,919
- Equity at exit
- $99,435
Cash invested: $26,600 (down + closing). Projections, not guarantees.
Landlord ↔ Tenant lean methodology
- Overall (STATE)
- 87 Strongly Landlord-Friendly
- State Texas
- 87 Strongly Landlord-Friendly · R+5
- County
- — inherits STATE
- City
- — inherits STATE
ZIP-level market 77703
- Home prices YoY
- 3.7%
- Active inventory
- 80
- Price-to-rent
- 6.9×
Monthly cashflow live
- Estimated rent
- $1,148 high interval (Pro) →
- Mortgage (P&I)
- −$498
- Tax from tax record
- −$141 /mo · $1,690/yr
- Insurance
- −$40
- HOA
- −$0
- Vacancy / Maint / Mgmt
- −$241
- Net cashflow
- $229
Break-even live
Sensitivity live
| Price | -10% $282 | -5% $255 | +0% $229 | +5% $202 | +10% $175 |
|---|---|---|---|---|---|
| Rent | -10% $138 | -5% $183 | +0% $229 | +5% $274 | +10% $319 |
| Rate | -1.0pp $276 | -0.5pp $253 | base $229 | +0.5pp $204 | +1.0pp $179 |
UW: 25.0% down · 7.5% · 30yr · 1.5% tax · 5.0% vac · 8.0% maint · 8.0% mgmt
Financing live
Cash to close
- Down payment
- $23,750
- Closing costs
- $2,850
- Reserves months
- —
- Total cash needed
- —
Loan-product check · same deal, 3 products live
Conventional
25% down · 7.5% · 30yr
- Down + closing
- —
- Monthly P&I
- —
- Monthly cashflow
- —
- DSCR
- —
- Eligible?
- —
Personal DTI + credit; lowest rate.
DSCR
20% down · 8.5% · 30yr
- Down + closing
- —
- Monthly P&I
- —
- Monthly cashflow
- —
- DSCR
- —
- Eligible?
- —
No personal income docs; deal must DSCR.
Hard money
10% down · 12.0% · 12mo
- Down + closing
- —
- Monthly P&I
- —
- Monthly cashflow
- —
- DSCR
- —
- Eligible?
- —
Short-term bridge; refi at stabilization.
Rent comps 16 comps
| Address | Beds | Baths | Sqft | Rent | $/sqft | DOM | Units | Dist |
|---|---|---|---|---|---|---|---|---|
| 4565 Detroit St Beaumont, TX | 2.0 | 1.0 | 880 | $995 | $1.13 | 45d | 1 | 0.38mi |
| 2550 Pierce St Beaumont, TX | 2.0 | 1.0 | 1044 | $1,050 | $1.01 | 45d | 1 | 0.49mi |
| 2530 Pierce St Beaumont, TX | 2.0 | 1.0 | 950 | $1,000 | $1.05 | 45d | 1 | 0.50mi |
| 2450 N Lynwood Dr Beaumont, TX | 3.0 | 1.0 | 1015 | $1,175 | $1.16 | 24d | 1 | 0.55mi |
| 5070 Wilshire St Beaumont, TX | 2.0 | 1.0 | 1042 | $1,295 | $1.24 | 15d | 1 | 0.58mi |
| 5080 Helbig Rd Beaumont, TX | 2.0–3.0 | 1.0 | 775 | $750 | $0.97 | 15d | 1 | 0.58mi |
| 2420 Wilson St Beaumont, TX | 2.0 | 1.0 | 840 | $1,200 | $1.43 | 45d | 1 | 0.60mi |
| 2575 Primrose St Unit 3 Beaumont, TX | 2.0 | 1.0 | 800 | $900 | $1.12 | 24d | 1 | 0.70mi |
| 3155 French Rd Beaumont, TX | 1.0–3.0 | 1.0–2.0 | 905 | $999 | $1.10 | 15d | 9 | 0.71mi |
| 2270 Johnson St Beaumont, TX | 2.0 | 1.0 | 700 | $800 | $1.14 | 24d | 1 | 0.76mi |
| 2125 Earl St Beaumont, TX | 2.0 | 1.0 | 785 | $995 | $1.27 | 45d | 1 | 0.97mi |
| 2125 Earl St Beaumont, TX | 2.0 | 1.0 | 785 | $900 | $1.15 | 24d | 1 | 0.97mi |
| 3910 Treadway Rd Beaumont, TX | 2.0–3.0 | 1.0–1.5 | 1019 | $1,849 | $1.81 | 15d | 10 | 1.03mi |
| 4695 Collier St #8 Beaumont, TX | 2.0 | 1.5 | 1121 | $1,150 | $1.03 | 45d | 1 | 1.22mi |
| 4636 Collier St Beaumont, TX | 2.0 | 1.0 | 969 | $1,030 | $1.06 | 45d | 1 | 1.31mi |
| 2570 Sweetgum Ln Beaumont, TX | 1.0–2.0 | 1.0–1.5 | 876 | $1,599 | $1.82 | 15d | 15 | 1.48mi |
Listing history 28 events
-
2026-06-21pricedays on market $95,000 Active 1 DOM
-
2026-06-18days on market $100,000 Active 71 DOM
-
2026-06-17days on market $100,000 Active 70 DOM
-
2026-06-16days on market $100,000 Active 69 DOM
-
2026-06-15days on market $100,000 Active 68 DOM
-
2026-06-14days on market $100,000 Active 66 DOM
-
2026-06-13days on market $100,000 Active 65 DOM
-
2026-06-10days on market $100,000 Active 63 DOM
-
2026-06-09days on market $100,000 Active 62 DOM
-
2026-06-08days on market $100,000 Active 61 DOM
-
2026-06-07days on market $100,000 Active 60 DOM
-
2026-06-03days on market $100,000 Active 56 DOM
-
2026-06-02days on market $100,000 Active 55 DOM
-
2026-06-01days on market $100,000 Active 54 DOM
-
2026-05-31days on market $100,000 Active 53 DOM
-
2026-05-30days on market $100,000 Active 52 DOM
-
2026-04-08$100,000 Active 561-char remark
-
2026-02-26historical $1,100
-
2025-11-30$1,100
-
2025-11-30historical $1,100
-
2025-11-26$1,100
-
2025-10-19historical $1,100
-
2025-09-21$1,100
-
2023-03-01soldstatus
-
2018-06-06soldstatus
-
2018-06-01soldstatus 570-char remark
Show marketing remark (570 chars)
This home has 3 bedrooms and 2 full bathrooms. Driveway leads to the 1 car attached garage. From the front patio you enter the living room that is neutral colors and has a built in bookcase for great storage. Kitchen has white cabinets, stainless refrigerator and a gas stove. All walls and floors are neutral colors. 2 bedrooms have ceiling fans. Covered back patio to sit and watch the kids enjoy the spacious backyard with several great trees that provide shade. There is also a metal storage shed in the back. Be sure to call and make an appointment to see this one!
-
2018-05-23$67,900 570-char remark
Show marketing remark (570 chars)
This home has 3 bedrooms and 2 full bathrooms. Driveway leads to the 1 car attached garage. From the front patio you enter the living room that is neutral colors and has a built in bookcase for great storage. Kitchen has white cabinets, stainless refrigerator and a gas stove. All walls and floors are neutral colors. 2 bedrooms have ceiling fans. Covered back patio to sit and watch the kids enjoy the spacious backyard with several great trees that provide shade. There is also a metal storage shed in the back. Be sure to call and make an appointment to see this one!
-
2017-12-21soldstatus
ⓘ Source: listings_history table (triggers on properties + properties_extension) + one-shot
backfill from property_details.listing_events for pre-trigger history.
Tax reassessment forecast TX · Resets to sale price
- Current annual tax
- $1,690 · $141/mo
- Projected year-2 tax
- $1,738 · $145/mo
- Expected delta
- +$49/yr (+$4/mo · 2.9%)
ⓘ Screening estimate from a state-policy table — verify with the county assessor before closing.
Climate risk First Street
- Flood 3/10 Moderate FEMA zone X · 20% chance over 30 yrs
- Wildfire 1/10 Low
- Heat 9/10 Extreme 7 d/yr ≥109°F today · 23 d/yr by 30 yrs out
- Wind 9/10 Extreme 99% chance of damaging wind over 30 yrs
- Air quality 2/10 Low 1 unhealthy d/yr today · 1 by 30 yrs out
Nearby sold comps map
Loading sold comps map…
Walkable amenities ~0.75 mi
Loading nearby amenities…
Taxation est. · year 1
- Rental income
- $13,780
- − Mortgage interest
- −$5,321
- − Property taxes
- −$1,690
- − Insurance
- −$475
- − Repairs & maintenance
- −$1,102
- − Management
- −$1,102
- − Depreciation
- −$2,764
- Taxable income
- $1,325
- Est. tax owed @ 24.0%
- −$318
- After-tax cash flow
- $2,425/yr
For passive investors: Depreciation is non-cash, so a rental often shows a tax loss while cash-flowing — sheltering income. Rental losses are passive: they offset passive income freely, and up to $25,000/yr can offset ordinary (W-2) income if you actively participate and your MAGI is under $100k (phasing out to $0 by $150k); unused losses carry forward. On sale, claimed depreciation is recaptured at up to 25%, and gains may owe capital-gains tax (a 1031 exchange can defer both). Figures are a year-1 estimate at your 24.0% rate — not tax advice; consult a CPA.
Schools (NCES district)
- District
- Beaumont ISD
- NCES district ID
- 4809670
- Math proficiency
- 14% ▼ -13.00%
- Reading proficiency
- 22% ▼ -7.00%
- Median HH income
- $41,683
- Composite
- 15.43/100
- National rank
- #9316
- State rank
- #789 of 826 in TX
Livability — Beaumont
- Score
- 64/100
- State rank
- #739
- US rank
- #13710
Category grades
Schools grade is shown separately in the Schools card above.
Census & demographics
- Census place
- Beaumont, TX
- County
- Jefferson County · 203,592 people
- City population
- 125,901
- Metro
- Beaumont-Port Arthur, TX
- Population (ZIP)
- 11,004
- Household income
- $31,803
- Rent vs Own
- Severe rent burden
- 657.0
Population outlook (Jefferson County) Hauer SSP2
- Today (2025)
- 259,015 people
- By 2030
- 260,685 · +0.6%
- By 2040
- 263,309 · +1.7%
- By 2050
- 265,237 · +2.4%
- By 2075
- 270,193 · +4.3%
- By 2100
- 255,628 · -1.3%
Race, ethnicity, and origin ACS 2023
- Neighborhood character
- Majority Black (60%)
- Race & ethnicity
- Black 60% Hispanic / Latino 31% Two or more races 7% White 5%
- Hispanic origin (detail)
- Mexican 25%
- Common ancestry
- Serbian 1%
- Foreign-born
- 13% · Canada
- Languages at home
- 70% English-only · Spanish 29% French/Haitian/Cajun 1%
Political lean MEDSL · Jefferson
- 2024 margin
- Lean R (+8.9) · D 45.1% · R 54.0%
- 2008→2024 swing
- -11.1pp toward R · 2008: 2.2pp · 2024: -8.9pp
- All cycles
- 2024: R+8.9 2020: R+1.6 2016: R+0.5 2012: D+1.6 2008: D+2.2
Not yet ingested
- Civics
- —
Market trends
- HPI YoY
- ▲ 5.43%
- Current HPI
- 151.9888
- Rent YoY
- —
- Metro
- Beaumont-Port Arthur, TX
- State GDP YoY
- ▲ 3.95%
- F500 in state
- 110
Industry mix (Fortune 500 HQ in TX)
| Industry | F500 HQs | Revenue |
|---|---|---|
| Energy | 16 | $1,198B |
|
||
| Technology | 5 | $198B |
|
||
| Engineering / Construction | 4 | $72B |
|
||
| Energy Services | 3 | $60B |
|
||
| Utilities | 3 | $41B |
|
||
| Healthcare | 2 | $330B |
|
||
Price history
+39.9% since first listed14 events — show timeline
- 2026-06-20 Listed $95,000 HARMLS
- 2026-06-20 Listing Removed — HARMLS
- 2026-04-08 Listed $100,000 HARMLS
- 2026-02-26 Rental Removed $1,100 HARMLS
- 2025-11-30 Listed for Rent $1,100 HARMLS
- 2025-11-30 Rental Removed $1,100 Avail
- 2025-11-26 Listed for Rent $1,100 Avail
- 2025-10-19 Rental Removed $1,100 Avail
- 2025-09-21 Listed for Rent $1,100 Avail
- 2023-03-01 Sold (Public Records) — Public Records
- 2018-06-06 Sold (Public Records) — Public Records
- 2018-06-01 Sold (MLS) — BBOR
- 2018-05-23 Listed $67,900 BBOR
- 2017-12-21 Sold (Public Records) — Public Records
Property tax history
+5.3%/yrLatest (2025): $1,690 · +6.0% YoY. Source: county tax records.
Cash-flow waterfall
monthlySold comps — $/sqft
last 12 mo · ≤1 miLoading sold comps…