944 Possum Trot Rd · Hindman, KY
Flood risk No data
- FEMA flood zone
- —
- Chance of flooding over 30 yrs
- —
- Est. flood insurance / yr
- —
Fire risk 7/10 · Major
- Est. fire insurance / yr
- $839 – $1,559
Heat risk 3/10 · Minor
- Hot days now (above 98°F)
- 7 days/yr
- Hot days in 30 yrs
- 20 days/yr
Wind risk 2/10 · Minimal
- Chance of severe wind over 30 yrs
- 1.0%
Air-quality risk 1/10 · Minimal
- Unhealthy air days now
- 0 days/yr
- Unhealthy air days in 30 yrs
- 0 days/yr
Risk factors via First Street. Map © Google.
Why this score? — see what drove the D grade
The composite is a weighted blend of 9 inputs, each scored 0–100. Each bar is that input's sub-score; the figure is the points it added to the 100-point composite (weight × sub-score).
- Cash flow +13.3/30.0
- ARV discount +7.5/15.0
- DSCR +4.0/10.0
- 1% rule +3.8/10.0
- Livability +2.6/5.0
- Rent growth +2.5/5.0
- Schools +2.5/10.0
- Condition / age +2.2/5.0
- Appreciation +1.7/10.0
$125,900
🖨 Deal sheet 📄 Offer letter ✓ Due diligence
Listing remarks MLS
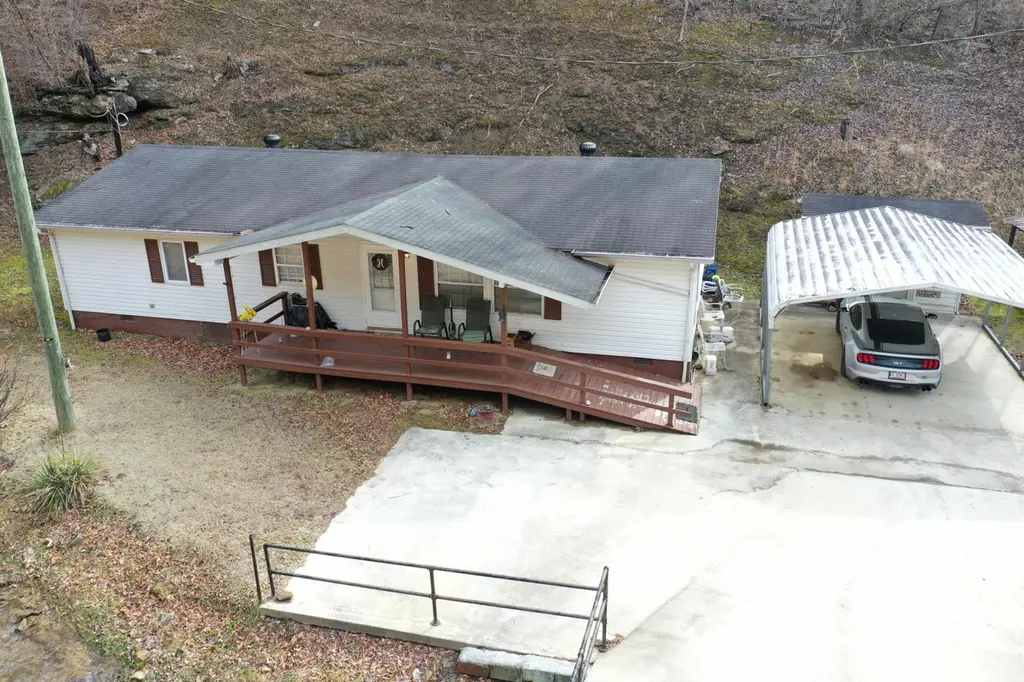
75 acres with a well maintained 3 Bedroom 2 Bath manufactured home offering comfortable one-level living. This home features a wheelchair accessible ramp entrance and an updated handicap accessible shower for added convenience and ease of use. Spacious living area, functional kitchen layout, and a split bed room floor plan provide both comfort and privacy. Ideal for those seeking accessibility without sacrificing space.
Key facts
- 75 acre lot
- 2 parking spots
- Built 1978
Tags
Neighborhood map
What this means for you Summary
Snapshot
- This is a 3-bed/2.0-bath single-family listed at $126k. Condition is rated fair.
Deal economics
- At list price, monthly cash flow is $1 ($14/yr) — positive.
- The deal already cash-flows at list — no discount required.
- To meet the 1% rule (rent ≥ 1% of price), the offer needs to be $110k (12.4% below list).
- Recommended offer: $110k (12.4% below list) — sets the bar for 1% rule.
Location & tenants
- Location reads 52/100 on livability (#492 in KY) — a working-class tenant base; expect higher turnover. Strengths: cost of living A+; Watch: housing D, schools F, amenities F.
- Knott County (rural): math 23% / reading 39% proficiency, ranked #109 of 165 in KY (top 66%) — families likely to look elsewhere, expect single-tenant / working-renter base with shorter leases; 62% free/reduced lunch — lower-income household profile, screen leases tightly.
- Market conditions: 6 active listings in the ZIP.
Forward outlook
- Local home prices are declining (-3.0%/yr); year-one equity from $870 of loan paydown is wiped out by about $4k of value loss. Plan a longer hold.
- Knott County population projected at -28% by 2050 — secular population decline; favor cash flow + early exit over multi-decade hold.
Negotiation context
- It's been on market 90 days — a 6% lower offer ($118k) is reasonable based on typical stale-listing flexibility.
- 2 sale attempts with the ask held roughly flat each time — persistent listings suggest the price (not the market) is what's stuck; bring a comps-based counter.
Risks & watch-outs
- Climate carrying-cost: major wildfire risk — expect insurance premiums to compound above CPI over the hold.
Questions for the listing agent
- It's been on market 90 days. Have you received any prior offers? Is the seller open to a 12% concession, seller financing, or rate buy-down credit?
- Have any recent inspections been done? Can we get a copy of the seller's disclosures and any deferred-maintenance estimates?
- Built in 1978 — when were the roof, HVAC, electrical panel, plumbing, and water heater last replaced?
- Why hasn't it sold? Are there any deal-killer items the seller is aware of (foundation, flood, title, zoning, code violations)?
- Is there a deadline driving the sale (1031 exchange, divorce, estate, relocation)? That informs how much negotiation room exists.
- Schools are F-rated, which usually means shorter tenancies and higher turnover. Who's the typical renter profile here, and what's been the actual vacancy rate?
- The area grade is low — what's the realistic commute time and amenity access for the typical tenant pool here? Any planned neighborhood developments (good or bad) we should know about?
- What's the average days-on-market for RENTAL listings here right now (not sales)? A rising rental-DOM trend means longer vacancies and softer asking-rent achievability than the comps imply.
- What's the recent tenant-quality profile in this submarket — average credit score on applications, eviction rate, late-payment / NSF rate, and stable-employment percentage? A property-management company in the area should have these aggregated.
- How much new for-sale + rental construction is in the pipeline within 1–3 miles? Heavy new supply typically softens prices + rents 12–24 months out; constrained supply supports both.
Investment metrics
- 1% rule
- 0.88% ✗
- Cap rate
- 6.30%
- Cash-on-cash
- 0.04%
- DSCR
- 1.00
- GRM
- 9.5
CMA / ARV
- ARV (median comp)
- $125,900
- List price
- $125,900
- Delta
- —
- Verdict
- FAIR
- Comps
- 1 within 2.0 mi
Show comp detail 1 sale within ~0.75 mi
| Address | Dist | Beds/Ba | Sqft | Sold | Price | $/sf | Match |
|---|---|---|---|---|---|---|---|
| 944 Possum Trot Rd | 0.00mi | 3/2.0 | 1,440 (0%) | 0mo | $125,900 | $87 | 100 |
Match score weights: distance 35% · size 25% · config 20% · recency 20%. Top-matched comps best support the ARV.
Projected returns pro-forma
-3.0% appreciation · 3.0% rent growth · sell at horizon
- IRR
- -16.2%
- Equity multiple
- 0.42×
- Total profit
- $-20,311
- Equity at exit
- $18,772
- IRR
- -7.9%
- Equity multiple
- 0.50×
- Total profit
- $-17,524
- Equity at exit
- $10,886
Cash invested: $35,252 (down + closing). Projections, not guarantees.
Landlord ↔ Tenant lean methodology
- Overall (STATE)
- 83 Strongly Landlord-Friendly
- State Kentucky
- 83 Strongly Landlord-Friendly · R+16
- County
- — inherits STATE
- City
- — inherits STATE
ZIP-level market 41822
- Home prices YoY
- -4.0%
- Active inventory
- 6
- Price-to-rent
- 9.5×
Monthly cashflow live
- Estimated rent
- $1,103 medium interval (Pro) →
- Mortgage (P&I)
- −$660
- Tax est. 1.5%
- −$157 /mo · $1,888/yr
- Insurance
- −$52
- HOA
- −$0
- Vacancy / Maint / Mgmt
- −$232
- Net cashflow
- $1
Break-even live
UW: 25.0% down · 7.5% · 30yr · 1.5% tax · 5.0% vac · 8.0% maint · 8.0% mgmt
Financing live
Cash to close
- Down payment
- $31,475
- Closing costs
- $3,777
- Reserves months
- —
- Total cash needed
- —
Loan-product check · same deal, 3 products live
Conventional
25% down · 7.5% · 30yr
- Down + closing
- —
- Monthly P&I
- —
- Monthly cashflow
- —
- DSCR
- —
- Eligible?
- —
Personal DTI + credit; lowest rate.
DSCR
20% down · 8.5% · 30yr
- Down + closing
- —
- Monthly P&I
- —
- Monthly cashflow
- —
- DSCR
- —
- Eligible?
- —
No personal income docs; deal must DSCR.
Hard money
10% down · 12.0% · 12mo
- Down + closing
- —
- Monthly P&I
- —
- Monthly cashflow
- —
- DSCR
- —
- Eligible?
- —
Short-term bridge; refi at stabilization.
Listing history 3 events
-
2026-05-14status Active 423-char remark
Show marketing remark (423 chars)
75 acres with a well maintained 3 Bedroom 2 Bath manufactured home offering comfortable one-level living. This home features a wheelchair accessible ramp entrance and an updated handicap accessible shower for added convenience and ease of use. Spacious living area, functional kitchen layout, and a split bed room floor plan provide both comfort and privacy. Ideal for those seeking accessibility without sacrificing space.
-
2026-03-12historical Contingent 423-char remark
Show marketing remark (423 chars)
75 acres with a well maintained 3 Bedroom 2 Bath manufactured home offering comfortable one-level living. This home features a wheelchair accessible ramp entrance and an updated handicap accessible shower for added convenience and ease of use. Spacious living area, functional kitchen layout, and a split bed room floor plan provide both comfort and privacy. Ideal for those seeking accessibility without sacrificing space.
-
2026-01-30$125,900 Active 423-char remark
Show marketing remark (423 chars)
75 acres with a well maintained 3 Bedroom 2 Bath manufactured home offering comfortable one-level living. This home features a wheelchair accessible ramp entrance and an updated handicap accessible shower for added convenience and ease of use. Spacious living area, functional kitchen layout, and a split bed room floor plan provide both comfort and privacy. Ideal for those seeking accessibility without sacrificing space.
ⓘ Source: listings_history table (triggers on properties + properties_extension) + one-shot
backfill from property_details.listing_events for pre-trigger history.
Climate risk First Street
- Wildfire 7/10 Severe
- Heat 3/10 Moderate 7 d/yr ≥98°F today · 20 d/yr by 30 yrs out
- Wind 2/10 Low 100% chance of damaging wind over 30 yrs
- Air quality 1/10 Low 0 unhealthy d/yr today · 0 by 30 yrs out
Nearby sold comps map
Loading sold comps map…
Walkable amenities ~0.75 mi
Loading nearby amenities…
Taxation est. · year 1
- Rental income
- $13,234
- − Mortgage interest
- −$7,052
- − Property taxes
- −$1,888
- − Insurance
- −$630
- − Repairs & maintenance
- −$1,059
- − Management
- −$1,059
- − Depreciation
- −$3,663
- Taxable loss
- −$2,117
- Est. tax savings @ 24.0%
- +$508
- After-tax cash flow
- $522/yr
For passive investors: Depreciation is non-cash, so a rental often shows a tax loss while cash-flowing — sheltering income. Rental losses are passive: they offset passive income freely, and up to $25,000/yr can offset ordinary (W-2) income if you actively participate and your MAGI is under $100k (phasing out to $0 by $150k); unused losses carry forward. On sale, claimed depreciation is recaptured at up to 25%, and gains may owe capital-gains tax (a 1031 exchange can defer both). Figures are a year-1 estimate at your 24.0% rate — not tax advice; consult a CPA.
Condition & rehab AI · 13 photos
This single-family home requires moderate repairs and maintenance to improve its condition and value. Key areas for improvement include the roof, exterior siding, and interior walls. Upgrades to these areas would significantly enhance the home's curb appeal and overall value.
Repairs flagged
- Major roof — gray asphalt shingles
- Major exterior siding — white siding with discoloration
- Minor interior walls — light-colored walls with some wear
Value-add opportunities
- Both paint exterior siding — enhances curb appeal and value
- Both repair roof — improves structural integrity and appearance
- Both replace worn flooring — enhances comfort and value
- Both paint interior walls — refreshes interior and enhances value
- Both replace worn kitchen countertops — improves functionality and value
- Both repair/replace worn kitchen cabinets — enhances functionality and value
- Both repair/replace worn bathroom fixtures — improves functionality and value
Renovation cost estimate screening
| Repair item | Severity | Est. cost |
|---|---|---|
| roof · gray asphalt shingles | Major | $15,000–50,000 |
| exterior siding · white siding with discoloration | Major | $15,000–50,000 |
| interior walls · light-colored walls with some wear | Minor | $500–3,000 |
| Total estimated repair cost · 3 items | $30,500–103,000 |
Value-add ROI direction
- Both paint exterior siding — enhances curb appeal and value ↑
- Both repair roof — improves structural integrity and appearance ↑
- Both replace worn flooring — enhances comfort and value ↑
- Both paint interior walls — refreshes interior and enhances value ↑
- Both replace worn kitchen countertops — improves functionality and value ↑
- Both repair/replace worn kitchen cabinets — enhances functionality and value ↑
- Both repair/replace worn bathroom fixtures — improves functionality and value ↑
ⓘ Cost ranges are severity-bucket heuristics (US national rule-of-thumb). Get contractor quotes + a written scope before underwriting a rehab budget.
Schools (NCES district)
- District
- Knott County
- NCES district ID
- 2103120
- Math proficiency
- 23% ▼ -15.00%
- Reading proficiency
- 39% ▼ -16.00%
- Median HH income
- $30,599
- Composite
- 25.12/100
- National rank
- #7525
- State rank
- #109 of 165 in KY
Livability — Hindman
- Score
- 52/100
- State rank
- #492
- US rank
- #24861
Category grades
Schools grade is shown separately in the Schools card above.
Census & demographics
- Population (ZIP)
- 1,979
Population outlook (Knott County) Hauer SSP2
- Today (2025)
- 14,310 people
- By 2030
- 13,485 · -5.8%
- By 2040
- 11,794 · -17.6%
- By 2050
- 10,334 · -27.8%
- By 2075
- 8,098 · -43.4%
- By 2100
- 6,847 · -52.2%
Race, ethnicity, and origin ACS 2023
- Neighborhood character
- Predominantly White (97%)
- Race & ethnicity
- White 97% Black 1%
- Foreign-born
- 1% · Canada
- Languages at home
- 98% English-only · French/Haitian/Cajun 1%
Political lean MEDSL · Knott
- 2024 margin
- Solid R (+59.2) · D 19.7% · R 78.8% · Other 1.5%
- 2008→2024 swing
- -51.3pp toward R · 2008: -7.9pp · 2024: -59.2pp
- All cycles
- 2024: R+59.2 2020: R+53.9 2016: R+54.1 2012: R+47.6 2008: R+7.9
Not yet ingested
- Civics
- —
Market trends
- HPI YoY
- ▼ -6.67%
- Current HPI
- 160.7772
- Rent YoY
- —
- Metro
- —
- State GDP YoY
- ▲ 1.81%
- F500 in state
- 4
Industry mix (Fortune 500 HQ in KY)
| Industry | F500 HQs | Revenue |
|---|---|---|
| Healthcare | 1 | $118B |
|
||
| Food / Beverage | 1 | $7B |
|
||
Price history
3 events — show timeline
- 2026-05-14 Relisted — ImagineMLS
- 2026-03-12 Contingent — ImagineMLS
- 2026-01-30 Listed $125,900 ImagineMLS
Cash-flow waterfall
monthlySold comps — $/sqft
last 12 mo · ≤1 miLoading sold comps…