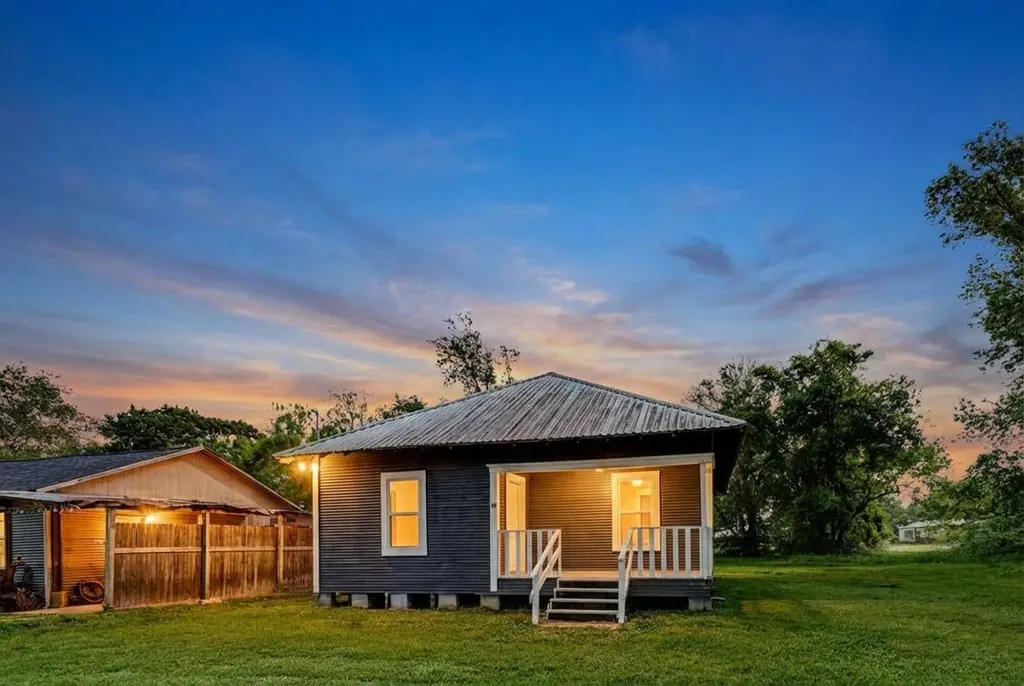
215 Clarence St · Dayton, TX
Flood risk 3/10 · Minor
- FEMA flood zone
- X (unshaded)
- Chance of flooding over 30 yrs
- 0.2%
- Est. flood insurance / yr
- $507 – $1,088
Fire risk 4/10 · Minor
- Est. fire insurance / yr
- $1,222 – $2,270
Heat risk 9/10 · Severe
- Hot days now (above 112°F)
- 7 days/yr
- Hot days in 30 yrs
- 25 days/yr
Wind risk 9/10 · Severe
- Chance of severe wind over 30 yrs
- 99.0%
Air-quality risk 2/10 · Minimal
- Unhealthy air days now
- 1 days/yr
- Unhealthy air days in 30 yrs
- 2 days/yr
Risk factors via First Street. Map © Google.
Why this score? — see what drove the C- grade
The composite is a weighted blend of 9 inputs, each scored 0–100. Each bar is that input's sub-score; the figure is the points it added to the 100-point composite (weight × sub-score).
- Cash flow +15.2/30.0
- ARV discount +15.0/15.0
- DSCR +4.6/10.0
- 1% rule +4.4/10.0
- Schools +3.0/10.0
- Livability +3.0/5.0
- Rent growth +2.5/5.0
- Condition / age +2.5/5.0
- Appreciation +0.0/10.0
$165,000
🖨 Deal sheet (PDF) 📄 Offer letter ✓ Due diligence
Listing remarks
Beautifully updated and full of character, this charming single-family home offers 2 bedrooms and 1 full bath on an impressive oversized 21,824 sq ft lot. A quaint covered front porch welcomes you inside, where soaring 10-foot ceilings and a stylish blend of modern gray tones create an inviting atmosphere. The open-concept layout seamlessly connects the living, dining, and kitchen areas, making it perfect for both everyday living and entertaining. The kitchen is thoughtfully designed with granite countertops and a convenient breakfast bar, ideal for casual dining or hosting guests. Generous outdoor space provides endless opportunities for gatherings, gardening, or future expansion. Blending
Key facts
- Covered front porch
- Outdoor space
- Granite countertops
Tags
Property features AI
Finance
- Other: Has additional parcels
- Financial info: Lease not considered
Exterior
- Parking: No parking
- Security: Smoke detector(s)
- Utilities: Public water; Public sewer
- Home design: Residential property; Single-story (first-floor living); Built in 1965; Facing information not provided
- Construction: Wood siding; Block foundation; Metal roof
- Exterior features: Deck; Porch; Patio; Private yard; Subdivision lot
Interior
- Kitchen: Electric oven; Electric range
- Bedrooms: Primary bedroom on the first floor (15 x 11); Additional bedroom on the first floor (14 x 12)
- Flooring: Vinyl
- Bathrooms: 1 full bathroom
- Heating & cooling: Heating: Window unit; Cooling: Window unit(s)
- Interior features: Window treatments; Ceiling fan(s); Window coverings
- Laundry & utility: Washer hookup; Electric dryer hookup
Neighborhood map
What this means for you Summary
Snapshot
- This is a 2-bed/1.0-bath single-family listed at $165k.
Deal economics
- At list price, monthly cash flow is $56 ($673/yr) — positive.
- The deal already cash-flows at list — no discount required.
- To meet the 1% rule (rent ≥ 1% of price), the offer needs to be $155k (6.1% below list).
- Recommended offer: $155k (6.1% below list) — sets the bar for 1% rule.
- Cap rate 6.7% vs local median 3.2% in Dayton — top-decile yield for the area; either an underpriced asset or a hidden risk that comps aren't pricing in. Stress-test before assuming the spread holds.
Location & tenants
- Location reads 60/100 on livability (#1,066 in TX) — a middle-class / working-renter tenant base. Strengths: cost of living A+, housing A+, crime B+; Watch: amenities F, commute F, health & safety F.
- Dayton ISD (town): math 34% / reading 35% proficiency, ranked #512 of 826 in TX (top 62%) — families likely to look elsewhere, expect single-tenant / working-renter base with shorter leases.
- Zoned schools: Kimmie M Brown El (math 26% / reading 25%, grade F, #2,982 of 4,322 statewide, top 70%, 845 students, 82% FRL); Wilson J H (math 32% / reading 35%, grade F, #911 of 1,662 statewide, top 56%, 1,396 students, 74% FRL); Dayton H S (math 45% / reading 45%, grade D-, #643 of 1,632 statewide, top 40%, 1,633 students, 66% FRL) — zoned schools average 74% FRL vs 54% district-wide (20 pts higher); higher-poverty schools than district average — tighter screening recommended.
- Market conditions: 1233 active listings in the ZIP; 3 comparable units currently listed for rent nearby; rentals leasing fast (median 0d on market — plan ~1-2 weeks tenant-placement turnaround); solid renter incomes; 1,321 units permitted in Liberty County in 2024 (0 in 5+ unit buildings).
Forward outlook
- Local home prices are declining (-3.0%/yr); year-one equity from $1k of loan paydown is wiped out by about $5k of value loss. Plan a longer hold.
- Liberty County population projected at +24% by 2050 — long-run rental-demand tailwind backs the buy-and-hold thesis.
Negotiation context
- It's been on market 29 days — a 2% lower offer ($163k) is reasonable based on typical stale-listing flexibility.
- 2 sale attempts since 4y ago with the ask held roughly flat each time — persistent listings suggest the price (not the market) is what's stuck; bring a comps-based counter.
Risks & watch-outs
- Climate carrying-cost: severe wind risk, 99% chance of damaging wind over 30y; extreme-heat days projected 7→25/yr by 2055 (HVAC capex compounding) — expect insurance premiums to compound above CPI over the hold.
Questions for the listing agent
- Built in 1965 — when were the roof, HVAC, electrical panel, plumbing, and water heater last replaced?
- Is there a deadline driving the sale (1031 exchange, divorce, estate, relocation)? That informs how much negotiation room exists.
- Schools are D-rated, which usually means shorter tenancies and higher turnover. Who's the typical renter profile here, and what's been the actual vacancy rate?
- What's the average days-on-market for RENTAL listings here right now (not sales)? A rising rental-DOM trend means longer vacancies and softer asking-rent achievability than the comps imply.
- What's the recent tenant-quality profile in this submarket — average credit score on applications, eviction rate, late-payment / NSF rate, and stable-employment percentage? A property-management company in the area should have these aggregated.
- How much new for-sale + rental construction is in the pipeline within 1–3 miles? Heavy new supply typically softens prices + rents 12–24 months out; constrained supply supports both.
Investment metrics
- 1% rule
- 0.94% ✗
- Cap rate
- 6.70%
- Cash-on-cash
- 1.46%
- DSCR
- 1.06
- GRM
- 8.9
CMA / ARV
- ARV (on-the-fly)
- $248,346
- Comps found
- 2
Show comp detail 2 sales within ~0.75 mi
| Address | Dist | Beds/Ba | Sqft | Sold | Price | $/sf | Match |
|---|---|---|---|---|---|---|---|
| 212 S Winfree St | 0.24mi | 2/1.0 | 912 (-11%) | 18mo | $155,000 | $170 | 56 |
| 105 W Barrow St | 0.42mi | 2/1.5 | 1,154 (+13%) | 14mo | $280,000 | $243 | 45 |
Match score weights: distance 35% · size 25% · config 20% · recency 20%. Top-matched comps best support the ARV.
Projected returns pro-forma
-3.0% appreciation · 3.0% rent growth · sell at horizon
- IRR
- -13.9%
- Equity multiple
- 0.50×
- Total profit
- $-23,123
- Equity at exit
- $24,602
- IRR
- -5.1%
- Equity multiple
- 0.67×
- Total profit
- $-15,369
- Equity at exit
- $14,266
Cash invested: $46,200 (down + closing). Projections, not guarantees.
Landlord ↔ Tenant lean methodology
- Overall (STATE)
- 87 Strongly Landlord-Friendly
- State Texas
- 87 Strongly Landlord-Friendly · R+5
- County
- — inherits STATE
- City
- — inherits STATE
ZIP-level market 77535
- Home prices YoY
- -24.8%
- Active inventory
- 1233
- Price-to-rent
- 8.9×
Monthly cashflow live
- Estimated rent
- $1,550 medium interval (Pro) →
- Mortgage (P&I)
- −$865
- Tax from tax record
- −$234 /mo · $2,810/yr
- Insurance
- −$69
- HOA
- −$0
- Vacancy / Maint / Mgmt
- −$325
- Net cashflow
- $56
Break-even live
Sensitivity live
| Price | -10% $150 | -5% $103 | +0% $56 | +5% $9 | +10% $-37 |
|---|---|---|---|---|---|
| Rent | -10% $-66 | -5% $-5 | +0% $56 | +5% $117 | +10% $179 |
| Rate | -1.0pp $139 | -0.5pp $98 | base $56 | +0.5pp $13 | +1.0pp $-30 |
UW: 25.0% down · 7.5% · 30yr · 1.5% tax · 5.0% vac · 8.0% maint · 8.0% mgmt
Financing live
Cash to close
- Down payment
- $41,250
- Closing costs
- $4,950
- Reserves months
- —
- Total cash needed
- —
Loan-product check · same deal, 3 products live
Conventional
25% down · 7.5% · 30yr
- Down + closing
- —
- Monthly P&I
- —
- Monthly cashflow
- —
- DSCR
- —
- Eligible?
- —
Personal DTI + credit; lowest rate.
DSCR
20% down · 8.5% · 30yr
- Down + closing
- —
- Monthly P&I
- —
- Monthly cashflow
- —
- DSCR
- —
- Eligible?
- —
No personal income docs; deal must DSCR.
Hard money
10% down · 12.0% · 12mo
- Down + closing
- —
- Monthly P&I
- —
- Monthly cashflow
- —
- DSCR
- —
- Eligible?
- —
Short-term bridge; refi at stabilization.
Rent comps 3 comps
| Address | Beds | Baths | Sqft | Rent | $/sqft | DOM | Units | Dist |
|---|---|---|---|---|---|---|---|---|
| 800 E Houston St Dayton, TX | 3.0 | 1.0 | 1136 | $1,775 | $1.56 | 0d | 1 | 0.16mi |
| 704 E Waring St Dayton, TX | 1.0–2.0 | 1.0–2.0 | 798 | $1,200 | $1.50 | 0d | 16 | 0.77mi |
| 1457 W Clayton St Dayton, TX | 2.0 | 2.0 | 946 | $1,099 | $1.16 | 26d | 1 | 1.38mi |
Listing history 5 events
-
2026-05-15status Pending
-
2026-05-06status Pending
-
2026-04-15$165,000 Active
-
2024-09-23historical
-
2022-11-27$225,000 Active
ⓘ Source: listings_history table (triggers on properties + properties_extension) + one-shot
backfill from property_details.listing_events for pre-trigger history.
Tax reassessment forecast TX · Resets to sale price
- Current annual tax
- $2,810 · $234/mo
- Projected year-2 tax
- $3,020 · $252/mo
- Expected delta
- +$210/yr (+$17/mo · 7.5%)
ⓘ Screening estimate from a state-policy table — verify with the county assessor before closing.
Climate risk First Street
- Flood 3/10 Moderate FEMA zone X (unshaded) · 20% chance over 30 yrs
- Wildfire 4/10 Moderate
- Heat 9/10 Extreme 7 d/yr ≥112°F today · 25 d/yr by 30 yrs out
- Wind 9/10 Extreme 99% chance of damaging wind over 30 yrs
- Air quality 2/10 Low 1 unhealthy d/yr today · 2 by 30 yrs out
Nearby sold comps map
Loading sold comps map…
Walkable amenities ~0.75 mi
Loading nearby amenities…
Taxation est. · year 1
- Rental income
- $18,597
- − Mortgage interest
- −$9,243
- − Property taxes
- −$2,810
- − Insurance
- −$825
- − Repairs & maintenance
- −$1,488
- − Management
- −$1,488
- − Depreciation
- −$4,800
- Taxable loss
- −$2,056
- Est. tax savings @ 24.0%
- +$493
- After-tax cash flow
- $1,167/yr
For passive investors: Depreciation is non-cash, so a rental often shows a tax loss while cash-flowing — sheltering income. Rental losses are passive: they offset passive income freely, and up to $25,000/yr can offset ordinary (W-2) income if you actively participate and your MAGI is under $100k (phasing out to $0 by $150k); unused losses carry forward. On sale, claimed depreciation is recaptured at up to 25%, and gains may owe capital-gains tax (a 1031 exchange can defer both). Figures are a year-1 estimate at your 24.0% rate — not tax advice; consult a CPA.
Schools (NCES district)
- District
- Dayton ISD
- NCES district ID
- 4816410
- Math proficiency
- 34% ▼ -6.00%
- Reading proficiency
- 35% ▲ 2.00%
- Median HH income
- $53,293
- Composite
- 30.25/100
- National rank
- #6287
- State rank
- #512 of 826 in TX
Livability — Dayton
- Score
- 60/100
- State rank
- #1066
- US rank
- #18940
Category grades
Schools grade is shown separately in the Schools card above.
Census & demographics
- Census place
- Dayton, TX
- County
- Liberty County · 82,189 people
- City population
- 82,189
- Metro
- Houston-The Woodlands-Sugar Land, TX
- Population (ZIP)
- 39,504
- Household income
- $84,497
- Rent vs Own
- Severe rent burden
- 321.0
Population outlook (Liberty County) Hauer SSP2
- Today (2025)
- 87,956 people
- By 2030
- 92,161 · +4.8%
- By 2040
- 100,784 · +14.6%
- By 2050
- 109,471 · +24.5%
- By 2075
- 133,470 · +51.7%
- By 2100
- 147,372 · +67.6%
Race, ethnicity, and origin ACS 2023
- Neighborhood character
- Majority White (64%)
- Race & ethnicity
- White 64% Hispanic / Latino 26% Two or more races 12% Black 7%
- Hispanic origin (detail)
- Mexican 23%
- Common ancestry
- Lithuanian 3% Slovak 2% Serbian 1%
- Foreign-born
- 7% · Canada
- Languages at home
- 79% English-only · Spanish 19% Russian/Polish/Slavic 1%
Political lean MEDSL · Liberty
- 2024 margin
- Solid R (+61.6) · D 19.0% · R 80.6%
- 2008→2024 swing
- -17.9pp toward R · 2008: -43.7pp · 2024: -61.6pp
- All cycles
- 2024: R+61.6 2020: R+59.7 2016: R+58.0 2012: R+53.3 2008: R+43.7
Not yet ingested
- Civics
- —
Market trends
- HPI YoY
- ▼ -75.61%
- Current HPI
- 229.0925
- Rent YoY
- —
- Metro
- Houston-The Woodlands-Sugar Land, TX
- State GDP YoY
- ▲ 3.95%
- F500 in state
- 110
Industry mix (Fortune 500 HQ in TX)
| Industry | F500 HQs | Revenue |
|---|---|---|
| Energy | 16 | $1,198B |
|
||
| Technology | 5 | $198B |
|
||
| Engineering / Construction | 4 | $72B |
|
||
| Energy Services | 3 | $60B |
|
||
| Utilities | 3 | $41B |
|
||
| Healthcare | 2 | $330B |
|
||
Price history
-26.7% since first listed5 events — show timeline
- 2026-05-15 Pending — HARMLS
- 2026-05-06 Pending — HARMLS
- 2026-04-15 Listed $165,000 HARMLS
- 2024-09-23 Listing Removed — HARMLS
- 2022-11-27 Listed $225,000 HARMLS
Property tax history
+10.6%/yrLatest (2025): $2,810 · +1.1% YoY. Source: county tax records.
Cash-flow waterfall
monthlySold comps — $/sqft
last 12 mo · ≤1 miLoading sold comps…