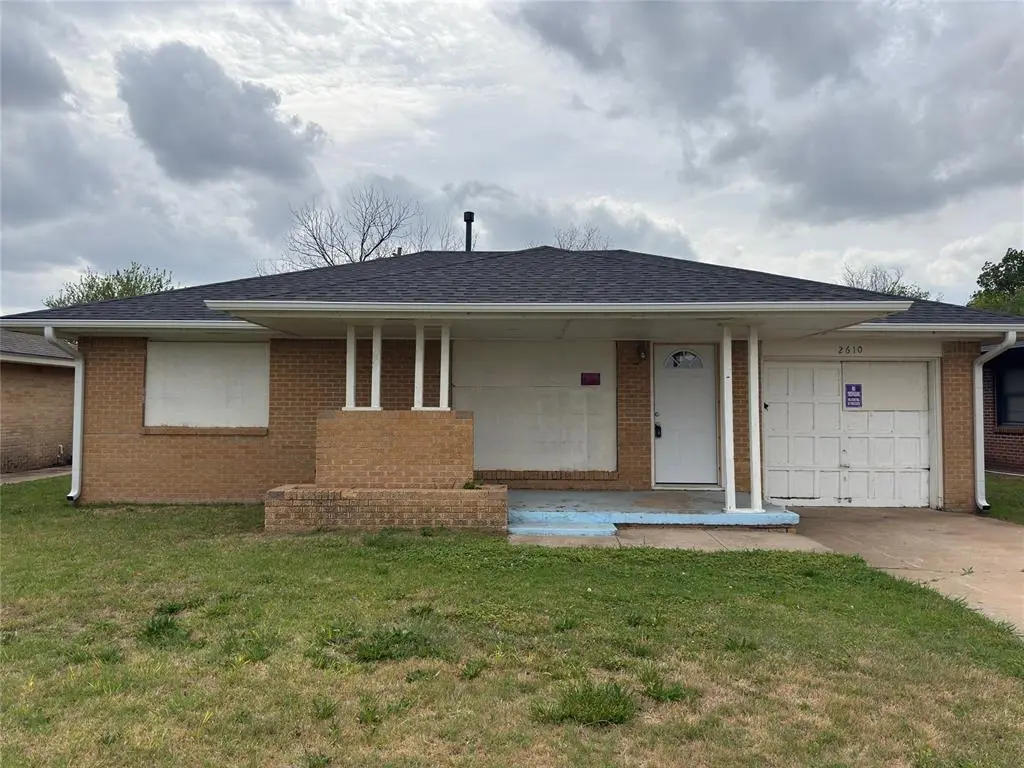
2610 NW Wesley Ave · Lawton, OK
Flood risk 1/10 · Minimal
- FEMA flood zone
- X (unshaded)
- Chance of flooding over 30 yrs
- 0.0%
- Est. flood insurance / yr
- $507 – $1,088
Fire risk 1/10 · Minimal
- Est. fire insurance / yr
- $2,463 – $4,575
Heat risk 7/10 · Major
- Hot days now (above 108°F)
- 7 days/yr
- Hot days in 30 yrs
- 19 days/yr
Wind risk 3/10 · Minor
- Chance of severe wind over 30 yrs
- 5.0%
Air-quality risk 1/10 · Minimal
- Unhealthy air days now
- 0 days/yr
- Unhealthy air days in 30 yrs
- 0 days/yr
Risk factors via First Street. Map © Google.
Why this score? — see what drove the C+ grade
The composite is a weighted blend of 9 inputs, each scored 0–100. Each bar is that input's sub-score; the figure is the points it added to the 100-point composite (weight × sub-score).
- Cash flow +30.0/30.0
- 1% rule +10.0/10.0
- DSCR +10.0/10.0
- Rent growth +3.8/5.0
- Livability +3.2/5.0
- Condition / age +2.5/5.0
- Schools +2.0/10.0
- ARV discount +0.0/15.0
- Appreciation +0.0/10.0
$67,900
🖨 Deal sheet 📄 Offer letter ✓ Due diligence
Listing remarks
2610 NW Wesley Ave, Lawton, OK 73505 This property is a great opportunity for an investor or a handy home buyer. The home needs some cosmetic updates, including paint, flooring, and some window replacements, giving you the chance to add your own style and value. A major improvement was completed in November 2024, with the roof and guttering. With some work, this home can be transformed into a comfortable space tailored to your needs.
Key facts
- 7,083 sq ft lot
- Garage
- Built 1952
Property features AI
Finance
- Other: Vacant and available; No home warranty
- Financial info: Listing offered As-is; acceptable financing includes Cash and Conventional; Not assumable
- HOA & community: No mandatory association dues
Exterior
- Parking: 1-car garage
- Home design: Single-family residence; One story; Facing east; Existing property
- Construction: Brick construction; Shingle roof (replaced/updated 2023); Slab foundation; Built status: existing
- Exterior features: Covered patio; Interior lot
Interior
- Bedrooms: 3 bedrooms (all on one level)
- Bathrooms: 1 full bathroom
- Interior features: One living area; No fireplace
Neighborhood map
What this means for you Summary
Snapshot
- This is a 2-bed/1.0-bath single-family listed at $68k.
Deal economics
- At list price, monthly cash flow is $396 ($5k/yr) — positive.
- The deal already cash-flows at list — no discount required.
- Meets the 1% rule at list price ($1k rent vs $68k).
- Recommended offer: $66k (3.0% below list) — sets the bar for market timing.
- Cap rate 13.3% vs local median 6.1% in Lawton — top-decile yield for the area; either an underpriced asset or a hidden risk that comps aren't pricing in. Stress-test before assuming the spread holds.
Location & tenants
- Location reads 63/100 on livability (#206 in OK) — a middle-class / working-renter tenant base. Strengths: cost of living A+, housing A+; Watch: employment D, crime F, commute F.
- Lawton (urban): math 20% / reading 26% proficiency, ranked #137 of 270 in OK (top 51%) — low school quality limits family demand, transient renter base, plan for 1-2y turnover.
- Zoned schools: Lawton Hs (math 16% / reading 21%, grade F, #302 of 447 statewide, top 68%, 1,417 students, 0% FRL) — zoned schools average 0% FRL vs 54% district-wide (54 pts lower); this property's tenant base skews higher-income than the district average.
- Market conditions: Rents rising fast (+5.1%/yr); 398 active listings in the ZIP; 133 units permitted in Comanche County in 2024 (0 in 5+ unit buildings).
Forward outlook
- Local home prices are declining (-3.0%/yr); year-one equity from $469 of loan paydown is wiped out by about $2k of value loss. Plan a longer hold.
- Comanche County population projected to shrink 3% by 2050 — rents likely to lag national; underwrite the cash flow, not the appreciation.
- At projected returns (-3.0% appreciation + 5.1% rent growth), your $19k cash investment doubles in ~5 years — after that, you're playing with house money.
Negotiation context
- It's been on market 34 days — a 3% lower offer ($66k) is reasonable based on typical stale-listing flexibility.
- 2 sale attempts with the ask held roughly flat each time — persistent listings suggest the price (not the market) is what's stuck; bring a comps-based counter.
- Current owner paid $44k; list at $68k implies a 54% gain — meaningful room to come down on a strong offer.
Risks & watch-outs
- Watch-outs: built in 1952 — expect roof / HVAC / electrical / plumbing capex.
- Climate carrying-cost: extreme-heat days projected 7→19/yr by 2055 (HVAC capex compounding) — expect insurance premiums to compound above CPI over the hold.
Questions for the listing agent
- It's been on market 34 days. Have you received any prior offers? Is the seller open to a 3% concession, seller financing, or rate buy-down credit?
- Built in 1952 — when were the roof, HVAC, electrical panel, plumbing, and water heater last replaced?
- Is there a deadline driving the sale (1031 exchange, divorce, estate, relocation)? That informs how much negotiation room exists.
- Schools are D-rated, which usually means shorter tenancies and higher turnover. Who's the typical renter profile here, and what's been the actual vacancy rate?
- Crime grade is F in this area — have there been break-ins, vandalism, or insurance claims at this property in the last 3 years? What carrier currently insures it and at what premium?
- What's the average days-on-market for RENTAL listings here right now (not sales)? A rising rental-DOM trend means longer vacancies and softer asking-rent achievability than the comps imply.
- What's the recent tenant-quality profile in this submarket — average credit score on applications, eviction rate, late-payment / NSF rate, and stable-employment percentage? A property-management company in the area should have these aggregated.
- How much new for-sale + rental construction is in the pipeline within 1–3 miles? Heavy new supply typically softens prices + rents 12–24 months out; constrained supply supports both.
Investment metrics
- 1% rule
- 1.56% ✓
- Cap rate
- 13.30%
- Cash-on-cash
- 25.02%
- DSCR
- 2.11
- GRM
- 5.4
CMA / ARV
- ARV (on-the-fly)
- $55,332
- Comps found
- 12
Show comp detail 12 sales within ~0.75 mi
| Address | Dist | Beds/Ba | Sqft | Sold | Price | $/sf | Match |
|---|---|---|---|---|---|---|---|
| 2614 NW Bell Ave | 0.12mi | 3/1.5 (+1) | 1,000 (+5%) | 2mo | $54,500 | $55 | 78 |
| 2915 NW Euclid | 0.21mi | 3/1.0 (+1) | 1,000 (+5%) | 0mo | $131,000 | $131 | 77 |
| 701 NW 22nd St | 0.37mi | 2/1.0 | 1,000 (+5%) | 1mo | $49,200 | $49 | 74 |
| 2114 NW Bell Ave | 0.36mi | 2/1.0 | 850 (-11%) | 1mo | $49,215 | $58 | 64 |
| 46 NW 29th St | 0.25mi | 2/1.0 | 1,050 (+10%) | 16mo | $59,500 | $57 | 58 |
| 825 NW 33rd St | 0.52mi | 2/1.0 | 900 (-6%) | 14mo | $70,000 | $78 | 55 |
| 1712 NW Euclid Ave | 0.66mi | 2/2.0 | 900 (-6%) | 1mo | $61,200 | $68 | 55 |
| 1809 NW Arlington | 0.66mi | 2/1.0 | 900 (-6%) | 10mo | $85,900 | $95 | 52 |
| 2421 SW D Ave | 0.66mi | 2/1.0 | 900 (-6%) | 10mo | $25,000 | $28 | 51 |
| 1902 NW Cherry Ave | 0.57mi | 3/1.0 (+1) | 1,000 (+5%) | 12mo | $45,000 | $45 | 51 |
| 1419 NW 23rd St | 0.75mi | 3/1.0 (+1) | 1,000 (+5%) | 4mo | $19,900 | $20 | 49 |
| 1708 NW Bell Ave | 0.71mi | 2/1.0 | 1,000 (+5%) | 14mo | $75,900 | $76 | 47 |
Match score weights: distance 35% · size 25% · config 20% · recency 20%. Top-matched comps best support the ARV.
Projected returns pro-forma
-3.0% appreciation · 5.14% rent growth · sell at horizon
- IRR
- 20.8%
- Equity multiple
- 1.87×
- Total profit
- $16,561
- Equity at exit
- $10,124
- IRR
- 30.3%
- Equity multiple
- 3.99×
- Total profit
- $56,873
- Equity at exit
- $5,871
Cash invested: $19,012 (down + closing). Projections, not guarantees.
Landlord ↔ Tenant lean methodology
- Overall (STATE)
- 83 Strongly Landlord-Friendly
- State Oklahoma
- 83 Strongly Landlord-Friendly · R+20
- County
- — inherits STATE
- City
- — inherits STATE
ZIP-level market 73505
- Rents YoY
- 5.1%
- Active inventory
- 398
- Price-to-rent
- 5.4×
Monthly cashflow live
- Estimated rent
- $1,056 medium interval (Pro) →
- Mortgage (P&I)
- −$356
- Tax from tax record
- −$54 /mo · $646/yr
- Insurance
- −$28
- HOA
- −$0
- Vacancy / Maint / Mgmt
- −$222
- Net cashflow
- $396
Break-even live
UW: 25.0% down · 7.5% · 30yr · 1.5% tax · 5.0% vac · 8.0% maint · 8.0% mgmt
Financing live
Cash to close
- Down payment
- $16,975
- Closing costs
- $2,037
- Reserves months
- —
- Total cash needed
- —
Loan-product check · same deal, 3 products live
Conventional
25% down · 7.5% · 30yr
- Down + closing
- —
- Monthly P&I
- —
- Monthly cashflow
- —
- DSCR
- —
- Eligible?
- —
Personal DTI + credit; lowest rate.
DSCR
20% down · 8.5% · 30yr
- Down + closing
- —
- Monthly P&I
- —
- Monthly cashflow
- —
- DSCR
- —
- Eligible?
- —
No personal income docs; deal must DSCR.
Hard money
10% down · 12.0% · 12mo
- Down + closing
- —
- Monthly P&I
- —
- Monthly cashflow
- —
- DSCR
- —
- Eligible?
- —
Short-term bridge; refi at stabilization.
Listing history 4 events
-
2026-05-06status Pending
-
2026-04-01$67,900 Active
-
2025-01-28$75,000 Active
-
1992-10-29soldstatus $44,000
ⓘ Source: listings_history table (triggers on properties + properties_extension) + one-shot
backfill from property_details.listing_events for pre-trigger history.
Tax reassessment forecast OK · Resets to sale price
- Current annual tax
- $646 · $54/mo
- Projected year-2 tax
- $646 · $54/mo
- Expected delta
- $0/yr ($0/mo · 0.0%)
ⓘ Screening estimate from a state-policy table — verify with the county assessor before closing.
Climate risk First Street
- Flood 1/10 Low FEMA zone X (unshaded) · 0% chance over 30 yrs
- Wildfire 1/10 Low
- Heat 7/10 Severe 7 d/yr ≥108°F today · 19 d/yr by 30 yrs out
- Wind 3/10 Moderate 5% chance of damaging wind over 30 yrs
- Air quality 1/10 Low 0 unhealthy d/yr today · 0 by 30 yrs out
Nearby sold comps map
Loading sold comps map…
Walkable amenities ~0.75 mi
Loading nearby amenities…
Taxation est. · year 1
- Rental income
- $12,677
- − Mortgage interest
- −$3,803
- − Property taxes
- −$646
- − Insurance
- −$340
- − Repairs & maintenance
- −$1,014
- − Management
- −$1,014
- − Depreciation
- −$1,975
- Taxable income
- $3,884
- Est. tax owed @ 24.0%
- −$932
- After-tax cash flow
- $3,824/yr
For passive investors: Depreciation is non-cash, so a rental often shows a tax loss while cash-flowing — sheltering income. Rental losses are passive: they offset passive income freely, and up to $25,000/yr can offset ordinary (W-2) income if you actively participate and your MAGI is under $100k (phasing out to $0 by $150k); unused losses carry forward. On sale, claimed depreciation is recaptured at up to 25%, and gains may owe capital-gains tax (a 1031 exchange can defer both). Figures are a year-1 estimate at your 24.0% rate — not tax advice; consult a CPA.
Schools (NCES district)
- District
- Lawton
- NCES district ID
- 4017250
- Math proficiency
- 20% ▼ -12.00%
- Reading proficiency
- 26% ▼ -9.00%
- Median HH income
- $42,618
- Composite
- 19.68/100
- National rank
- #8732
- State rank
- #137 of 270 in OK
Livability — Lawton
- Score
- 63/100
- State rank
- #206
- US rank
- #15131
Category grades
Schools grade is shown separately in the Schools card above.
Census & demographics
- Census place
- Lawton, OK
- County
- Comanche County · 96,361 people
- City population
- 89,233
- Metro
- Lawton, OK
- Population (ZIP)
- 47,790
- Household income
- $58,272
- Rent vs Own
- Severe rent burden
- 1986.0
Population outlook (Comanche County) Hauer SSP2
- Today (2025)
- 124,518 people
- By 2030
- 124,231 · -0.2%
- By 2040
- 122,193 · -1.9%
- By 2050
- 120,368 · -3.3%
- By 2075
- 120,492 · -3.2%
- By 2100
- 123,113 · -1.1%
Race, ethnicity, and origin ACS 2023
- Neighborhood character
- Diverse neighborhood (Simpson 0.70)
- Race & ethnicity
- White 50% Black 17% Two or more races 16% Hispanic / Latino 16% Native American 4% Asian 3%
- Hispanic origin (detail)
- Mexican 11% Puerto Rican 2%
- Common ancestry
- Lithuanian 2% Slovak 2% Romanian 1%
- Foreign-born
- 6% · Canada, South Korea
- Languages at home
- 88% English-only · Spanish 6% German/W. Germanic 2% Korean 1%
Political lean MEDSL · Comanche
- 2024 margin
- Strong R (+23.3) · D 37.4% · R 60.7% · Other 1.9%
- 2008→2024 swing
- -5.8pp toward R · 2008: -17.5pp · 2024: -23.3pp
- All cycles
- 2024: R+23.3 2020: R+20.1 2016: R+23.7 2012: R+17.0 2008: R+17.5
Not yet ingested
- Civics
- —
Market trends
- HPI YoY
- ▼ -134.88%
- Current HPI
- 169.4524
- Rent YoY
- ▲ 5.14%
- Metro
- Lawton, OK
- State GDP YoY
- ▲ 1.55%
- F500 in state
- 6
Industry mix (Fortune 500 HQ in OK)
| Industry | F500 HQs | Revenue |
|---|---|---|
| Energy | 3 | $48B |
|
||
Price history
+54.3% since first listed4 events — show timeline
- 2026-05-06 Pending — MLSOK
- 2026-04-01 Listed $67,900 MLSOK
- 2025-01-28 Listed $75,000 LBRMLS
- 1992-10-29 Sold (Public Records) $44,000 Public Records
Property tax history
+0.8%/yrLatest (2025): $646 · +4.7% YoY. Source: county tax records.
Cash-flow waterfall
monthlySold comps — $/sqft
last 12 mo · ≤1 miLoading sold comps…