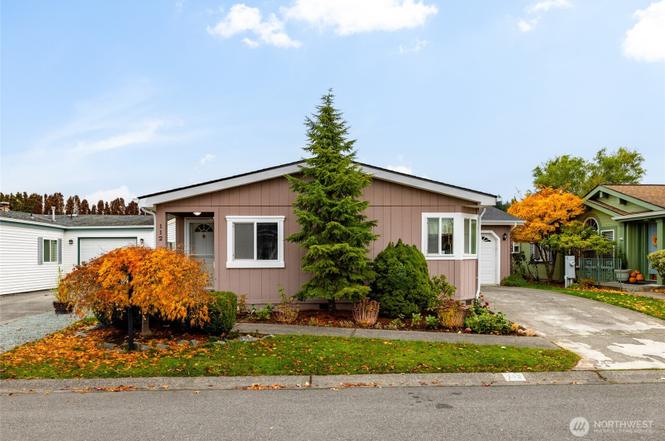
2610 E Section #112 · Mount Vernon, WA
Flood risk 1/10 · Minimal
- FEMA flood zone
- X
- Chance of flooding over 30 yrs
- 0.0%
- Est. flood insurance / yr
- $507 – $1,088
Fire risk 3/10 · Minor
- Est. fire insurance / yr
- $604 – $1,122
Heat risk 2/10 · Minimal
- Hot days now (above 81°F)
- 8 days/yr
- Hot days in 30 yrs
- 22 days/yr
Wind risk 1/10 · Minimal
- Chance of severe wind over 30 yrs
- —
Air-quality risk 5/10 · Moderate
- Unhealthy air days now
- 7 days/yr
- Unhealthy air days in 30 yrs
- 7 days/yr
Risk factors via First Street. Map © Google.
Why this score? — see what drove the C+ grade
The composite is a weighted blend of 9 inputs, each scored 0–100. Each bar is that input's sub-score; the figure is the points it added to the 100-point composite (weight × sub-score).
- Cash flow +26.3/30.0
- DSCR +8.9/10.0
- ARV discount +6.7/15.0
- 1% rule +6.5/10.0
- Schools +4.0/10.0
- Livability +4.0/5.0
- Rent growth +2.5/5.0
- Condition / age +2.5/5.0
- Appreciation +0.0/10.0
$249,000
🖨 Deal sheet 📄 Offer letter ✓ Due diligence
Listing remarks
Welcome to Little Mountain Estates, a gated 55+ community offering many amenities, including a indoor pool, clubhouse, exercise room, library, event space, and RV storage. This well-maintained, move-in-ready home features 3 spacious bedrooms, 2 full baths, vaulted ceilings, and an inviting open layout with generous living and dining areas. The well-appointed kitchen flows nicely into the dining space, and the separate laundry room adds extra convenience. Enjoy year-round comfort with A/C. Outside, the property offers an attached garage with an EV charger, separate shop, fully fenced yard, and private patio perfect for relaxing or entertaining. Centrally located near shopping, dining, and me
Key facts
- Clubhouse
- Exercise room
- Event space
Tags
Neighborhood map
What this means for you Summary
Snapshot
- This is a 3-bed/2.0-bath manufactured listed at $249k.
Deal economics
- At list price, monthly cash flow is $646 ($8k/yr) — positive.
- The deal already cash-flows at list — no discount required.
- Meets the 1% rule at list price ($3k rent vs $249k).
- Recommended offer: $219k (12.0% below list) — sets the bar for market timing.
- Cap rate 9.4% vs local median 2.4% in Mount Vernon — top-decile yield for the area; either an underpriced asset or a hidden risk that comps aren't pricing in. Stress-test before assuming the spread holds.
Location & tenants
- Location reads 79/100 on livability (#106 in WA, #2,120 nationally) — a middle-class / working-renter tenant base. Strengths: commute A+, housing A+, health & safety A+; Watch: cost of living D+.
- Mount Vernon School District (urban): math 41% / reading 47% proficiency, ranked #189 of 291 in WA (top 65%) — families likely to look elsewhere, expect single-tenant / working-renter base with shorter leases.
- Market conditions: 171 active listings in the ZIP; 4 comparable units currently listed for rent nearby; rentals lingering (median 44d on market — plan ~5-8 weeks vacancy on turnover, expect pricing pressure); 50% of comp listings sitting > 30 days — soft ceiling on asking rent; solid renter incomes; 561 units permitted in Skagit County in 2024 (270 in 5+ unit buildings).
- This rent runs 36% of the median local income ($96k/yr) — at the standard rent-burdened threshold; future hikes will face affordability resistance.
Forward outlook
- Local home prices are declining (-3.0%/yr); year-one equity from $2k of loan paydown is wiped out by about $7k of value loss. Plan a longer hold.
- Skagit County population projected at +11% by 2050 — modest demand growth; plan on rents tracking national, not racing it.
- At projected returns (-3.0% appreciation + 3.0% rent growth), your $70k cash investment doubles in ~10 years — after that, you're playing with house money.
Negotiation context
- It's been on market 161 days — a 12% lower offer ($219k) is reasonable based on typical stale-listing flexibility.
- 6 sale attempts since 24y ago with the ask held roughly flat each time — persistent listings suggest the price (not the market) is what's stuck; bring a comps-based counter.
Questions for the listing agent
- It's been on market 161 days. Have you received any prior offers? Is the seller open to a 12% concession, seller financing, or rate buy-down credit?
- Why hasn't it sold? Are there any deal-killer items the seller is aware of (foundation, flood, title, zoning, code violations)?
- Is there a deadline driving the sale (1031 exchange, divorce, estate, relocation)? That informs how much negotiation room exists.
- What's the average days-on-market for RENTAL listings here right now (not sales)? A rising rental-DOM trend means longer vacancies and softer asking-rent achievability than the comps imply.
- What's the recent tenant-quality profile in this submarket — average credit score on applications, eviction rate, late-payment / NSF rate, and stable-employment percentage? A property-management company in the area should have these aggregated.
- How much new for-sale + rental construction is in the pipeline within 1–3 miles? Heavy new supply typically softens prices + rents 12–24 months out; constrained supply supports both.
Investment metrics
- 1% rule
- 1.15% ✓
- Cap rate
- 9.40%
- Cash-on-cash
- 11.11%
- DSCR
- 1.49
- GRM
- 7.2
CMA / ARV
- ARV (on-the-fly)
- $244,552
- Comps found
- 12
Show comp detail 12 sales within ~0.75 mi
| Address | Dist | Beds/Ba | Sqft | Sold | Price | $/sf | Match |
|---|---|---|---|---|---|---|---|
| 2610 E Section #112 | 0.00mi | 3/2.0 | 1,588 (0%) | 1mo | $245,000 | $154 | 99 |
| 1120 S 25th St #7 | 0.26mi | 3/2.0 | 1,605 (+1%) | 3mo | $130,000 | $81 | 83 |
| 2610 E Section St #86 | 0.23mi | 3/2.0 | 1,610 (+1%) | 9mo | $250,000 | $155 | 80 |
| 2610 E Section St #95 | 0.00mi | 3/2.0 | 1,772 (+12%) | 1mo | $285,000 | $161 | 80 |
| 2610 E Section St #85 | 0.23mi | 3/2.0 | 1,568 (-1%) | 10mo | $219,000 | $140 | 79 |
| 1120 S 25th St #45 | 0.21mi | 3/2.0 | 1,512 (-5%) | 8mo | $169,000 | $112 | 75 |
| 2610 E Section St #12 | 0.23mi | 3/2.0 | 1,736 (+9%) | 4mo | $300,000 | $173 | 71 |
| 1120 S 25th St #95 | 0.26mi | 2/2.0 (-1) | 1,512 (-5%) | 6mo | $164,000 | $108 | 70 |
| 1120 S 25th St #39 | 0.26mi | 3/2.0 | 1,401 (-12%) | 4mo | $160,000 | $114 | 65 |
| 2610 E Section St #97 | 0.22mi | 2/2.0 (-1) | 1,388 (-13%) | 3mo | $232,000 | $167 | 62 |
| 2610 E Section St #46 | 0.23mi | 2/1.5 (-1) | 1,418 (-11%) | 7mo | $300,000 | $212 | 58 |
| 2610 E Section St #115 | 0.23mi | 2/2.0 (-1) | 1,772 (+12%) | 10mo | $255,000 | $144 | 56 |
Match score weights: distance 35% · size 25% · config 20% · recency 20%. Top-matched comps best support the ARV.
Projected returns pro-forma
-3.0% appreciation · 3.0% rent growth · sell at horizon
- IRR
- 0.3%
- Equity multiple
- 1.01×
- Total profit
- $755
- Equity at exit
- $37,127
- IRR
- 9.9%
- Equity multiple
- 1.77×
- Total profit
- $53,545
- Equity at exit
- $21,529
Cash invested: $69,720 (down + closing). Projections, not guarantees.
Landlord ↔ Tenant lean methodology
- Overall (STATE)
- 28 Tenant-Leaning
- State Washington
- 28 Tenant-Leaning · D+8
- County
- — inherits STATE
- City
- — inherits STATE
ZIP-level market 98274
- Active inventory
- 171
- Price-to-rent
- 7.2×
Monthly cashflow live
- Estimated rent
- $2,876 medium interval (Pro) →
- Mortgage (P&I)
- −$1,306
- Tax from tax record
- −$217 /mo · $2,601/yr
- Insurance
- −$104
- HOA
- −$0
- Vacancy / Maint / Mgmt
- −$604
- Net cashflow
- $646
Break-even live
UW: 25.0% down · 7.5% · 30yr · 1.5% tax · 5.0% vac · 8.0% maint · 8.0% mgmt
Financing live
Cash to close
- Down payment
- $62,250
- Closing costs
- $7,470
- Reserves months
- —
- Total cash needed
- —
Loan-product check · same deal, 3 products live
Conventional
25% down · 7.5% · 30yr
- Down + closing
- —
- Monthly P&I
- —
- Monthly cashflow
- —
- DSCR
- —
- Eligible?
- —
Personal DTI + credit; lowest rate.
DSCR
20% down · 8.5% · 30yr
- Down + closing
- —
- Monthly P&I
- —
- Monthly cashflow
- —
- DSCR
- —
- Eligible?
- —
No personal income docs; deal must DSCR.
Hard money
10% down · 12.0% · 12mo
- Down + closing
- —
- Monthly P&I
- —
- Monthly cashflow
- —
- DSCR
- —
- Eligible?
- —
Short-term bridge; refi at stabilization.
Rent comps 4 comps
| Address | Beds | Baths | Sqft | Rent | $/sqft | DOM | Units | Dist |
|---|---|---|---|---|---|---|---|---|
| 2815 E Section St Mount Vernon, WA | 2.0 | 2.0 | 2100 | $2,100 | $1.00 | 43d | 1 | 0.18mi |
| 119 N 29th Pl Mount Vernon, WA | 3.0 | 1.0 | 1098 | $2,700 | $2.46 | 43d | 1 | 0.67mi |
| 1002 S 12th St Mount Vernon, WA | 2.0 | 1.0 | 1052 | $2,575 | $2.45 | 20d | 1 | 0.91mi |
| 202 Dallas St Mount Vernon, WA | 3.0 | 2.5 | 1582 | $1,375 | $0.87 | 20d | 1 | 1.27mi |
Listing history 17 events
-
2026-04-22status Pending
-
2026-03-10price $249,000
-
2025-12-18status Active
-
2025-12-12status Pending
-
2025-11-06$255,000 Active
-
2022-05-05soldstatus $225,000 Closed
-
2022-04-13status Pending
-
2022-04-07$225,000 Active
-
2011-04-19soldstatus $47,500 Sold
-
2011-04-07status Pending
-
2011-03-28status Pending Inspection
-
2011-01-17$49,450 Active
-
2007-07-31soldstatus $128,500
-
2007-06-23historical
-
2007-06-11$128,500
-
2002-10-31soldstatus $117,500
-
2002-07-29$117,500
ⓘ Source: listings_history table (triggers on properties + properties_extension) + one-shot
backfill from property_details.listing_events for pre-trigger history.
Tax reassessment forecast WA · Resets to sale price
- Current annual tax
- $2,601 · $217/mo
- Projected year-2 tax
- $2,601 · $217/mo
- Expected delta
- $0/yr ($0/mo · 0.0%)
ⓘ Screening estimate from a state-policy table — verify with the county assessor before closing.
Climate risk First Street
- Flood 1/10 Low FEMA zone X · 0% chance over 30 yrs
- Wildfire 3/10 Moderate
- Heat 2/10 Low 8 d/yr ≥81°F today · 22 d/yr by 30 yrs out
- Wind 1/10 Low
- Air quality 5/10 Major 7 unhealthy d/yr today · 7 by 30 yrs out
Nearby sold comps map
Loading sold comps map…
Walkable amenities ~0.75 mi
Loading nearby amenities…
Taxation est. · year 1
- Rental income
- $34,509
- − Mortgage interest
- −$13,948
- − Property taxes
- −$2,601
- − Insurance
- −$1,245
- − Repairs & maintenance
- −$2,761
- − Management
- −$2,761
- − Depreciation
- −$7,244
- Taxable income
- $3,951
- Est. tax owed @ 24.0%
- −$948
- After-tax cash flow
- $6,799/yr
For passive investors: Depreciation is non-cash, so a rental often shows a tax loss while cash-flowing — sheltering income. Rental losses are passive: they offset passive income freely, and up to $25,000/yr can offset ordinary (W-2) income if you actively participate and your MAGI is under $100k (phasing out to $0 by $150k); unused losses carry forward. On sale, claimed depreciation is recaptured at up to 25%, and gains may owe capital-gains tax (a 1031 exchange can defer both). Figures are a year-1 estimate at your 24.0% rate — not tax advice; consult a CPA.
Schools (NCES district)
- District
- Mount Vernon School District
- NCES district ID
- 5305400
- Math proficiency
- 41% ▼ -1.00%
- Reading proficiency
- 47% ▲ 1.00%
- Median HH income
- $50,829
- Composite
- 40.14/100
- National rank
- #7848
- State rank
- #189 of 291 in WA
Livability — Mount Vernon
- Score
- 79/100
- State rank
- #106
- US rank
- #2120
Category grades
Schools grade is shown separately in the Schools card above.
Census & demographics
- Census place
- Mount Vernon, WA
- County
- Skagit County · 118,108 people
- City population
- 48,861
- Metro
- Mount Vernon-Anacortes, WA
- Population (ZIP)
- 18,860
- Household income
- $96,177
- Rent vs Own
- Severe rent burden
- 412.0
Population outlook (Skagit County) Hauer SSP2
- Today (2025)
- 131,498 people
- By 2030
- 135,556 · +3.1%
- By 2040
- 141,717 · +7.8%
- By 2050
- 145,714 · +10.8%
- By 2075
- 152,201 · +15.7%
- By 2100
- 147,980 · +12.5%
Race, ethnicity, and origin ACS 2023
- Neighborhood character
- Majority White (64%)
- Race & ethnicity
- White 64% Hispanic / Latino 24% Two or more races 10% Asian 3% Native American 1% Black 1%
- Hispanic origin (detail)
- Mexican 21%
- Common ancestry
- Portuguese 7% Italian 5% Iranian 2%
- Foreign-born
- 13% · Canada, Vietnam, China
- Languages at home
- 78% English-only · Spanish 16% Russian/Polish/Slavic 1% Tagalog/Filipino 1%
Political lean MEDSL · Skagit
- 2024 margin
- Lean D (+8.9) · D 52.9% · R 44.0% · Other 3.0%
- 2008→2024 swing
- -0.7pp no change · 2008: 9.6pp · 2024: 8.9pp
- All cycles
- 2024: D+8.9 2020: D+7.5 2016: D+3.2 2012: D+5.8 2008: D+9.6
Not yet ingested
- Civics
- —
Market trends
- HPI YoY
- ▼ -587.88%
- Current HPI
- 363.1257
- Rent YoY
- —
- Metro
- Mount Vernon-Anacortes, WA
- State GDP YoY
- ▲ 4.65%
- F500 in state
- 22
Industry mix (Fortune 500 HQ in WA)
| Industry | F500 HQs | Revenue |
|---|---|---|
| Retail | 2 | $269B |
|
||
| Technology / Retail | 1 | $638B |
|
||
| Technology | 1 | $245B |
|
||
| Telecommunications | 1 | $38B |
|
||
| Food / Beverage | 1 | $36B |
|
||
| Automotive / Trucks | 1 | $34B |
|
||
Price history
+111.9% since first listed17 events — show timeline
- 2026-04-22 Pending — NWMLS as Distributed by MLS Grid
- 2026-03-10 Price Changed $249,000 NWMLS as Distributed by MLS Grid
- 2025-12-18 Relisted — NWMLS as Distributed by MLS Grid
- 2025-12-12 Pending — NWMLS as Distributed by MLS Grid
- 2025-11-06 Listed $255,000 NWMLS as Distributed by MLS Grid
- 2022-05-05 Sold (MLS) $225,000 NWMLS as Distributed by MLS Grid
- 2022-04-13 Pending — NWMLS as Distributed by MLS Grid
- 2022-04-07 Listed $225,000 NWMLS as Distributed by MLS Grid
- 2011-04-19 Sold (MLS) $47,500 NWMLS as Distributed by MLS Grid
- 2011-04-07 Pending — NWMLS as Distributed by MLS Grid
- 2011-03-28 Pending — NWMLS as Distributed by MLS Grid
- 2011-01-17 Listed $49,450 NWMLS as Distributed by MLS Grid
- 2007-07-31 Sold (MLS) $128,500 NWMLS as Distributed by MLS Grid
- 2007-06-23 Delisted — NWMLS as Distributed by MLS Grid
- 2007-06-11 Listed $128,500 NWMLS as Distributed by MLS Grid
- 2002-10-31 Sold (MLS) $117,500 NWMLS as Distributed by MLS Grid
- 2002-07-29 Listed $117,500 NWMLS as Distributed by MLS Grid
Property tax history
+5.6%/yrLatest (2026): $2,601 · +8.1% YoY. Source: county tax records.
Cash-flow waterfall
monthlySold comps — $/sqft
last 12 mo · ≤1 miLoading sold comps…