19602 San Severino Dr · Houston, TX
Flood risk 4/10 · Minor
- FEMA flood zone
- X (unshaded)
- Chance of flooding over 30 yrs
- 0.2%
- Est. flood insurance / yr
- $507 – $1,088
Fire risk 5/10 · Moderate
- Est. fire insurance / yr
- $1,222 – $2,270
Heat risk 8/10 · Major
- Hot days now (above 110°F)
- 7 days/yr
- Hot days in 30 yrs
- 23 days/yr
Wind risk 9/10 · Severe
- Chance of severe wind over 30 yrs
- 99.0%
Air-quality risk 2/10 · Minimal
- Unhealthy air days now
- 2 days/yr
- Unhealthy air days in 30 yrs
- 2 days/yr
Risk factors via First Street. Map © Google.
Why this score? — see what drove the D- grade
The composite is a weighted blend of 9 inputs, each scored 0–100. Each bar is that input's sub-score; the figure is the points it added to the 100-point composite (weight × sub-score).
- ARV discount +15.0/15.0
- Cash flow +7.5/30.0
- Livability +3.7/5.0
- Schools +2.9/10.0
- 1% rule +2.8/10.0
- Condition / age +2.5/5.0
- Rent growth +2.3/5.0
- DSCR +1.6/10.0
- Appreciation +0.0/10.0
$275,990
🖨 Deal sheet 📄 Offer letter ✓ Due diligence
Listing remarks MLS
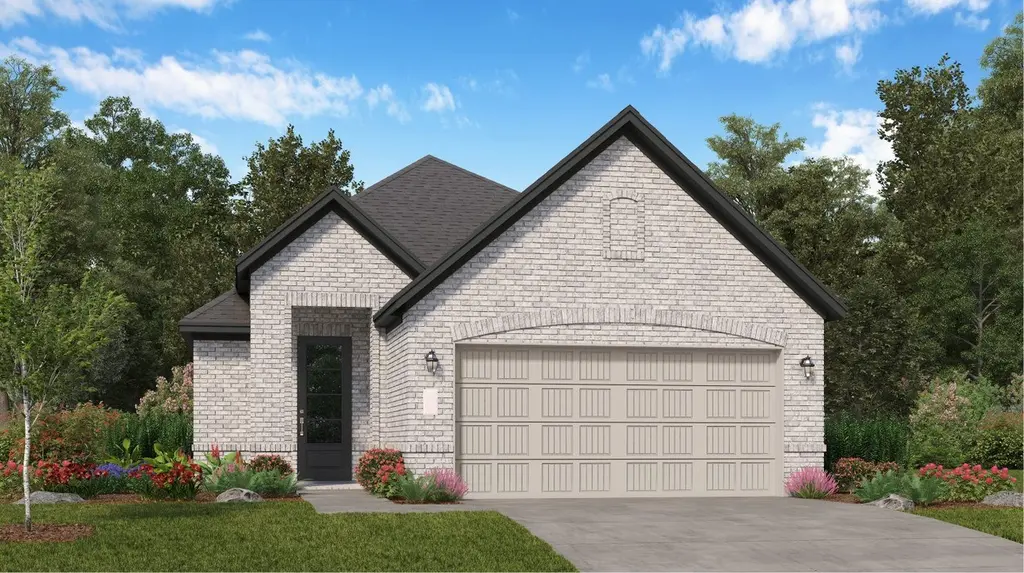
This new single-level home features a low-maintenance and modern design. An open-concept floorplan combines the kitchen, living and dining areas, with a nearby covered patio ready for outdoor entertainment and leisure. Two secondary bedrooms are tucked away to the side of the home, and the luxe owner's suite is nestled into a private rear corner, complete with a spa-inspired bathroom and walk-in closet.
Key facts
- Walk-in closet
- Covered patio
- 2 garage spots
Tags
Neighborhood map
What this means for you Summary
Snapshot
- This is a 3-bed/2.0-bath single-family listed at $276k.
Deal economics
- At list price, monthly cash flow is $-349 ($-4k/yr) — negative.
- To cash-flow at today's rent, offer at most $226k (18.3% below list).
- To meet the 1% rule (rent ≥ 1% of price), the offer needs to be $214k (22.3% below list).
- Recommended offer: $214k (22.3% below list) — sets the bar for 1% rule.
- Cap rate 4.8% vs local median 3.2% in Houston — top-decile yield for the area; either an underpriced asset or a hidden risk that comps aren't pricing in. Stress-test before assuming the spread holds.
Location & tenants
- Location reads 74/100 on livability (#184 in TX, #4,771 nationally) — a middle-class / working-renter tenant base. Strengths: amenities A+, cost of living A+, housing A+; Watch: schools D, crime F.
- Waller ISD (rural): math 30% / reading 35% proficiency, ranked #532 of 826 in TX (top 64%) — families likely to look elsewhere, expect single-tenant / working-renter base with shorter leases.
- Market conditions: Rents soft (-0.7%/yr); 723 active listings in the ZIP; 7 comparable units currently listed for rent nearby; rentals leasing fast (median 2d on market — plan ~1-2 weeks tenant-placement turnaround); high-income renter base; 29,883 units permitted in Harris County in 2024 (8,621 in 5+ unit buildings).
Forward outlook
- Local home prices are declining (-3.0%/yr); year-one equity from $2k of loan paydown is wiped out by about $8k of value loss. Plan a longer hold.
- Harris County population projected at +47% by 2050 — long-run rental-demand tailwind backs the buy-and-hold thesis.
Negotiation context
- It's been on market 35 days — a 3% lower offer ($268k) is reasonable based on typical stale-listing flexibility.
Risks & watch-outs
- Climate carrying-cost: severe wind risk, 99% chance of damaging wind over 30y; moderate wildfire risk; extreme-heat days projected 7→23/yr by 2055 (HVAC capex compounding) — expect insurance premiums to compound above CPI over the hold.
Questions for the listing agent
- What do current leases actually rent for vs. the listed asking? Can we see a recent rent roll and the last 12 months of T-12 income?
- It's been on market 35 days. Have you received any prior offers? Is the seller open to a 22% concession, seller financing, or rate buy-down credit?
- What does the HOA fee cover, when was the last increase, and are there any pending special assessments or reserve-fund shortfalls?
- Is there a deadline driving the sale (1031 exchange, divorce, estate, relocation)? That informs how much negotiation room exists.
- Schools are D-rated, which usually means shorter tenancies and higher turnover. Who's the typical renter profile here, and what's been the actual vacancy rate?
- Crime grade is F in this area — have there been break-ins, vandalism, or insurance claims at this property in the last 3 years? What carrier currently insures it and at what premium?
- The area grade is low — what's the realistic commute time and amenity access for the typical tenant pool here? Any planned neighborhood developments (good or bad) we should know about?
- What's the average days-on-market for RENTAL listings here right now (not sales)? A rising rental-DOM trend means longer vacancies and softer asking-rent achievability than the comps imply.
- What's the recent tenant-quality profile in this submarket — average credit score on applications, eviction rate, late-payment / NSF rate, and stable-employment percentage? A property-management company in the area should have these aggregated.
- How much new for-sale + rental construction is in the pipeline within 1–3 miles? Heavy new supply typically softens prices + rents 12–24 months out; constrained supply supports both.
Investment metrics
- 1% rule
- 0.78% ✗
- Cap rate
- 4.78%
- Cash-on-cash
- -5.42%
- DSCR
- 0.76
- GRM
- 10.7
CMA / ARV
- ARV (median comp)
- $347,217
- List price
- $275,990
- Delta
- -20.80%
- Verdict
- UNDERPRICED
- Comps
- 20 within 2.0 mi
Show comp detail 12 sales within ~0.75 mi
| Address | Dist | Beds/Ba | Sqft | Sold | Price | $/sf | Match |
|---|---|---|---|---|---|---|---|
| 22202 San Lioni Ln | 0.01mi | 3/2.0 | 1,600 (+2%) | 1mo | $311,990 | $195 | 96 |
| 19307 Licola Ln | 0.01mi | 3/2.0 | 1,627 (+4%) | 0mo | $276,990 | $170 | 93 |
| 22011 Maddaloni View Dr | 0.02mi | 3/2.0 | 1,627 (+4%) | 1mo | $296,990 | $183 | 93 |
| 21647 Carbonari Dr | 0.02mi | 3/2.5 | 1,635 (+4%) | 1mo | $330,990 | $202 | 90 |
| 22034 Matera Vista Ln | 0.08mi | 3/2.0 | 1,642 (+4%) | 1mo | $284,990 | $174 | 88 |
| 21643 Carbonari Dr | 0.02mi | 4/2.0 (+1) | 1,655 (+5%) | 1mo | $333,990 | $202 | 85 |
| 21623 Carbonari Dr | 0.02mi | 4/2.0 (+1) | 1,655 (+5%) | 1mo | $328,990 | $199 | 85 |
| 19071 Cetara Villa Dr | 0.40mi | 3/2.0 | 1,582 (+1%) | 0mo | $249,990 | $158 | 80 |
| 21639 Carbonari Dr | 0.02mi | 3/2.5 | 1,749 (+11%) | 1mo | $337,990 | $193 | 78 |
| 22102 La Scorza Dr | 0.02mi | 3/2.0 | 1,792 (+14%) | 1mo | $324,990 | $181 | 75 |
| 22026 Matera Vista Ln | 0.08mi | 4/2.0 (+1) | 1,759 (+12%) | 1mo | $299,990 | $171 | 71 |
| 21002 Echo Manor Dr | 0.67mi | 3/2.0 | 1,513 (-4%) | 0mo | $262,000 | $173 | 62 |
Match score weights: distance 35% · size 25% · config 20% · recency 20%. Top-matched comps best support the ARV.
Projected returns pro-forma
-3.0% appreciation · 0.0% rent growth · sell at horizon
- IRR
- -29.2%
- Equity multiple
- 0.05×
- Total profit
- $-73,102
- Equity at exit
- $41,151
- IRR
- -49.6%
- Equity multiple
- -0.50×
- Total profit
- $-116,069
- Equity at exit
- $23,863
Cash invested: $77,277 (down + closing). Projections, not guarantees.
Landlord ↔ Tenant lean methodology
- Overall (STATE)
- 87 Strongly Landlord-Friendly
- State Texas
- 87 Strongly Landlord-Friendly · R+5
- County
- — inherits STATE
- City
- — inherits STATE
ZIP-level market 77377
- Home prices YoY
- -24.5%
- Rents YoY
- -0.7%
- Active inventory
- 723
- Price-to-rent
- 10.7×
Monthly cashflow live
- Estimated rent
- $2,144 high interval (Pro) →
- Mortgage (P&I)
- −$1,447
- Tax est. 1.5%
- −$345 /mo · $4,140/yr
- Insurance
- −$115
- HOA
- −$135
- Vacancy / Maint / Mgmt
- −$450
- Net cashflow
- $-349
Break-even live
UW: 25.0% down · 7.5% · 30yr · 1.5% tax · 5.0% vac · 8.0% maint · 8.0% mgmt
Financing live
Cash to close
- Down payment
- $68,998
- Closing costs
- $8,280
- Reserves months
- —
- Total cash needed
- —
Loan-product check · same deal, 3 products live
Conventional
25% down · 7.5% · 30yr
- Down + closing
- —
- Monthly P&I
- —
- Monthly cashflow
- —
- DSCR
- —
- Eligible?
- —
Personal DTI + credit; lowest rate.
DSCR
20% down · 8.5% · 30yr
- Down + closing
- —
- Monthly P&I
- —
- Monthly cashflow
- —
- DSCR
- —
- Eligible?
- —
No personal income docs; deal must DSCR.
Hard money
10% down · 12.0% · 12mo
- Down + closing
- —
- Monthly P&I
- —
- Monthly cashflow
- —
- DSCR
- —
- Eligible?
- —
Short-term bridge; refi at stabilization.
Rent comps 7 comps
| Address | Beds | Baths | Sqft | Rent | $/sqft | DOM | Units | Dist |
|---|---|---|---|---|---|---|---|---|
| 22215 Scarlino Dr Hockley, TX | 3.0 | 2.0 | 2099 | $2,450 | $1.17 | 22d | 1 | 0.20mi |
| 20703 Solstice Point Dr Hockley, TX | 3.0 | 2.0 | 1912 | $1,951 | $1.02 | 2d | 1 | 0.49mi |
| 22023 Lost Lantern Dr Hockley, TX | 3.0–4.0 | 2.0 | 1601 | $1,863 | $1.16 | 2d | 1 | 0.54mi |
| 20718 Round Key Dr Hockley, TX | 4.0 | 2.5 | 2133 | $1,931 | $0.91 | 5d | 1 | 0.68mi |
| 21210 Echo Manor Dr Hockley, TX | 4.0 | 2.5 | 2221 | $2,150 | $0.97 | 3d | 1 | 0.79mi |
| 20313 Evergreen Cypress Dr Hockley, TX | 2.0–5.0 | 2.0–3.5 | 2051 | $2,353 | $1.15 | 1d | 1 | 0.92mi |
| 22719 Klingamans Way Hockley, TX | 3.0 | 2.0 | 1416 | $1,689 | $1.19 | 2d | 1 | 0.94mi |
HOA detail
- Monthly dues
- $135 · $1,620/yr
Listing history 18 events
-
2026-06-18days on market $275,990 Active 35 DOM
-
2026-06-17days on market $275,990 Active 34 DOM
-
2026-06-16days on market $275,990 Active 33 DOM
-
2026-06-15remarks 626-char remark
-
2026-06-15days on market $275,990 Active 32 DOM
-
2026-06-13days on market $275,990 Active 30 DOM
-
2026-06-09pricedays on market $275,990 Active 26 DOM
-
2026-06-08days on market $275,000 Active 25 DOM
-
2026-06-07days on market $275,000 Active 24 DOM
-
2026-06-04days on market $275,000 Active 21 DOM
-
2026-06-03days on market $275,000 Active 20 DOM
-
2026-06-02days on market $275,000 Active 19 DOM
-
2026-06-01days on market $275,000 Active 18 DOM
-
2026-05-31days on market $275,000 Active 17 DOM
-
2026-05-05price $275,000 406-char remark
Show marketing remark (406 chars)
This new single-level home features a low-maintenance and modern design. An open-concept floorplan combines the kitchen, living and dining areas, with a nearby covered patio ready for outdoor entertainment and leisure. Two secondary bedrooms are tucked away to the side of the home, and the luxe owner's suite is nestled into a private rear corner, complete with a spa-inspired bathroom and walk-in closet.
-
2026-04-18price $261,390 406-char remark
Show marketing remark (406 chars)
This new single-level home features a low-maintenance and modern design. An open-concept floorplan combines the kitchen, living and dining areas, with a nearby covered patio ready for outdoor entertainment and leisure. Two secondary bedrooms are tucked away to the side of the home, and the luxe owner's suite is nestled into a private rear corner, complete with a spa-inspired bathroom and walk-in closet.
-
2026-04-14price $265,790 406-char remark
Show marketing remark (406 chars)
This new single-level home features a low-maintenance and modern design. An open-concept floorplan combines the kitchen, living and dining areas, with a nearby covered patio ready for outdoor entertainment and leisure. Two secondary bedrooms are tucked away to the side of the home, and the luxe owner's suite is nestled into a private rear corner, complete with a spa-inspired bathroom and walk-in closet.
-
2026-04-10$261,990 Active 406-char remark
Show marketing remark (406 chars)
This new single-level home features a low-maintenance and modern design. An open-concept floorplan combines the kitchen, living and dining areas, with a nearby covered patio ready for outdoor entertainment and leisure. Two secondary bedrooms are tucked away to the side of the home, and the luxe owner's suite is nestled into a private rear corner, complete with a spa-inspired bathroom and walk-in closet.
ⓘ Source: listings_history table (triggers on properties + properties_extension) + one-shot
backfill from property_details.listing_events for pre-trigger history.
Climate risk First Street
- Flood 4/10 Moderate FEMA zone X (unshaded) · 20% chance over 30 yrs
- Wildfire 5/10 Major
- Heat 8/10 Severe 7 d/yr ≥110°F today · 23 d/yr by 30 yrs out
- Wind 9/10 Extreme 99% chance of damaging wind over 30 yrs
- Air quality 2/10 Low 2 unhealthy d/yr today · 2 by 30 yrs out
Nearby sold comps map
Loading sold comps map…
Walkable amenities ~0.75 mi
Loading nearby amenities…
Taxation est. · year 1
- Rental income
- $25,725
- − Mortgage interest
- −$15,460
- − Property taxes
- −$4,140
- − Insurance
- −$1,380
- − Repairs & maintenance
- −$2,058
- − Management
- −$2,058
- − HOA
- −$1,620
- − Depreciation
- −$8,029
- Taxable loss
- −$9,020
- Est. tax savings @ 24.0%
- +$2,165
- After-tax cash flow
- $-2,020/yr
For passive investors: Depreciation is non-cash, so a rental often shows a tax loss while cash-flowing — sheltering income. Rental losses are passive: they offset passive income freely, and up to $25,000/yr can offset ordinary (W-2) income if you actively participate and your MAGI is under $100k (phasing out to $0 by $150k); unused losses carry forward. On sale, claimed depreciation is recaptured at up to 25%, and gains may owe capital-gains tax (a 1031 exchange can defer both). Figures are a year-1 estimate at your 24.0% rate — not tax advice; consult a CPA.
Schools (NCES district)
- District
- Waller ISD
- NCES district ID
- 4844430
- Math proficiency
- 30% ▼ -23.00%
- Reading proficiency
- 35% ▼ -11.00%
- Median HH income
- $58,911
- Composite
- 29.12/100
- National rank
- #6593
- State rank
- #532 of 826 in TX
Livability — Houston
- Score
- 74/100
- State rank
- #184
- US rank
- #4771
Category grades
Schools grade is shown separately in the Schools card above.
Census & demographics
- County
- Harris County · 4,702,590 people
- City population
- 3,226,434
- Metro
- Houston-The Woodlands-Sugar Land, TX
- Population (ZIP)
- 41,680
- Household income
- $129,327
- Rent vs Own
- Severe rent burden
- 444.0
Population outlook (Harris County) Hauer SSP2
- Today (2025)
- 5,571,493 people
- By 2030
- 6,089,821 · +9.3%
- By 2040
- 7,142,806 · +28.2%
- By 2050
- 8,185,864 · +46.9%
- By 2075
- 10,574,329 · +89.8%
- By 2100
- 12,109,958 · +117.4%
Race, ethnicity, and origin ACS 2023
- Neighborhood character
- Diverse neighborhood (Simpson 0.55)
- Race & ethnicity
- White 63% Hispanic / Latino 20% Two or more races 12% Asian 9% Black 5%
- Hispanic origin (detail)
- Mexican 14%
- Common ancestry
- Portuguese 4% Lithuanian 3% Romanian 3%
- Foreign-born
- 15% · Canada, China, Vietnam
- Languages at home
- 74% English-only · Spanish 15% Other Indo-European 3% Chinese 2%
Political lean MEDSL · Harris
- 2024 margin
- Lean D (+5.5) · D 52.0% · R 46.4% · Other 1.6%
- 2008→2024 swing
- +3.9pp toward D · 2008: 1.6pp · 2024: 5.5pp
- All cycles
- 2024: D+5.5 2020: D+13.3 2016: D+12.4 2012: D+0.1 2008: D+1.6
Not yet ingested
- Civics
- —
Market trends
- HPI YoY
- ▼ -76.14%
- Current HPI
- 235.031
- Rent YoY
- ▼ -0.69%
- Metro
- Houston-The Woodlands-Sugar Land, TX
- State GDP YoY
- ▲ 3.95%
- F500 in state
- 110
Industry mix (Fortune 500 HQ in TX)
| Industry | F500 HQs | Revenue |
|---|---|---|
| Energy | 16 | $1,198B |
|
||
| Technology | 5 | $198B |
|
||
| Engineering / Construction | 4 | $72B |
|
||
| Energy Services | 3 | $60B |
|
||
| Utilities | 3 | $41B |
|
||
| Healthcare | 2 | $330B |
|
||
Price history
+5.0% since first listed4 events — show timeline
- 2026-05-05 Price Changed $275,000 Zillow
- 2026-04-18 Price Changed $261,390 Zillow
- 2026-04-14 Price Changed $265,790 Zillow
- 2026-04-10 Listed $261,990 Zillow
Cash-flow waterfall
monthlySold comps — $/sqft
last 12 mo · ≤1 miLoading sold comps…