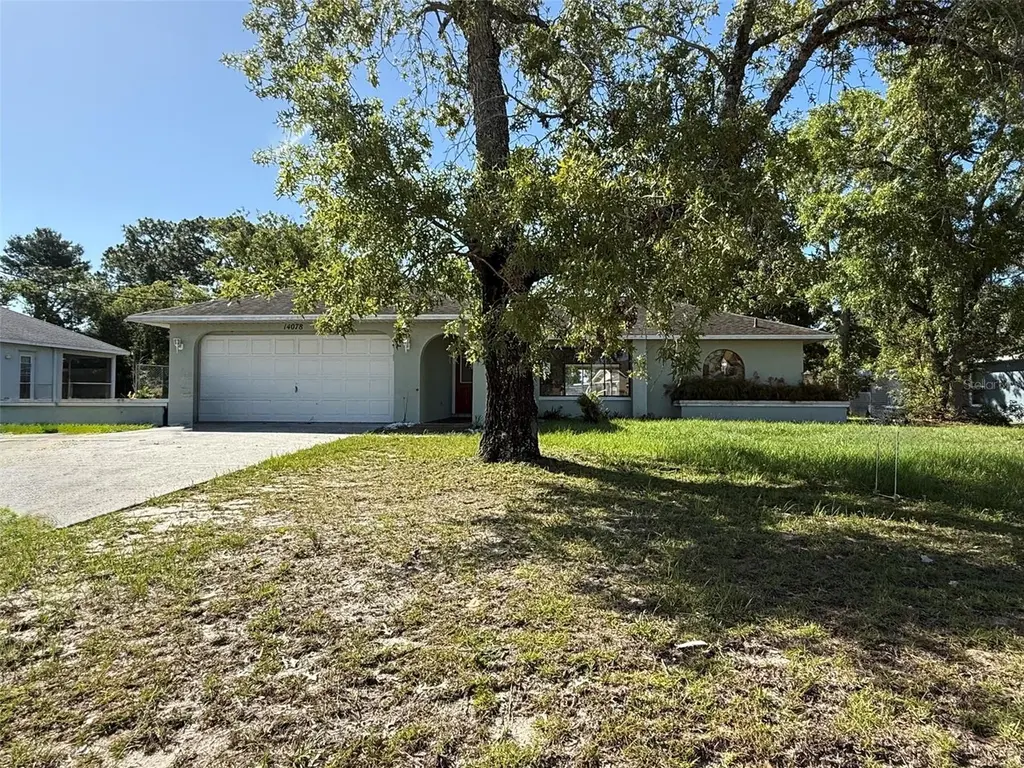
14078 Spring Hill Dr · Spring Hill, FL
Flood risk 1/10 · Minimal
- FEMA flood zone
- X (unshaded)
- Chance of flooding over 30 yrs
- 0.0%
- Est. flood insurance / yr
- $507 – $1,088
Fire risk 4/10 · Minor
- Est. fire insurance / yr
- $947 – $1,759
Heat risk 10/10 · Severe
- Hot days now (above 109°F)
- 7 days/yr
- Hot days in 30 yrs
- 25 days/yr
Wind risk 10/10 · Severe
- Chance of severe wind over 30 yrs
- 99.0%
Air-quality risk 2/10 · Minimal
- Unhealthy air days now
- 2 days/yr
- Unhealthy air days in 30 yrs
- 2 days/yr
Risk factors via First Street. Map © Google.
Why this score? — see what drove the D+ grade
The composite is a weighted blend of 9 inputs, each scored 0–100. Each bar is that input's sub-score; the figure is the points it added to the 100-point composite (weight × sub-score).
- ARV discount +14.5/15.0
- Cash flow +13.3/30.0
- Schools +4.2/10.0
- DSCR +4.0/10.0
- 1% rule +3.8/10.0
- Livability +3.2/5.0
- Condition / age +2.5/5.0
- Rent growth +1.3/5.0
- Appreciation +0.0/10.0
$234,900
🖨 Deal sheet (PDF) 📄 Offer letter ✓ Due diligence
Listing remarks MLS
Welcome home to this 2/2/2 situated on an oversized, fenced lot in the heart of Spring Hill. Offering a spacious and functional layout, this home features comfortable living areas, generous bedroom sizes, and plenty of room to make it your own. Featuring a split bedroom layout, great room, and a primary ensuite with a walk-in closet, private outdoor access, and an attached bathroom. Step outside and enjoy the large screened lanai, the perfect place to relax with your morning coffee, entertain guests, or enjoy Florida's beautiful weather year-round. The oversized yard provides ample space for gardening, outdoor activities, pets, or future enhancements. Conveniently located less than a mile from shopping, dining, and major roadways, this property combines comfort, space, and convenience. Permits indicate roof replaced in 2015 and HVAC in 2012. Schedule your showing today!
Key facts
- Walk-in closet
- Primary ensuite
- Split bedroom layout
Tags
Property features AI
Finance
- Other: Zoning: PDP
- HOA & community: No HOA association indicated
Exterior
- Parking: Attached 2-car garage (20x22)
- Utilities: Public water; Septic tank sewer; Electricity connected
- Home design: Single family residence; Residential property; One story; Property faces north
- Construction: Block, stucco and frame construction; Shingle roof; Slab foundation; Built on a 0.39-acre lot (approx. 1/4 to less than 1/2 acre)
- Exterior features: Sidewalk; Sliding doors; Oversized lot; Paved road access
Interior
- Kitchen: No appliances included
- Bedrooms: 2 bedrooms
- Flooring: Carpet
- Bathrooms: 2 full bathrooms
- Heating & cooling: Central heating (electric); Central air conditioning
- Interior features: Living room/dining room combo; Split bedroom layout; Walk-in closet(s)
- Laundry & utility: Laundry inside
Neighborhood map
What this means for you Summary
Snapshot
- This is a 3-bed/2.0-bath single-family listed at $235k.
Deal economics
- At list price, monthly cash flow is $2 ($21/yr) — positive.
- The deal already cash-flows at list — no discount required.
- To meet the 1% rule (rent ≥ 1% of price), the offer needs to be $207k (12.0% below list).
- Recommended offer: $207k (12.0% below list) — sets the bar for 1% rule.
- Cap rate 6.3% vs local median 4.4% in Spring Hill — top-decile yield for the area; either an underpriced asset or a hidden risk that comps aren't pricing in. Stress-test before assuming the spread holds.
Location & tenants
- Location reads 63/100 on livability (#738 in FL) — a middle-class / working-renter tenant base. Strengths: cost of living A+, housing A+; Watch: health & safety C-, employment D+, amenities F.
- Hernando (suburban): math 50% / reading 50% proficiency, ranked #38 of 73 in FL (top 52%) — acceptable for families but not a draw, mixed tenant base, ~2y average lease.
- Zoned schools: John D. Floyd Elementary School (math 43% / reading 53%, grade D, #1,171 of 2,144 statewide, top 55%, 948 students, 63% FRL); Powell Middle School (math 54% / reading 50%, grade C+, #217 of 571 statewide, top 40%, 1,004 students, 50% FRL); Central High School (math 34% / reading 44%, grade F, #312 of 667 statewide, top 48%, 1,426 students, 53% FRL) — zoned schools at 55% FRL track the district average.
- Market conditions: Rents falling (-4.8%/yr); 742 active listings in the ZIP; 11 comparable units currently listed for rent nearby; rentals at typical pace (median 24d on market — plan ~3-4 weeks tenant-placement turnaround); solid renter incomes; 2,505 units permitted in Hernando County in 2024 (318 in 5+ unit buildings).
- This rent runs 31% of the median local income ($79k/yr) — at the standard rent-burdened threshold; future hikes will face affordability resistance.
Forward outlook
- Local home prices are declining (-3.0%/yr); year-one equity from $2k of loan paydown is wiped out by about $7k of value loss. Plan a longer hold.
- Hernando County population projected at +11% by 2050 — modest demand growth; plan on rents tracking national, not racing it.
Negotiation context
- It's been on market 16 days — a 2% lower offer ($231k) is reasonable based on typical stale-listing flexibility.
- 3 sale attempts since 3y ago with the ask held roughly flat each time — persistent listings suggest the price (not the market) is what's stuck; bring a comps-based counter.
Risks & watch-outs
- Climate carrying-cost: severe wind risk, 99% chance of damaging wind over 30y; extreme-heat days projected 7→25/yr by 2055 (HVAC capex compounding) — expect insurance premiums to compound above CPI over the hold.
Questions for the listing agent
- Is there a deadline driving the sale (1031 exchange, divorce, estate, relocation)? That informs how much negotiation room exists.
- The area grade is low — what's the realistic commute time and amenity access for the typical tenant pool here? Any planned neighborhood developments (good or bad) we should know about?
- What's the average days-on-market for RENTAL listings here right now (not sales)? A rising rental-DOM trend means longer vacancies and softer asking-rent achievability than the comps imply.
- What's the recent tenant-quality profile in this submarket — average credit score on applications, eviction rate, late-payment / NSF rate, and stable-employment percentage? A property-management company in the area should have these aggregated.
- How much new for-sale + rental construction is in the pipeline within 1–3 miles? Heavy new supply typically softens prices + rents 12–24 months out; constrained supply supports both.
Investment metrics
- 1% rule
- 0.88% ✗
- Cap rate
- 6.30%
- Cash-on-cash
- 0.03%
- DSCR
- 1.00
- GRM
- 9.5
CMA / ARV
- ARV (on-the-fly)
- $278,300
- Comps found
- 12
Show comp detail 12 sales within ~0.75 mi
| Address | Dist | Beds/Ba | Sqft | Sold | Price | $/sf | Match |
|---|---|---|---|---|---|---|---|
| 14049 Candia St | 0.41mi | 3/2.0 | 1,268 (+5%) | 2mo | $300,000 | $237 | 71 |
| 14183 Pomona Ave | 0.41mi | 3/2.0 | 1,152 (-5%) | 3mo | $207,000 | $180 | 70 |
| 3450 Dow Ln | 0.54mi | 3/2.0 | 1,260 (+4%) | 1mo | $292,000 | $232 | 67 |
| 13418 Candia St | 0.47mi | 3/2.0 | 1,152 (-5%) | 7mo | $258,000 | $224 | 65 |
| 3124 Dothan Ave | 0.35mi | 2/2.0 (-1) | 1,120 (-7%) | 3mo | $299,900 | $268 | 64 |
| 13295 Mitten Ln | 0.67mi | 3/2.0 | 1,237 (+2%) | 4mo | $320,000 | $259 | 62 |
| 14031 Barlington St | 0.53mi | 2/2.0 (-1) | 1,261 (+4%) | 6mo | $264,900 | $210 | 58 |
| 3482 Ambassador Ave | 0.64mi | 3/2.0 | 1,305 (+8%) | 0mo | $300,000 | $230 | 57 |
| 13294 Pinellas Ave | 0.53mi | 2/2.0 (-1) | 1,105 (-9%) | 2mo | $212,000 | $192 | 54 |
| 13740 Coronado Dr | 0.66mi | 3/2.0 | 1,340 (+11%) | 2mo | $307,000 | $229 | 50 |
| 14185 Barlington St | 0.57mi | 3/2.0 | 1,356 (+12%) | 8mo | $357,000 | $263 | 47 |
| 3034 Aldoro Ave | 0.66mi | 2/2.0 (-1) | 1,344 (+11%) | 3mo | $250,000 | $186 | 43 |
Match score weights: distance 35% · size 25% · config 20% · recency 20%. Top-matched comps best support the ARV.
Projected returns pro-forma
-3.0% appreciation · 0.0% rent growth · sell at horizon
- IRR
- -19.7%
- Equity multiple
- 0.33×
- Total profit
- $-43,974
- Equity at exit
- $35,024
- IRR
- -20.7%
- Equity multiple
- 0.07×
- Total profit
- $-61,421
- Equity at exit
- $20,310
Cash invested: $65,772 (down + closing). Projections, not guarantees.
Landlord ↔ Tenant lean methodology
- Overall (STATE)
- 87 Strongly Landlord-Friendly
- State Florida
- 87 Strongly Landlord-Friendly · R+3
- County
- — inherits STATE
- City
- — inherits STATE
ZIP-level market 34609
- Home prices YoY
- -23.2%
- Rents YoY
- -4.8%
- Active inventory
- 742
- Price-to-rent
- 9.5×
Monthly cashflow live
- Estimated rent
- $2,068 high interval (Pro) →
- Mortgage (P&I)
- −$1,232
- Tax from tax record
- −$302 /mo · $3,629/yr
- Insurance
- −$98
- HOA
- −$0
- Vacancy / Maint / Mgmt
- −$434
- Net cashflow
- $2
Break-even live
Sensitivity live
| Price | -10% $135 | -5% $68 | +0% $2 | +5% $-65 | +10% $-131 |
|---|---|---|---|---|---|
| Rent | -10% $-162 | -5% $-80 | +0% $2 | +5% $83 | +10% $165 |
| Rate | -1.0pp $120 | -0.5pp $62 | base $2 | +0.5pp $-59 | +1.0pp $-121 |
UW: 25.0% down · 7.5% · 30yr · 1.5% tax · 5.0% vac · 8.0% maint · 8.0% mgmt
Financing live
Cash to close
- Down payment
- $58,725
- Closing costs
- $7,047
- Reserves months
- —
- Total cash needed
- —
Loan-product check · same deal, 3 products live
Conventional
25% down · 7.5% · 30yr
- Down + closing
- —
- Monthly P&I
- —
- Monthly cashflow
- —
- DSCR
- —
- Eligible?
- —
Personal DTI + credit; lowest rate.
DSCR
20% down · 8.5% · 30yr
- Down + closing
- —
- Monthly P&I
- —
- Monthly cashflow
- —
- DSCR
- —
- Eligible?
- —
No personal income docs; deal must DSCR.
Hard money
10% down · 12.0% · 12mo
- Down + closing
- —
- Monthly P&I
- —
- Monthly cashflow
- —
- DSCR
- —
- Eligible?
- —
Short-term bridge; refi at stabilization.
Rent comps 11 comps
| Address | Beds | Baths | Sqft | Rent | $/sqft | DOM | Units | Dist |
|---|---|---|---|---|---|---|---|---|
| 14069 Drysdale St Spring Hill, FL | 3.0 | 2.0 | 1389 | $2,100 | $1.51 | 26d | 1 | 0.35mi |
| Hill Dr Spring Hill, FL | 2.0 | 2.0 | 950 | $2,000 | $2.11 | 26d | 1 | 0.47mi |
| 3280 Ambassador Ave Spring Hill, FL | 3.0 | 2.0 | 1268 | $1,780 | $1.40 | 1d | 1 | 0.67mi |
| 1811 Rookery Rd Spring Hill, FL | 3.0 | 2.0 | 1432 | $2,190 | $1.53 | 23d | 1 | 0.71mi |
| 14352 Pablo Blvd Spring Hill, FL | 2.0–3.0 | 2.0–2.5 | 1186 | $1,600 | $1.35 | 26d | 1 | 0.72mi |
| 4557 Homefield DR Spring Hill, FL | 2.0 | 2.0 | 1170 | $1,558 | $1.33 | 0d | 20 | 0.96mi |
| 3454 Suncoast Villa Way Spring Hill, FL | 1.0–3.0 | 1.0–2.0 | 1275 | $1,995 | $1.56 | 5d | 44 | 1.12mi |
| 13322 Golden Lime Ave Spring Hill, FL | 3.0 | 2.0 | 1405 | $2,200 | $1.57 | 1d | 1 | 1.17mi |
| 14059 Sullivan St Spring Hill, FL | 3.0 | 2.0 | 1349 | $1,795 | $1.33 | 26d | 1 | 1.18mi |
| 13346 Westbridge Blvd Spring Hill, FL | 3.0–4.0 | 2.0–3.0 | 1739 | $2,207 | $1.27 | 1d | 8 | 1.39mi |
| 3302 Coronet Ct Spring Hill, FL | 3.0 | 2.0 | 1432 | $2,120 | $1.48 | 26d | 1 | 1.44mi |
Listing history 11 events
-
2026-06-21days on market $234,900 Active 16 DOM
-
2026-06-18days on market $234,900 Active 13 DOM
-
2026-06-17days on market $234,900 Active 12 DOM
-
2026-06-16days on market $234,900 Active 11 DOM
-
2026-06-15days on market $234,900 Active 10 DOM
-
2026-06-13days on market $234,900 Active 8 DOM
-
2026-06-13days on market $234,900 Active 7 DOM
-
2026-06-09days on market $234,900 Active 4 DOM
-
2026-06-08days on market $234,900 Active 3 DOM
-
2026-06-07remarks 699-char remark
-
2026-06-07$234,900 Active 2 DOM
ⓘ Source: listings_history table (triggers on properties + properties_extension) + one-shot
backfill from property_details.listing_events for pre-trigger history.
Tax reassessment forecast FL · Resets to sale price
- Current annual tax
- $3,629 · $302/mo
- Projected year-2 tax
- $3,629 · $302/mo
- Expected delta
- $0/yr ($0/mo · 0.0%)
ⓘ Screening estimate from a state-policy table — verify with the county assessor before closing.
Climate risk First Street
- Flood 1/10 Low FEMA zone X (unshaded) · 0% chance over 30 yrs
- Wildfire 4/10 Moderate
- Heat 10/10 Extreme 7 d/yr ≥109°F today · 25 d/yr by 30 yrs out
- Wind 10/10 Extreme 99% chance of damaging wind over 30 yrs
- Air quality 2/10 Low 2 unhealthy d/yr today · 2 by 30 yrs out
Nearby sold comps map
Loading sold comps map…
Walkable amenities ~0.75 mi
Loading nearby amenities…
Taxation est. · year 1
- Rental income
- $24,819
- − Mortgage interest
- −$13,158
- − Property taxes
- −$3,629
- − Insurance
- −$1,174
- − Repairs & maintenance
- −$1,986
- − Management
- −$1,986
- − Depreciation
- −$6,833
- Taxable loss
- −$3,947
- Est. tax savings @ 24.0%
- +$947
- After-tax cash flow
- $969/yr
For passive investors: Depreciation is non-cash, so a rental often shows a tax loss while cash-flowing — sheltering income. Rental losses are passive: they offset passive income freely, and up to $25,000/yr can offset ordinary (W-2) income if you actively participate and your MAGI is under $100k (phasing out to $0 by $150k); unused losses carry forward. On sale, claimed depreciation is recaptured at up to 25%, and gains may owe capital-gains tax (a 1031 exchange can defer both). Figures are a year-1 estimate at your 24.0% rate — not tax advice; consult a CPA.
Schools (NCES district)
- District
- Hernando
- NCES district ID
- 1200810
- Math proficiency
- 50% ▼ -8.00%
- Reading proficiency
- 50% ▼ -4.00%
- Median HH income
- $41,985
- Composite
- 42.03/100
- National rank
- #3329
- State rank
- #38 of 73 in FL
Livability — Spring Hill
- Score
- 63/100
- State rank
- #738
- US rank
- #15937
Category grades
Schools grade is shown separately in the Schools card above.
Census & demographics
- Census place
- Spring Hill, FL
- County
- Hernando County · 169,677 people
- City population
- 83,915
- Metro
- Tampa-St. Petersburg-Clearwater, FL
- Population (ZIP)
- 47,257
- Household income
- $79,442
- Rent vs Own
- Severe rent burden
- 663.0
Population outlook (Hernando County) Hauer SSP2
- Today (2025)
- 189,218 people
- By 2030
- 194,367 · +2.7%
- By 2040
- 203,398 · +7.5%
- By 2050
- 209,589 · +10.8%
- By 2075
- 218,452 · +15.4%
- By 2100
- 205,923 · +8.8%
Race, ethnicity, and origin ACS 2023
- Neighborhood character
- Predominantly White (65%)
- Race & ethnicity
- White 65% Hispanic / Latino 22% Two or more races 13% Black 6% Asian 3%
- Hispanic origin (detail)
- Mexican 2% Puerto Rican 12% Cuban 3%
- Common ancestry
- Romanian 4% Lithuanian 2% Slovak 1%
- Foreign-born
- 11% · Canada, Jamaica, Philippines
- Languages at home
- 81% English-only · Spanish 15% Other Asian/Pacific 1% Other Indo-European 1%
Political lean MEDSL · Hernando
- 2024 margin
- Solid R (+37.0) · D 31.1% · R 68.2%
- 2008→2024 swing
- -33.5pp toward R · 2008: -3.6pp · 2024: -37.0pp
- All cycles
- 2024: R+37.0 2020: R+30.2 2016: R+29.0 2012: R+8.5 2008: R+3.6
Not yet ingested
- Civics
- —
Market trends
- HPI YoY
- ▼ -86.49%
- Current HPI
- 286.5885
- Rent YoY
- ▼ -4.82%
- Metro
- Tampa-St. Petersburg-Clearwater, FL
- State GDP YoY
- ▲ 3.28%
- F500 in state
- 36
Industry mix (Fortune 500 HQ in FL)
| Industry | F500 HQs | Revenue |
|---|---|---|
| Industrial Technology | 2 | $29B |
|
||
| Insurance | 2 | $17B |
|
||
| Retail | 1 | $60B |
|
||
| Technology Distribution | 1 | $58B |
|
||
| Homebuilding | 1 | $35B |
|
||
| Technology Manufacturing | 1 | $35B |
|
||
Price history
+192.2% since first listed8 events — show timeline
- 2026-06-05 Listed $234,900 Stellar MLS as Distributed by MLS Grid
- 2026-06-04 Listed $234,900 HCAR
- 2023-11-28 Sold (Public Records) $256,000 Public Records
- 2023-11-22 Sold (MLS) $256,000 Stellar MLS as Distributed by MLS Grid
- 2023-10-30 Pending — Stellar MLS as Distributed by MLS Grid
- 2023-10-19 Listed $256,000 Stellar MLS as Distributed by MLS Grid
- 2023-10-06 Sold (Public Records) $228,300 Public Records
- 2016-02-08 Sold (Public Records) $80,400 Public Records
Property tax history
+10.2%/yrLatest (2025): $3,629 · +3.8% YoY. Source: county tax records.
Cash-flow waterfall
monthlySold comps — $/sqft
last 12 mo · ≤1 miLoading sold comps…