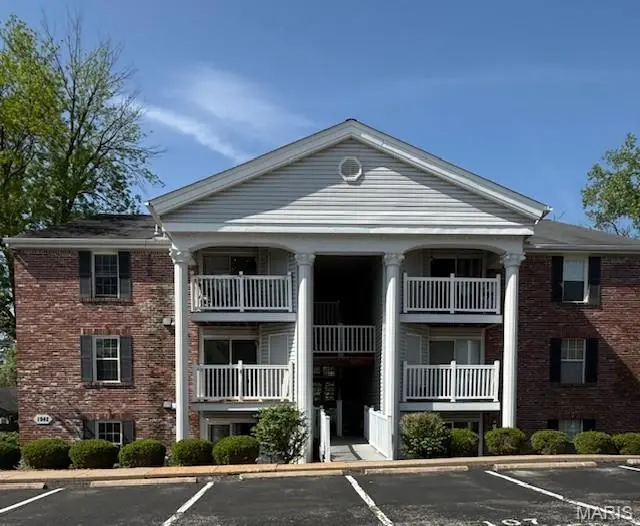
1942 Marine Terrace Dr Unit G · Maryland Heights, MO
Flood risk 1/10 · Minimal
- FEMA flood zone
- X (unshaded)
- Chance of flooding over 30 yrs
- 0.0%
- Est. flood insurance / yr
- $507 – $1,088
Fire risk 1/10 · Minimal
- Est. fire insurance / yr
- $1,054 – $1,958
Heat risk 5/10 · Moderate
- Hot days now (above 106°F)
- 7 days/yr
- Hot days in 30 yrs
- 21 days/yr
Wind risk 2/10 · Minimal
- Chance of severe wind over 30 yrs
- 1.0%
Air-quality risk 2/10 · Minimal
- Unhealthy air days now
- 2 days/yr
- Unhealthy air days in 30 yrs
- 2 days/yr
Risk factors via First Street. Map © Google.
Why this score? — see what drove the C- grade
The composite is a weighted blend of 9 inputs, each scored 0–100. Each bar is that input's sub-score; the figure is the points it added to the 100-point composite (weight × sub-score).
- Cash flow +13.6/30.0
- Appreciation +10.0/10.0
- 1% rule +5.3/10.0
- ARV discount +5.2/15.0
- Schools +5.1/10.0
- DSCR +4.1/10.0
- Livability +3.6/5.0
- Condition / age +2.5/5.0
- Rent growth +1.8/5.0
$155,000
🖨 Deal sheet 📄 Offer letter ✓ Due diligence
Listing remarks
Great Location! This charming and spacious 2 Bedroom 2 full Baths condo offers the perfect blend of comfort and convenience. Located in a desirable westcounty community. Near Creve Coeur Lake and convenient access to major highways, and shopping centers. JUST UPDATED WITH NEW FLOORS AND FRESH PAINT THROUGHOUT. BRAND NEW APPLIANCES (FRIG 1 YR OLD) AND KITCHEN COUNTER, W/ D 2 YRS OLD, HVAC 1.5 YRS OLD. .. READY TO MOVE IN. Unit location: 2nd floor.
Key facts
- New floors
- Creve coeur lake
- Shopping centers
Tags
Property features AI
Finance
- HOA & community: HOA managed by AMC Management LLC; Monthly HOA fee of $270; HOA covers pool, sewer, snow removal, trash and water; Community pool
Exterior
- Utilities: Public water; Public sewer; Electric service by Ameren
- Home design: Residential condominium; One level
- Construction: Vinyl siding
- Exterior features: Porch; In-ground pool; Many trees; Street lights (community)
Interior
- Kitchen: Dishwasher; Disposal; Microwave; Electric range; Refrigerator
- Bedrooms: 2 bedrooms on the main level
- Flooring: Carpet
- Bathrooms: 2 full bathrooms on the main level
- Heating & cooling: Forced air heating (natural gas); Central air conditioning
- Interior features: Open floorplan; Kitchen/dining room combo; Pantry
- Laundry & utility: Washer/dryer stacked (main level); Dryer; Gas water heater
Neighborhood map
What this means for you Summary
Snapshot
- This is a 2-bed/2.0-bath condo listed at $155k.
Deal economics
- At list price, monthly cash flow is $9 ($106/yr) — positive.
- The deal already cash-flows at list — no discount required.
- Meets the 1% rule at list price ($2k rent vs $155k).
- Recommended offer: $150k (3.0% below list) — sets the bar for market timing.
- Cap rate 6.4% vs local median 4.3% in Maryland Heights — top-decile yield for the area; either an underpriced asset or a hidden risk that comps aren't pricing in. Stress-test before assuming the spread holds.
Location & tenants
- Location reads 71/100 on livability (#101 in MO) — a middle-class / working-renter tenant base. Strengths: cost of living A+, housing A+, crime A-; Watch: health & safety C-, amenities F, commute F.
- Parkway C-2 (suburban): math 49% / reading 62% proficiency, ranked #18 of 324 in MO (top 6%) — acceptable for families but not a draw, mixed tenant base, ~2y average lease; only 14% free/reduced lunch — higher-income household profile.
- Zoned schools: Mckelvey Primary (234 students, 8% FRL); North High (math 35% / reading 70%, grade C-, #89 of 521 statewide, top 17%, 1,074 students, 34% FRL).
- Market conditions: Rents soft (-3.0%/yr); 170 active listings in the ZIP; 8 comparable units currently listed for rent nearby; rentals leasing fast (median 2d on market — plan ~1-2 weeks tenant-placement turnaround); solid renter incomes; 920 units permitted in St. Louis County in 2024 (250 in 5+ unit buildings).
Forward outlook
- In year one you build about $17k of equity ($1k loan paydown + $16k appreciation (10.0% local appreciation)).
- At projected returns (10.0% appreciation + 0.0% rent growth), your $43k cash investment doubles in ~3 years — after that, you're playing with house money.
- By year 3, paydown + projected appreciation supports a ~$42k cash-out refi (75% LTV) — recoverable capital for the next deal without selling this one.
Negotiation context
- It's been on market 55 days — a 3% lower offer ($150k) is reasonable based on typical stale-listing flexibility.
- Current owner paid $88k; list at $155k implies a 77% gain — meaningful room to come down on a strong offer.
Risks & watch-outs
- Climate carrying-cost: extreme-heat days projected 7→21/yr by 2055 (HVAC capex compounding) — expect insurance premiums to compound above CPI over the hold.
Questions for the listing agent
- It's been on market 55 days. Have you received any prior offers? Is the seller open to a 3% concession, seller financing, or rate buy-down credit?
- What does the HOA fee cover, when was the last increase, and are there any pending special assessments or reserve-fund shortfalls?
- Any open or pending special assessments — roof, HVAC, plumbing, elevator, façade? What's the per-unit balance and payoff schedule, and is the seller paying it off at close or rolling it to the buyer?
- Is there a deadline driving the sale (1031 exchange, divorce, estate, relocation)? That informs how much negotiation room exists.
- Schools are B-rated — typically a magnet for longer-tenancy family renters. What's the average tenant stay here, and is there a school-zone premium baked into asking?
- What's the average days-on-market for RENTAL listings here right now (not sales)? A rising rental-DOM trend means longer vacancies and softer asking-rent achievability than the comps imply.
- What's the recent tenant-quality profile in this submarket — average credit score on applications, eviction rate, late-payment / NSF rate, and stable-employment percentage? A property-management company in the area should have these aggregated.
- How much new apartment / multifamily construction is in the pipeline within 1–3 miles? Heavy new supply (>2% of stock underway) typically softens rents 12–24 months out; light construction supports rent growth.
Investment metrics
- 1% rule
- 1.03% ✓
- Cap rate
- 6.36%
- Cash-on-cash
- 0.24%
- DSCR
- 1.01
- GRM
- 8.1
CMA / ARV
- ARV (median comp)
- $147,612
- List price
- $155,000
- Delta
- 5.01%
- Verdict
- FAIR
- Comps
- 20 within 1.0 mi
Projected returns pro-forma
10.0% appreciation · 0.0% rent growth · sell at horizon
- IRR
- 23.3%
- Equity multiple
- 2.85×
- Total profit
- $80,431
- Equity at exit
- $139,636
- IRR
- 20.0%
- Equity multiple
- 6.26×
- Total profit
- $228,297
- Equity at exit
- $301,131
Cash invested: $43,400 (down + closing). Projections, not guarantees.
Landlord ↔ Tenant lean methodology
- Overall (STATE)
- 81 Strongly Landlord-Friendly
- State Missouri
- 81 Strongly Landlord-Friendly · R+10
- County
- — inherits STATE
- City
- — inherits STATE
ZIP-level market 63146
- Home prices YoY
- 4.9%
- Rents YoY
- -3.0%
- Active inventory
- 170
- Price-to-rent
- 8.1×
Monthly cashflow live
- Estimated rent
- $1,599 high interval (Pro) →
- Mortgage (P&I)
- −$813
- Tax from tax record
- −$107 /mo · $1,279/yr
- Insurance
- −$65
- HOA
- −$270
- Vacancy / Maint / Mgmt
- −$336
- Net cashflow
- $9
Break-even live
UW: 25.0% down · 7.5% · 30yr · 1.5% tax · 5.0% vac · 8.0% maint · 8.0% mgmt
Financing live
Cash to close
- Down payment
- $38,750
- Closing costs
- $4,650
- Reserves months
- —
- Total cash needed
- —
Loan-product check · same deal, 3 products live
Conventional
25% down · 7.5% · 30yr
- Down + closing
- —
- Monthly P&I
- —
- Monthly cashflow
- —
- DSCR
- —
- Eligible?
- —
Personal DTI + credit; lowest rate.
DSCR
20% down · 8.5% · 30yr
- Down + closing
- —
- Monthly P&I
- —
- Monthly cashflow
- —
- DSCR
- —
- Eligible?
- —
No personal income docs; deal must DSCR.
Hard money
10% down · 12.0% · 12mo
- Down + closing
- —
- Monthly P&I
- —
- Monthly cashflow
- —
- DSCR
- —
- Eligible?
- —
Short-term bridge; refi at stabilization.
Rent comps 8 comps
| Address | Beds | Baths | Sqft | Rent | $/sqft | DOM | Units | Dist |
|---|---|---|---|---|---|---|---|---|
| 2037 Chablis Dr Saint Louis, MO | 1.0–2.0 | 1.0–1.5 | 780 | $1,588 | $2.04 | 2d | 68 | 0.19mi |
| 2207 Summerhouse Dr St. Louis, MO | 1.0–3.0 | 1.0–2.0 | 804 | $1,304 | $1.62 | 3d | 21 | 0.53mi |
| 1951 Oberlin Dr St. Louis, MO | 1.0–3.0 | 1.0–2.5 | 993 | $1,684 | $1.70 | 2d | 23 | 0.54mi |
| 1895 Boulder Springs Dr St. Louis, MO | 1.0–3.0 | 1.0–2.5 | 1083 | $2,258 | $2.09 | 2d | 6 | 0.93mi |
| 12401 Boulder Springs Pkwy St. Louis, MO | 1.0–3.0 | 1.0–2.0 | 1006 | $2,294 | $2.28 | 2d | 10 | 1.01mi |
| 2050 Lakerun Ct Maryland Heights, MO | 1.0–3.0 | 1.0–2.5 | 1213 | $1,615 | $1.33 | 2d | 15 | 1.03mi |
| 1432 Glenmeade Dr Maryland Heights, MO | 3.0 | 2.0 | 1090 | $2,176 | $2.00 | 10d | 1 | 1.09mi |
| 12545 Markaire Dr St. Louis, MO | 1.0–3.0 | 1.0–4.0 | 1420 | $2,188 | $1.54 | 10d | 5 | 1.18mi |
HOA detail condo
- Monthly dues
- $270 · $3,240/yr
- Assessments
- None detected in remarks — confirm with the listing agent.
Listing history 17 events
-
2026-06-18days on market $155,000 Active 55 DOM
-
2026-06-17days on market $155,000 Active 54 DOM
-
2026-06-16days on market $155,000 Active 53 DOM
-
2026-06-15days on market $155,000 Active 52 DOM
-
2026-06-13days on market $155,000 Active 50 DOM
-
2026-06-13days on market $155,000 Active 49 DOM
-
2026-06-09days on market $155,000 Active 46 DOM
-
2026-06-08days on market $155,000 Active 45 DOM
-
2026-06-07days on market $155,000 Active 44 DOM
-
2026-06-03days on market $155,000 Active 40 DOM
-
2026-06-02days on market $155,000 Active 39 DOM
-
2026-06-01days on market $155,000 Active 38 DOM
-
2026-05-31days on market $155,000 Active 37 DOM
-
2026-04-24$155,000 Active 450-char remark
-
2003-02-11soldstatus $87,500
-
2001-01-19soldstatus $78,900
-
1989-01-01soldstatus
ⓘ Source: listings_history table (triggers on properties + properties_extension) + one-shot
backfill from property_details.listing_events for pre-trigger history.
Tax reassessment forecast MO · Resets to sale price
- Current annual tax
- $1,279 · $107/mo
- Projected year-2 tax
- $1,504 · $125/mo
- Expected delta
- +$224/yr (+$19/mo · 17.5%)
ⓘ Screening estimate from a state-policy table — verify with the county assessor before closing.
Climate risk First Street
- Flood 1/10 Low FEMA zone X (unshaded) · 0% chance over 30 yrs
- Wildfire 1/10 Low
- Heat 5/10 Major 7 d/yr ≥106°F today · 21 d/yr by 30 yrs out
- Wind 2/10 Low 100% chance of damaging wind over 30 yrs
- Air quality 2/10 Low 2 unhealthy d/yr today · 2 by 30 yrs out
Nearby sold comps map
Loading sold comps map…
Walkable amenities ~0.75 mi
Loading nearby amenities…
Taxation est. · year 1
- Rental income
- $19,183
- − Mortgage interest
- −$8,682
- − Property taxes
- −$1,279
- − Insurance
- −$775
- − Repairs & maintenance
- −$1,535
- − Management
- −$1,535
- − HOA
- −$3,240
- − Depreciation
- −$4,509
- Taxable loss
- −$2,372
- Est. tax savings @ 24.0%
- +$569
- After-tax cash flow
- $675/yr
For passive investors: Depreciation is non-cash, so a rental often shows a tax loss while cash-flowing — sheltering income. Rental losses are passive: they offset passive income freely, and up to $25,000/yr can offset ordinary (W-2) income if you actively participate and your MAGI is under $100k (phasing out to $0 by $150k); unused losses carry forward. On sale, claimed depreciation is recaptured at up to 25%, and gains may owe capital-gains tax (a 1031 exchange can defer both). Figures are a year-1 estimate at your 24.0% rate — not tax advice; consult a CPA.
Schools (NCES district)
- District
- Parkway C-2
- NCES district ID
- 2923580
- Math proficiency
- 49% ▼ -11.00%
- Reading proficiency
- 62% ▼ -2.00%
- Median HH income
- $83,551
- Composite
- 50.5/100
- National rank
- #1851
- State rank
- #18 of 324 in MO
Livability — Maryland Heights
- Score
- 71/100
- State rank
- #101
- US rank
- #6808
Category grades
Schools grade is shown separately in the Schools card above.
Census & demographics
- Census place
- Maryland Heights, MO
- County
- Saint Louis County · 888,823 people
- City population
- 20,932
- Metro
- St. Louis, MO-IL
- Population (ZIP)
- 30,678
- Household income
- $84,756
- Rent vs Own
- Severe rent burden
- 1156.0
Population outlook (St. Louis County) Hauer SSP2
- Today (2025)
- 1,025,227 people
- By 2030
- 1,028,023 · +0.3%
- By 2040
- 1,020,940 · -0.4%
- By 2050
- 1,007,280 · -1.8%
- By 2075
- 987,277 · -3.7%
- By 2100
- 921,984 · -10.1%
Race, ethnicity, and origin ACS 2023
- Neighborhood character
- Diverse neighborhood (Simpson 0.56)
- Race & ethnicity
- White 63% Asian 17% Black 13% Two or more races 4% Hispanic / Latino 3%
- Common ancestry
- Scotch-Irish 3% Romanian 3% Italian 2%
- Foreign-born
- 19% · China, South Korea, Canada
- Languages at home
- 79% English-only · Other Asian/Pacific 7% Other Indo-European 4% Chinese 3%
Political lean MEDSL · St. Louis
- 2024 margin
- Strong D (+23.4) · D 60.8% · R 37.4% · Other 1.7%
- 2008→2024 swing
- +3.5pp toward D · 2008: 19.9pp · 2024: 23.4pp
- All cycles
- 2024: D+23.4 2020: D+24.0 2016: D+16.2 2012: D+13.7 2008: D+19.9
Not yet ingested
- Civics
- —
Market trends
- HPI YoY
- ▲ 33.10%
- Current HPI
- 711.49
- Rent YoY
- ▼ -2.96%
- Metro
- St. Louis, MO-IL
- State GDP YoY
- ▲ 1.84%
- F500 in state
- 20
Industry mix (Fortune 500 HQ in MO)
| Industry | F500 HQs | Revenue |
|---|---|---|
| Healthcare | 1 | $163B |
|
||
| Insurance | 1 | $21B |
|
||
| Industrial Technology | 1 | $17B |
|
||
| Retail | 1 | $16B |
|
||
| Industrial Distribution | 1 | $10B |
|
||
| Utilities | 1 | $9B |
|
||
Price history
+96.5% since first listed4 events — show timeline
- 2026-04-24 Listed $155,000 MARIS as Distributed by MLS Grid
- 2003-02-11 Sold (Public Records) $87,500 Public Records
- 2001-01-19 Sold (Public Records) $78,900 Public Records
- 1989-01-01 Sold (Public Records) — Public Records
Property tax history
+1.9%/yrLatest (2022): $1,279 · +0.7% YoY. Source: county tax records.
Cash-flow waterfall
monthlySold comps — $/sqft
last 12 mo · ≤1 miLoading sold comps…