 34-Plex
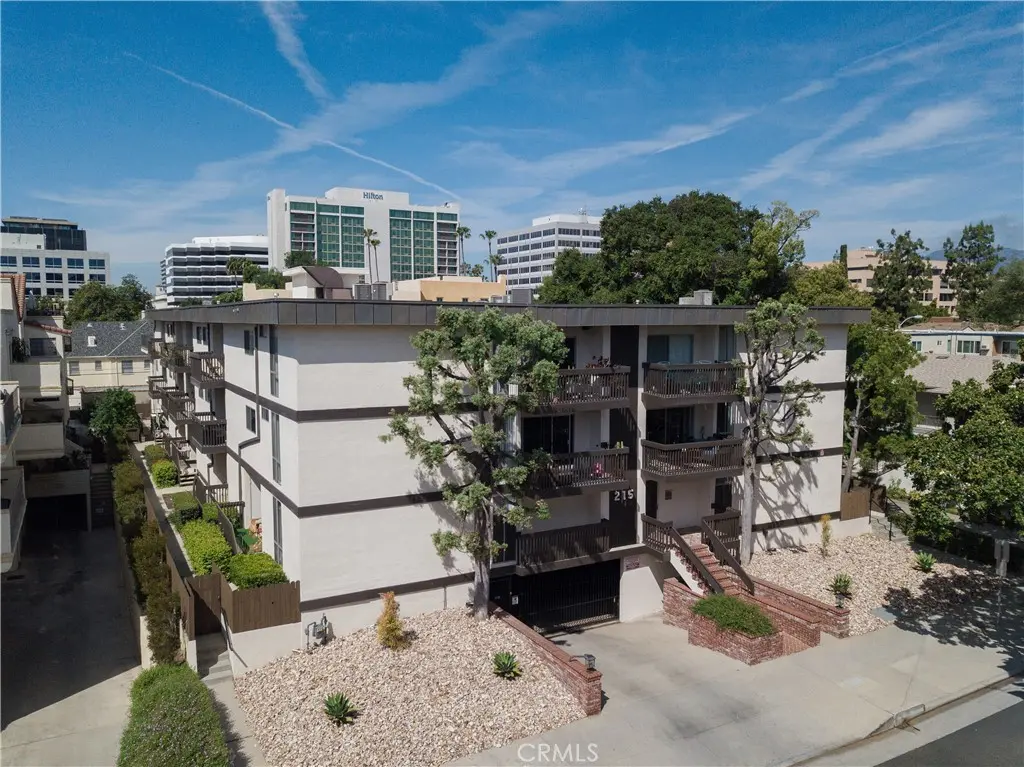
215 S Madison · Pasadena, CA
Flood risk 1/10 · Minimal
- FEMA flood zone
- X (unshaded)
- Chance of flooding over 30 yrs
- 0.0%
- Est. flood insurance / yr
- $507 – $1,088
Fire risk 1/10 · Minimal
- Est. fire insurance / yr
- $659 – $1,223
Heat risk 6/10 · Moderate
- Hot days now (above 98°F)
- 7 days/yr
- Hot days in 30 yrs
- 21 days/yr
Wind risk 1/10 · Minimal
- Chance of severe wind over 30 yrs
- —
Air-quality risk 6/10 · Moderate
- Unhealthy air days now
- 10 days/yr
- Unhealthy air days in 30 yrs
- 10 days/yr
Risk factors via First Street. Map © Google.
Why this score? — see what drove the C grade
The composite is a weighted blend of 9 inputs, each scored 0–100. Each bar is that input's sub-score; the figure is the points it added to the 100-point composite (weight × sub-score).
- Cash flow +20.0/30.0
- ARV discount +7.5/15.0
- DSCR +6.3/10.0
- Appreciation +5.5/10.0
- Schools +4.6/10.0
- 1% rule +4.1/10.0
- Livability +3.6/5.0
- Rent growth +2.5/5.0
- Condition / age +2.5/5.0
$11,500,000
🖨 Deal sheet 📄 Offer letter ✓ Due diligence
Multi-family units
County records classify this as Multi-Family (5+ Unit). Listing-text estimate: 34 units. confirmed
5+ unit building — per-unit beds/baths from public records are typically unavailable; the breakdown below (if shown) is an estimate from the listing text.
Listing remarks
Madison Luxury Apartments presents a rare opportunity to acquire a meticulously maintained 34-unit apartment community in the heart of Pasadena, ideally positioned between the highly desirable Madison Heights and Playhouse Village neighborhoods. Offered for sale for the first time since its original construction, this trophy asset features an attractive mix of spacious one-bedroom/one-bathroom and two-bedroom/two-bathroom residences with private balconies or patios, semi-subterranean parking, and a rooftop recreation area showcasing panoramic views of Old Pasadena and the San Gabriel Mountains. The property has benefited from significant capital improvements, including a new roof (2020), al
Key facts
- Remodeled elevator
- New roof
- 0.44 acre lot
Tags
Property features AI
Finance
- Financial info: Total building area: 34,815; Total # of units: 34; Gross scheduled income: $964,753; Gross income: $935,811; Net operating income: $644,220; Operating expenses: $291,591; Unit-level example rents: 1-bed actual $2,221; 2-bed actual $2,730; select 2-bed unit actual $3,295
- HOA & community: Subject to rent control
Exterior
- Parking: 25 uncovered spaces; 25 carport spaces; 50 total parking spaces
- Utilities: Public sewer; District/public water; 1 separate water meter; 1 separate gas meter; 34 separate electric meters
- Home design: Community apartment (attached property); 3 stories; Irregular lot shape
- Construction: One building
- Exterior features: No pool; Sidewalks in the community
Interior
- Bedrooms: 1-bedroom units (27 units); 2-bedroom units (6 units); 2-bedroom unit with 2 baths + 1 half-bath (1 unit)
- Bathrooms: 1-bath units; 2-bath units; Units with full and half-bath configurations
- Interior features: Entry on level 1; Has laundry area
- Laundry & utility: Shared laundry area
Neighborhood map
What this means for you Summary
Snapshot
- This is a 17×1bd/1.0ba + 17×2bd/2.0ba units multifamily listed at $11.50M.
Deal economics
- At list price, monthly cash flow is $14k ($170k/yr) — positive. Per door: $417/mo.
- The deal already cash-flows at list — no discount required.
- To meet the 1% rule (rent ≥ 1% of price), the offer needs to be $10.52M (8.5% below list).
- Recommended offer: $10.52M (8.5% below list) — sets the bar for 1% rule.
- Cap rate 7.8% vs local median 1.5% in Pasadena — top-decile yield for the area; either an underpriced asset or a hidden risk that comps aren't pricing in. Stress-test before assuming the spread holds.
Location & tenants
- Location reads 72/100 on livability (#181 in CA) — a middle-class / working-renter tenant base. Strengths: amenities A+, commute A+, employment A+; Watch: schools D+, health & safety D+, crime F.
- Pasadena Unified (urban): math 42% / reading 60% proficiency, ranked #123 of 517 in CA (top 24%) — acceptable for families but not a draw, mixed tenant base, ~2y average lease.
- Market conditions: Rents flat; 82 active listings in the ZIP; solid renter incomes; 19,697 units permitted in Los Angeles County in 2024 (9,426 in 5+ unit buildings).
- At $105,173/mo this rent would consume 1437% of the median local household income ($88k/yr) (locally 2327% of renters already pay >50% of income on rent) — very limited rent-growth headroom before tenants either downsize or default.
Forward outlook
- In year one you build about $205k of equity ($80k loan paydown + $125k appreciation (1.1% local appreciation)).
- Los Angeles County population projected at +9% by 2050 — modest demand growth; plan on rents tracking national, not racing it.
- At projected returns (1.1% appreciation + 0.0% rent growth), your $3.22M cash investment doubles in ~9 years — after that, you're playing with house money.
- By year 4, paydown + projected appreciation supports a ~$739k cash-out refi (75% LTV) — recoverable capital for the next deal without selling this one.
Negotiation context
- Only 13 days on market — expect competitive offers; lowballing is unlikely to land.
- 4 sale attempts since 2y ago with the ask held roughly flat each time — persistent listings suggest the price (not the market) is what's stuck; bring a comps-based counter.
Risks & watch-outs
- Climate carrying-cost: extreme-heat days projected 7→21/yr by 2055 (HVAC capex compounding) — expect insurance premiums to compound above CPI over the hold.
Questions for the listing agent
- Can we see the unit-by-unit rent roll, current vacancy, and any below-market leases? What's the average tenancy length?
- What capital expenditures (roof, boiler, parking lot, exteriors) have been made in the last 5 years, and what's planned in the next 2?
- Built in 1972 — when were the roof, HVAC, electrical panel, plumbing, and water heater last replaced?
- Is there a deadline driving the sale (1031 exchange, divorce, estate, relocation)? That informs how much negotiation room exists.
- Schools are D-rated, which usually means shorter tenancies and higher turnover. Who's the typical renter profile here, and what's been the actual vacancy rate?
- Crime grade is F in this area — have there been break-ins, vandalism, or insurance claims at this property in the last 3 years? What carrier currently insures it and at what premium?
- What's the average days-on-market for RENTAL listings here right now (not sales)? A rising rental-DOM trend means longer vacancies and softer asking-rent achievability than the comps imply.
- What's the recent tenant-quality profile in this submarket — average credit score on applications, eviction rate, late-payment / NSF rate, and stable-employment percentage? A property-management company in the area should have these aggregated.
- How much new apartment / multifamily construction is in the pipeline within 1–3 miles? Heavy new supply (>2% of stock underway) typically softens rents 12–24 months out; light construction supports rent growth.
Investment metrics
- 1% rule
- 0.91% ✗
- Cap rate
- 7.77%
- Cash-on-cash
- 5.28%
- DSCR
- 1.23
- GRM
- 9.1
CMA / ARV
No comps found within radius.
Projected returns pro-forma
1.09% appreciation · 0.02% rent growth · sell at horizon
- IRR
- 5.3%
- Equity multiple
- 1.27×
- Total profit
- $856,518
- Equity at exit
- $3,979,749
- IRR
- 7.9%
- Equity multiple
- 1.91×
- Total profit
- $2,925,570
- Equity at exit
- $5,330,611
Cash invested: $3,220,000 (down + closing). Projections, not guarantees.
Landlord ↔ Tenant lean methodology
- Overall (STATE)
- 18 Strongly Tenant-Friendly
- State California
- 18 Strongly Tenant-Friendly · D+13
- County
- — inherits STATE
- City
- — inherits STATE
ZIP-level market 91101
- Home prices YoY
- 0.3%
- Rents YoY
- 0.0%
- Active inventory
- 82
- Price-to-rent
- 322.0×
Monthly cashflow live
- Estimated rent
- $105,173 high interval (Pro) →
- Mortgage (P&I)
- −$60,307
- Tax from tax record
- −$3,826 /mo · $45,911/yr
- Insurance
- −$4,792
- HOA
- −$0
- Vacancy / Maint / Mgmt
- −$22,086
- Net cashflow
- $14,162
Break-even live
34-unit breakdown (identical units grouped — click to expand)
| Units | Beds | Baths | Est. rent |
|---|---|---|---|
| 17× units | 1 | 1 | $50,592 |
| #1 | 1 | 1 | $2,976 |
| #2 | 1 | 1 | $2,976 |
| #3 | 1 | 1 | $2,976 |
| #4 | 1 | 1 | $2,976 |
| #5 | 1 | 1 | $2,976 |
| #6 | 1 | 1 | $2,976 |
| #7 | 1 | 1 | $2,976 |
| #8 | 1 | 1 | $2,976 |
| #9 | 1 | 1 | $2,976 |
| #10 | 1 | 1 | $2,976 |
| #11 | 1 | 1 | $2,976 |
| #12 | 1 | 1 | $2,976 |
| #13 | 1 | 1 | $2,976 |
| #14 | 1 | 1 | $2,976 |
| #15 | 1 | 1 | $2,976 |
| #16 | 1 | 1 | $2,976 |
| #17 | 1 | 1 | $2,976 |
| 17× units | 2 | 2 | $54,587 |
| #18 | 2 | 2 | $3,211 |
| #19 | 2 | 2 | $3,211 |
| #20 | 2 | 2 | $3,211 |
| #21 | 2 | 2 | $3,211 |
| #22 | 2 | 2 | $3,211 |
| #23 | 2 | 2 | $3,211 |
| #24 | 2 | 2 | $3,211 |
| #25 | 2 | 2 | $3,211 |
| #26 | 2 | 2 | $3,211 |
| #27 | 2 | 2 | $3,211 |
| #28 | 2 | 2 | $3,211 |
| #29 | 2 | 2 | $3,211 |
| #30 | 2 | 2 | $3,211 |
| #31 | 2 | 2 | $3,211 |
| #32 | 2 | 2 | $3,211 |
| #33 | 2 | 2 | $3,211 |
| #34 | 2 | 2 | $3,211 |
| Total (34 units) | $105,173 | ||
UW: 25.0% down · 7.5% · 30yr · 1.5% tax · 5.0% vac · 8.0% maint · 8.0% mgmt
Financing live
Cash to close
- Down payment
- $2,875,000
- Closing costs
- $345,000
- Reserves months
- —
- Total cash needed
- —
Loan-product check · same deal, 3 products live
Conventional
25% down · 7.5% · 30yr
- Down + closing
- —
- Monthly P&I
- —
- Monthly cashflow
- —
- DSCR
- —
- Eligible?
- —
Personal DTI + credit; lowest rate.
DSCR
20% down · 8.5% · 30yr
- Down + closing
- —
- Monthly P&I
- —
- Monthly cashflow
- —
- DSCR
- —
- Eligible?
- —
No personal income docs; deal must DSCR.
Hard money
10% down · 12.0% · 12mo
- Down + closing
- —
- Monthly P&I
- —
- Monthly cashflow
- —
- DSCR
- —
- Eligible?
- —
Short-term bridge; refi at stabilization.
Listing history 10 events
-
2026-06-18days on market $11,500,000 Active 13 DOM
-
2026-06-17days on market $11,500,000 Active 12 DOM
-
2026-06-16days on market $11,500,000 Active 11 DOM
-
2026-06-15days on market $11,500,000 Active 10 DOM
-
2026-06-13days on market $11,500,000 Active 8 DOM
-
2026-06-13days on market $11,500,000 Active 7 DOM
-
2026-06-09days on market $11,500,000 Active 4 DOM
-
2026-06-08days on market $11,500,000 Active 3 DOM
-
2026-06-07remarks 699-char remark
-
2026-06-07$11,500,000 Active 2 DOM
ⓘ Source: listings_history table (triggers on properties + properties_extension) + one-shot
backfill from property_details.listing_events for pre-trigger history.
Tax reassessment forecast CA · Resets to sale price
- Current annual tax
- $45,911 · $3,826/mo
- Projected year-2 tax
- $87,400 · $7,283/mo
- Expected delta
- +$41,489/yr (+$3,457/mo · 90.4%)
ⓘ Screening estimate from a state-policy table — verify with the county assessor before closing.
Climate risk First Street
- Flood 1/10 Low FEMA zone X (unshaded) · 0% chance over 30 yrs
- Wildfire 1/10 Low
- Heat 6/10 Major 7 d/yr ≥98°F today · 21 d/yr by 30 yrs out
- Wind 1/10 Low
- Air quality 6/10 Major 10 unhealthy d/yr today · 10 by 30 yrs out
Nearby sold comps map
Loading sold comps map…
Walkable amenities ~0.75 mi
Loading nearby amenities…
Taxation est. · year 1
- Rental income
- $1,262,076
- − Mortgage interest
- −$644,179
- − Property taxes
- −$45,911
- − Insurance
- −$57,500
- − Repairs & maintenance
- −$100,966
- − Management
- −$100,966
- − Depreciation
- −$334,545
- Taxable loss
- −$21,991
- Est. tax savings @ 24.0%
- +$5,278
- After-tax cash flow
- $175,220/yr
For passive investors: Depreciation is non-cash, so a rental often shows a tax loss while cash-flowing — sheltering income. Rental losses are passive: they offset passive income freely, and up to $25,000/yr can offset ordinary (W-2) income if you actively participate and your MAGI is under $100k (phasing out to $0 by $150k); unused losses carry forward. On sale, claimed depreciation is recaptured at up to 25%, and gains may owe capital-gains tax (a 1031 exchange can defer both). Figures are a year-1 estimate at your 24.0% rate — not tax advice; consult a CPA.
Schools (NCES district)
- District
- Pasadena Unified
- NCES district ID
- 0629940
- Math proficiency
- 42% ▲ 7.00%
- Reading proficiency
- 60% ▲ 15.00%
- Median HH income
- $73,762
- Composite
- 45.82/100
- National rank
- #2557
- State rank
- #123 of 517 in CA
Livability — Pasadena
- Score
- 72/100
- State rank
- #181
- US rank
- #5981
Category grades
Schools grade is shown separately in the Schools card above.
Census & demographics
- Census place
- Pasadena, CA
- County
- Los Angeles County · 9,444,647 people
- City population
- 151,001
- Metro
- Los Angeles-Long Beach-Anaheim, CA
- Population (ZIP)
- 21,165
- Household income
- $87,813
- Rent vs Own
- Severe rent burden
- 2327.0
Population outlook (Los Angeles County) Hauer SSP2
- Today (2025)
- 10,940,515 people
- By 2030
- 11,256,481 · +2.9%
- By 2040
- 11,729,929 · +7.2%
- By 2050
- 11,948,407 · +9.2%
- By 2075
- 11,818,114 · +8.0%
- By 2100
- 10,842,928 · -0.9%
Race, ethnicity, and origin ACS 2023
- Neighborhood character
- Highly diverse neighborhood (Simpson 0.73)
- Race & ethnicity
- White 38% Hispanic / Latino 27% Asian 22% Two or more races 14% Black 7%
- Hispanic origin (detail)
- Mexican 18%
- Common ancestry
- Lithuanian 3% Scotch-Irish 2% Slovak 1%
- Foreign-born
- 30% · Canada, China, South Korea
- Languages at home
- 61% English-only · Spanish 19% Chinese 7% Other Indo-European 4%
Political lean MEDSL · Los Angeles
- 2024 margin
- Solid D (+32.9) · D 64.8% · R 31.9% · Other 3.3%
- 2008→2024 swing
- -7.4pp toward R · 2008: 40.4pp · 2024: 32.9pp
- All cycles
- 2024: D+32.9 2020: D+44.2 2016: D+48.0 2012: D+40.0 2008: D+40.4
Not yet ingested
- Civics
- —
Market trends
- HPI YoY
- ▲ 1.09%
- Current HPI
- 376.3436
- Rent YoY
- ▬ 0.02%
- Metro
- Los Angeles-Long Beach-Anaheim, CA
- State GDP YoY
- ▲ 3.21%
- F500 in state
- 116
Industry mix (Fortune 500 HQ in CA)
| Industry | F500 HQs | Revenue |
|---|---|---|
| Technology | 27 | $1,492B |
|
||
| Financial Services | 3 | $174B |
|
||
| Retail | 3 | $44B |
|
||
| Insurance | 3 | $26B |
|
||
| Media / Entertainment | 2 | $115B |
|
||
| Pharmaceuticals / Biotech | 2 | $62B |
|
||
Price history
+523818.0% since first listed8 events — show timeline
- 2026-06-05 Listed $11,500,000 CRMLS
- 2024-11-04 Rental Removed $2,850 RENTALBEAST
- 2024-10-18 Listed for Rent $2,850 RENTALBEAST
- 2024-09-14 Rental Removed $2,195 RENTALBEAST
- 2024-09-12 Rental Removed $2,195 RENTALBEAST
- 2024-09-07 Listed for Rent $2,195 RENTALBEAST
- 2024-09-05 Listed for Rent $2,195 RENTALBEAST
- 2022-05-30 Price Changed $2,195 RENT.
Property tax history
+2.0%/yrLatest (2025): $45,911 · +5.1% YoY. Source: county tax records.
Cash-flow waterfall
monthlySold comps — $/sqft
last 12 mo · ≤1 miLoading sold comps…