 68-Plex
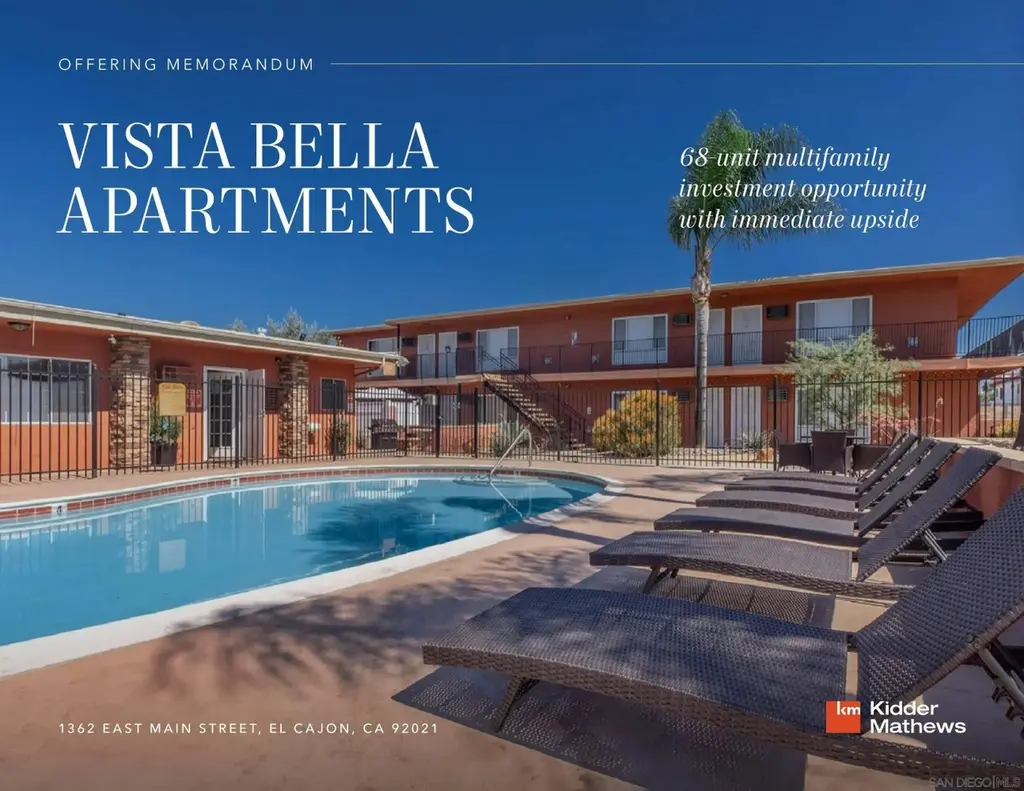
1362 E Main St · El Cajon, CA
Flood risk 3/10 · Minor
- FEMA flood zone
- X (shaded)
- Chance of flooding over 30 yrs
- 0.2%
- Est. flood insurance / yr
- $507 – $1,088
Fire risk 2/10 · Minimal
- Est. fire insurance / yr
- $659 – $1,223
Heat risk 6/10 · Moderate
- Hot days now (above 98°F)
- 7 days/yr
- Hot days in 30 yrs
- 20 days/yr
Wind risk 1/10 · Minimal
- Chance of severe wind over 30 yrs
- —
Air-quality risk 4/10 · Minor
- Unhealthy air days now
- 6 days/yr
- Unhealthy air days in 30 yrs
- 7 days/yr
Risk factors via First Street. Map © Google.
Why this score? — see what drove the B- grade
The composite is a weighted blend of 9 inputs, each scored 0–100. Each bar is that input's sub-score; the figure is the points it added to the 100-point composite (weight × sub-score).
- Cash flow +29.2/30.0
- DSCR +10.0/10.0
- 1% rule +7.6/10.0
- ARV discount +7.5/15.0
- Schools +4.0/10.0
- Livability +3.5/5.0
- Condition / age +2.5/5.0
- Rent growth +2.3/5.0
- Appreciation +0.0/10.0
$13,495,000
🖨 Deal sheet 📄 Offer letter ✓ Due diligence
Multi-family units
County records classify this as Multi-Family (5+ Unit). Listing-text estimate: 68 units. confirmed
5+ unit building — per-unit beds/baths from public records are typically unavailable; the breakdown below (if shown) is an estimate from the listing text.
Listing remarks
Located in El Cajon, the Property is a well-maintained 68-unit multifamily community originally constructed in 1975. The unit mix consists of 30 studio units, 37 one-bedroom/one-bathroom units, and one three-bedroom/two-bathroom unit, with 95 surface parking spaces. The Property has undergone several recent improvements, including upgrades to the pool area, outdoor fitness area and renovations to many unit interiors featuring vinyl plank flooring in wet areas, updated fixtures and lighting, new electrical outlets and switches, and mirrored closet doors. Community amenities include a gated swimming pool with lounge seating, outdoor fitness equipment, gated access, a gazebo with seating, ceil
Key facts
- 2.13 acre lot
- 95 parking spots
- Listed 13 days
Property features AI
Finance
- Other: Listing handled by San Diego Association of REALTORS; listing broker Eric D. Comer
Exterior
- Parking: 95 parking spaces
- Home design: Residential income property (Commercial-Residential Income subtype)
- Construction: Building area approximately 39,640; Lot size listed between 1.5 and 2.5 acres
- Exterior features: Approximately 2.13-acre lot; Zoned RM-2200
Interior
- Bathrooms: 69 full bathrooms
- Interior features: Contains multiple full bathrooms (69)
Neighborhood map
What this means for you Summary
Snapshot
- This is a 68 × 40-bed/69.0-bath units multifamily listed at $13.49M.
Deal economics
- At list price, monthly cash flow is $47k ($564k/yr) — positive. Per door: $691/mo.
- The deal already cash-flows at list — no discount required.
- Meets the 1% rule at list price ($170k rent vs $13.49M).
- Cap rate 10.5% vs local median 2.4% in El Cajon — top-decile yield for the area; either an underpriced asset or a hidden risk that comps aren't pricing in. Stress-test before assuming the spread holds.
Location & tenants
- Location reads 70/100 on livability (#230 in CA) — a middle-class / working-renter tenant base. Strengths: amenities A+, commute A+; Watch: health & safety C-, crime D+, cost of living F.
- Grossmont Union High (suburban): math 31% / reading 60% proficiency, ranked #173 of 517 in CA (top 34%) — families likely to look elsewhere, expect single-tenant / working-renter base with shorter leases; only 17% free/reduced lunch — higher-income household profile.
- Market conditions: Rents soft (-0.8%/yr); 238 active listings in the ZIP; 11,759 units permitted in San Diego County in 2024 (7,244 in 5+ unit buildings).
- At $170,182/mo this rent would consume 2759% of the median local household income ($74k/yr) (locally 4178% of renters already pay >50% of income on rent) — very limited rent-growth headroom before tenants either downsize or default.
Forward outlook
- Local home prices are declining (-3.0%/yr); year-one equity from $93k of loan paydown is wiped out by about $405k of value loss. Plan a longer hold.
- San Diego County population projected at +20% by 2050 — long-run rental-demand tailwind backs the buy-and-hold thesis.
Negotiation context
- Only 13 days on market — expect competitive offers; lowballing is unlikely to land.
- 2 sale attempts with the ask held roughly flat each time — persistent listings suggest the price (not the market) is what's stuck; bring a comps-based counter.
- Current owner paid $5.25M; list at $13.49M implies a 157% gain — meaningful room to come down on a strong offer.
Risks & watch-outs
- Climate carrying-cost: extreme-heat days projected 7→20/yr by 2055 (HVAC capex compounding) — expect insurance premiums to compound above CPI over the hold.
Questions for the listing agent
- Can we see the unit-by-unit rent roll, current vacancy, and any below-market leases? What's the average tenancy length?
- What capital expenditures (roof, boiler, parking lot, exteriors) have been made in the last 5 years, and what's planned in the next 2?
- Built in 1975 — when were the roof, HVAC, electrical panel, plumbing, and water heater last replaced?
- Is there a deadline driving the sale (1031 exchange, divorce, estate, relocation)? That informs how much negotiation room exists.
- Crime grade is D in this area — have there been break-ins, vandalism, or insurance claims at this property in the last 3 years? What carrier currently insures it and at what premium?
- What's the average days-on-market for RENTAL listings here right now (not sales)? A rising rental-DOM trend means longer vacancies and softer asking-rent achievability than the comps imply.
- What's the recent tenant-quality profile in this submarket — average credit score on applications, eviction rate, late-payment / NSF rate, and stable-employment percentage? A property-management company in the area should have these aggregated.
- How much new apartment / multifamily construction is in the pipeline within 1–3 miles? Heavy new supply (>2% of stock underway) typically softens rents 12–24 months out; light construction supports rent growth.
Investment metrics
- 1% rule
- 1.26% ✓
- Cap rate
- 10.47%
- Cash-on-cash
- 14.92%
- DSCR
- 1.66
- GRM
- 6.6
CMA / ARV
No comps found within radius.
Projected returns pro-forma
-3.0% appreciation · 0.0% rent growth · sell at horizon
- IRR
- 2.2%
- Equity multiple
- 1.08×
- Total profit
- $305,936
- Equity at exit
- $2,012,148
- IRR
- 8.7%
- Equity multiple
- 1.58×
- Total profit
- $2,188,175
- Equity at exit
- $1,166,801
Cash invested: $3,778,600 (down + closing). Projections, not guarantees.
Landlord ↔ Tenant lean methodology
- Overall (STATE)
- 18 Strongly Tenant-Friendly
- State California
- 18 Strongly Tenant-Friendly · D+13
- County
- — inherits STATE
- City
- — inherits STATE
ZIP-level market 92021
- Rents YoY
- -0.8%
- Active inventory
- 238
- Price-to-rent
- 449.4×
Monthly cashflow live
- Estimated rent
- $170,182 medium interval (Pro) →
- Mortgage (P&I)
- −$70,769
- Tax from tax record
- −$11,068 /mo · $132,811/yr
- Insurance
- −$5,623
- HOA
- −$0
- Vacancy / Maint / Mgmt
- −$35,738
- Net cashflow
- $46,984
Break-even live
68-unit breakdown (identical units grouped — click to expand)
| Units | Beds | Baths | Est. rent |
|---|---|---|---|
| 68× units | 40 | 69 | $170,204 |
| #1 | 40 | 69 | $2,503 |
| #2 | 40 | 69 | $2,503 |
| #3 | 40 | 69 | $2,503 |
| #4 | 40 | 69 | $2,503 |
| #5 | 40 | 69 | $2,503 |
| #6 | 40 | 69 | $2,503 |
| #7 | 40 | 69 | $2,503 |
| #8 | 40 | 69 | $2,503 |
| #9 | 40 | 69 | $2,503 |
| #10 | 40 | 69 | $2,503 |
| #11 | 40 | 69 | $2,503 |
| #12 | 40 | 69 | $2,503 |
| #13 | 40 | 69 | $2,503 |
| #14 | 40 | 69 | $2,503 |
| #15 | 40 | 69 | $2,503 |
| #16 | 40 | 69 | $2,503 |
| #17 | 40 | 69 | $2,503 |
| #18 | 40 | 69 | $2,503 |
| #19 | 40 | 69 | $2,503 |
| #20 | 40 | 69 | $2,503 |
| #21 | 40 | 69 | $2,503 |
| #22 | 40 | 69 | $2,503 |
| #23 | 40 | 69 | $2,503 |
| #24 | 40 | 69 | $2,503 |
| #25 | 40 | 69 | $2,503 |
| #26 | 40 | 69 | $2,503 |
| #27 | 40 | 69 | $2,503 |
| #28 | 40 | 69 | $2,503 |
| #29 | 40 | 69 | $2,503 |
| #30 | 40 | 69 | $2,503 |
| #31 | 40 | 69 | $2,503 |
| #32 | 40 | 69 | $2,503 |
| #33 | 40 | 69 | $2,503 |
| #34 | 40 | 69 | $2,503 |
| #35 | 40 | 69 | $2,503 |
| #36 | 40 | 69 | $2,503 |
| #37 | 40 | 69 | $2,503 |
| #38 | 40 | 69 | $2,503 |
| #39 | 40 | 69 | $2,503 |
| #40 | 40 | 69 | $2,503 |
| #41 | 40 | 69 | $2,503 |
| #42 | 40 | 69 | $2,503 |
| #43 | 40 | 69 | $2,503 |
| #44 | 40 | 69 | $2,503 |
| #45 | 40 | 69 | $2,503 |
| #46 | 40 | 69 | $2,503 |
| #47 | 40 | 69 | $2,503 |
| #48 | 40 | 69 | $2,503 |
| #49 | 40 | 69 | $2,503 |
| #50 | 40 | 69 | $2,503 |
| #51 | 40 | 69 | $2,503 |
| #52 | 40 | 69 | $2,503 |
| #53 | 40 | 69 | $2,503 |
| #54 | 40 | 69 | $2,503 |
| #55 | 40 | 69 | $2,503 |
| #56 | 40 | 69 | $2,503 |
| #57 | 40 | 69 | $2,503 |
| #58 | 40 | 69 | $2,503 |
| #59 | 40 | 69 | $2,503 |
| #60 | 40 | 69 | $2,503 |
| #61 | 40 | 69 | $2,503 |
| #62 | 40 | 69 | $2,503 |
| #63 | 40 | 69 | $2,503 |
| #64 | 40 | 69 | $2,503 |
| #65 | 40 | 69 | $2,503 |
| #66 | 40 | 69 | $2,503 |
| #67 | 40 | 69 | $2,503 |
| #68 | 40 | 69 | $2,503 |
| Total (68 units) | $170,182 | ||
UW: 25.0% down · 7.5% · 30yr · 1.5% tax · 5.0% vac · 8.0% maint · 8.0% mgmt
Financing live
Cash to close
- Down payment
- $3,373,750
- Closing costs
- $404,850
- Reserves months
- —
- Total cash needed
- —
Loan-product check · same deal, 3 products live
Conventional
25% down · 7.5% · 30yr
- Down + closing
- —
- Monthly P&I
- —
- Monthly cashflow
- —
- DSCR
- —
- Eligible?
- —
Personal DTI + credit; lowest rate.
DSCR
20% down · 8.5% · 30yr
- Down + closing
- —
- Monthly P&I
- —
- Monthly cashflow
- —
- DSCR
- —
- Eligible?
- —
No personal income docs; deal must DSCR.
Hard money
10% down · 12.0% · 12mo
- Down + closing
- —
- Monthly P&I
- —
- Monthly cashflow
- —
- DSCR
- —
- Eligible?
- —
Short-term bridge; refi at stabilization.
Listing history 10 events
-
2026-06-18days on market $13,495,000 Active 13 DOM
-
2026-06-17days on market $13,495,000 Active 12 DOM
-
2026-06-16days on market $13,495,000 Active 11 DOM
-
2026-06-15days on market $13,495,000 Active 10 DOM
-
2026-06-13days on market $13,495,000 Active 8 DOM
-
2026-06-13days on market $13,495,000 Active 7 DOM
-
2026-06-09days on market $13,495,000 Active 4 DOM
-
2026-06-08days on market $13,495,000 Active 3 DOM
-
2026-06-07remarks 699-char remark
-
2026-06-07$13,495,000 Active 2 DOM
ⓘ Source: listings_history table (triggers on properties + properties_extension) + one-shot
backfill from property_details.listing_events for pre-trigger history.
Tax reassessment forecast CA · Resets to sale price
- Current annual tax
- $132,811 · $11,068/mo
- Projected year-2 tax
- $132,811 · $11,068/mo
- Expected delta
- $0/yr ($0/mo · 0.0%)
ⓘ Screening estimate from a state-policy table — verify with the county assessor before closing.
Climate risk First Street
- Flood 3/10 Moderate FEMA zone X (shaded) · 20% chance over 30 yrs
- Wildfire 2/10 Low
- Heat 6/10 Major 7 d/yr ≥98°F today · 20 d/yr by 30 yrs out
- Wind 1/10 Low
- Air quality 4/10 Moderate 6 unhealthy d/yr today · 7 by 30 yrs out
Nearby sold comps map
Loading sold comps map…
Walkable amenities ~0.75 mi
Loading nearby amenities…
Taxation est. · year 1
- Rental income
- $2,042,184
- − Mortgage interest
- −$755,930
- − Property taxes
- −$132,811
- − Insurance
- −$67,475
- − Repairs & maintenance
- −$163,375
- − Management
- −$163,375
- − Depreciation
- −$392,582
- Taxable income
- $366,637
- Est. tax owed @ 24.0%
- −$87,993
- After-tax cash flow
- $475,816/yr
For passive investors: Depreciation is non-cash, so a rental often shows a tax loss while cash-flowing — sheltering income. Rental losses are passive: they offset passive income freely, and up to $25,000/yr can offset ordinary (W-2) income if you actively participate and your MAGI is under $100k (phasing out to $0 by $150k); unused losses carry forward. On sale, claimed depreciation is recaptured at up to 25%, and gains may owe capital-gains tax (a 1031 exchange can defer both). Figures are a year-1 estimate at your 24.0% rate — not tax advice; consult a CPA.
Schools (NCES district)
- District
- Grossmont Union High
- NCES district ID
- 0616230
- Math proficiency
- 31% ▼ -1.00%
- Reading proficiency
- 60% ▲ 5.00%
- Median HH income
- $61,801
- Composite
- 40.07/100
- National rank
- #3810
- State rank
- #173 of 517 in CA
Livability — El Cajon
- Score
- 70/100
- State rank
- #230
- US rank
- #7531
Category grades
Schools grade is shown separately in the Schools card above.
Census & demographics
- Census place
- El Cajon, CA
- County
- San Diego County · 3,178,799 people
- City population
- 173,694
- Metro
- San Diego-Chula Vista-Carlsbad, CA
- Population (ZIP)
- 70,501
- Household income
- $74,013
- Rent vs Own
- Severe rent burden
- 4178.0
Population outlook (San Diego County) Hauer SSP2
- Today (2025)
- 3,678,185 people
- By 2030
- 3,856,546 · +4.8%
- By 2040
- 4,171,407 · +13.4%
- By 2050
- 4,421,607 · +20.2%
- By 2075
- 4,831,599 · +31.4%
- By 2100
- 4,832,502 · +31.4%
Race, ethnicity, and origin ACS 2023
- Neighborhood character
- Diverse neighborhood (Simpson 0.62)
- Race & ethnicity
- White 54% Hispanic / Latino 28% Two or more races 14% Black 6% Asian 5% Native American 2%
- Hispanic origin (detail)
- Mexican 24%
- Common ancestry
- Arab 6% Italian 2% Lithuanian 2%
- Foreign-born
- 22% · Canada
- Languages at home
- 65% English-only · Spanish 18% Arabic 7% Other Indo-European 3%
Political lean MEDSL · San Diego
- 2024 margin
- D (+16.8) · D 56.9% · R 40.1% · Other 2.9%
- 2008→2024 swing
- +6.6pp toward D · 2008: 10.2pp · 2024: 16.8pp
- All cycles
- 2024: D+16.8 2020: D+22.8 2016: D+17.8 2012: D+5.1 2008: D+10.2
Not yet ingested
- Civics
- —
Market trends
- HPI YoY
- ▼ -654.88%
- Current HPI
- 335.0617
- Rent YoY
- ▼ -0.83%
- Metro
- San Diego-Chula Vista-Carlsbad, CA
- State GDP YoY
- ▲ 3.21%
- F500 in state
- 116
Industry mix (Fortune 500 HQ in CA)
| Industry | F500 HQs | Revenue |
|---|---|---|
| Technology | 27 | $1,492B |
|
||
| Financial Services | 3 | $174B |
|
||
| Retail | 3 | $44B |
|
||
| Insurance | 3 | $26B |
|
||
| Media / Entertainment | 2 | $115B |
|
||
| Pharmaceuticals / Biotech | 2 | $62B |
|
||
Price history
+409.2% since first listed5 events — show timeline
- 2026-06-05 Relisted — SDMLS
- 2026-06-04 Listing Removed — SDMLS
- 2026-06-04 Listed $13,495,000 SDMLS
- 2005-03-30 Sold (Public Records) $5,250,000 Public Records
- 2002-11-22 Sold (Public Records) $2,650,000 Public Records
Property tax history
+4.5%/yrLatest (2025): $132,811 · -7.6% YoY. Source: county tax records.
Cash-flow waterfall
monthlySold comps — $/sqft
last 12 mo · ≤1 miLoading sold comps…