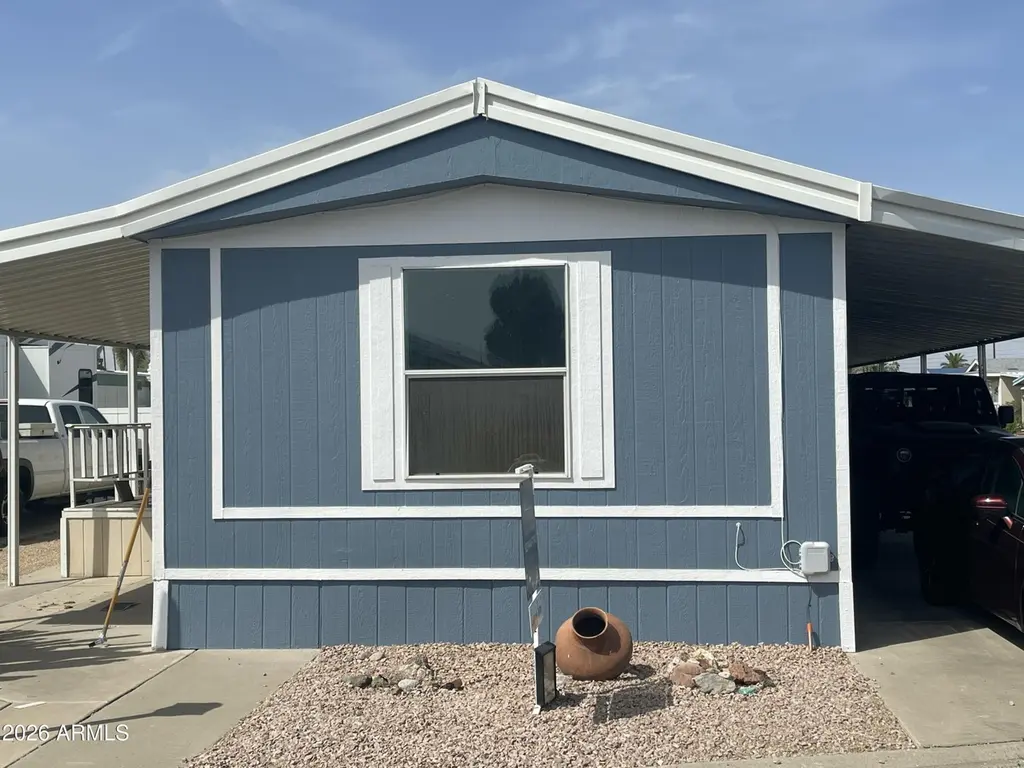
11411 N 91st Ave #122 · Peoria, AZ
Flood risk 1/10 · Minimal
- FEMA flood zone
- X (shaded)
- Chance of flooding over 30 yrs
- 0.0%
- Est. flood insurance / yr
- $507 – $1,088
Fire risk 1/10 · Minimal
- Est. fire insurance / yr
- $610 – $1,132
Heat risk 9/10 · Severe
- Hot days now (above 113°F)
- 6 days/yr
- Hot days in 30 yrs
- 16 days/yr
Wind risk 1/10 · Minimal
- Chance of severe wind over 30 yrs
- —
Air-quality risk 2/10 · Minimal
- Unhealthy air days now
- 1 days/yr
- Unhealthy air days in 30 yrs
- 1 days/yr
Risk factors via First Street. Map © Google.
Why this score? — see what drove the B- grade
The composite is a weighted blend of 9 inputs, each scored 0–100. Each bar is that input's sub-score; the figure is the points it added to the 100-point composite (weight × sub-score).
- Cash flow +30.0/30.0
- 1% rule +10.0/10.0
- DSCR +10.0/10.0
- ARV discount +4.1/15.0
- Condition / age +4.0/5.0
- Livability +3.8/5.0
- Schools +3.5/10.0
- Rent growth +2.7/5.0
- Appreciation +0.0/10.0
$69,900
🖨 Deal sheet (PDF) 📄 Offer letter ✓ Due diligence
Listing remarks MLS
ON LEASED LAND: Don't miss out on this absolutely stunning remodeled 2 bedroom 2 bath 1997 Redman manufactured home. Primary bath has custom walk in shower. Primary bedroom features walk in closet. 2nd bedroom has entrance to hall bath. Kitchen is elegantly updated with added kitchen island. Updated lighting throughout. Front porch to enjoy your morning beverage. Private Fenced area for your fur babies. Roof only a few years old, ac just updated. 1 Year home warranty. Located in highly sought after Casa Del Sol West, a 55 plus age restricted gated resort style community. Featuring pool, spa, billiards, putting green fitness, laundry. Lots of activities.
Key facts
- 2 parking spots
- Community pool
- Built 1997
Neighborhood map
What this means for you Summary
Snapshot
- This is a 2-bed/2.0-bath manufactured listed at $70k. Condition is rated good.
Deal economics
- At list price, monthly cash flow is $856 ($10k/yr) — positive.
- The deal already cash-flows at list — no discount required.
- Meets the 1% rule at list price ($2k rent vs $70k).
- Recommended offer: $66k (6.0% below list) — sets the bar for market timing.
- Cap rate 21.0% vs local median 3.3% in Peoria — top-decile yield for the area; either an underpriced asset or a hidden risk that comps aren't pricing in. Stress-test before assuming the spread holds.
Location & tenants
- Location reads 76/100 on livability (#14 in AZ, #3,603 nationally) — a middle-class / working-renter tenant base. Strengths: housing A+, commute A, employment A; Watch: cost of living C-, amenities D, health & safety F.
- Peoria Unified School District (4237) (suburban): math 36% / reading 42% proficiency, ranked #64 of 249 in AZ (top 26%) — families likely to look elsewhere, expect single-tenant / working-renter base with shorter leases.
- Market conditions: Rents flat; 333 active listings in the ZIP; 40 comparable units currently listed for rent nearby; rentals at typical pace (median 21d on market — plan ~3-4 weeks tenant-placement turnaround); 36,011 units permitted in Maricopa County in 2024 (12,801 in 5+ unit buildings).
- This rent runs 30% of the median local income ($67k/yr) — at the standard rent-burdened threshold; future hikes will face affordability resistance.
Forward outlook
- Local home prices are declining (-3.0%/yr); year-one equity from $483 of loan paydown is wiped out by about $2k of value loss. Plan a longer hold.
- Maricopa County population projected at +38% by 2050 — long-run rental-demand tailwind backs the buy-and-hold thesis.
- At projected returns (-3.0% appreciation + 0.6% rent growth), your $20k cash investment doubles in ~3 years — after that, you're playing with house money.
Negotiation context
- It's been on market 74 days — a 6% lower offer ($66k) is reasonable based on typical stale-listing flexibility.
- 3 sale attempts since 6y ago with the ask held roughly flat each time — persistent listings suggest the price (not the market) is what's stuck; bring a comps-based counter.
- Current owner paid $28k; list at $70k implies a 145% gain — meaningful room to come down on a strong offer.
Risks & watch-outs
- Climate carrying-cost: extreme-heat days projected 6→16/yr by 2055 (HVAC capex compounding) — expect insurance premiums to compound above CPI over the hold.
Questions for the listing agent
- It's been on market 74 days. Have you received any prior offers? Is the seller open to a 6% concession, seller financing, or rate buy-down credit?
- Why hasn't it sold? Are there any deal-killer items the seller is aware of (foundation, flood, title, zoning, code violations)?
- Is there a deadline driving the sale (1031 exchange, divorce, estate, relocation)? That informs how much negotiation room exists.
- Schools are B-rated — typically a magnet for longer-tenancy family renters. What's the average tenant stay here, and is there a school-zone premium baked into asking?
- What's the average days-on-market for RENTAL listings here right now (not sales)? A rising rental-DOM trend means longer vacancies and softer asking-rent achievability than the comps imply.
- What's the recent tenant-quality profile in this submarket — average credit score on applications, eviction rate, late-payment / NSF rate, and stable-employment percentage? A property-management company in the area should have these aggregated.
- How much new for-sale + rental construction is in the pipeline within 1–3 miles? Heavy new supply typically softens prices + rents 12–24 months out; constrained supply supports both.
Investment metrics
- 1% rule
- 2.42% ✓
- Cap rate
- 20.99%
- Cash-on-cash
- 52.48%
- DSCR
- 3.33
- GRM
- 3.4
CMA / ARV
- ARV (median comp)
- $64,950
- List price
- $69,900
- Delta
- 7.62%
- Verdict
- FAIR
- Comps
- 20 within 1.0 mi
Show comp detail 12 sales within ~0.75 mi
| Address | Dist | Beds/Ba | Sqft | Sold | Price | $/sf | Match |
|---|---|---|---|---|---|---|---|
| 11411 N 91st Ave #157 | 0.05mi | 3/2.0 (+1) | 1,056 (-6%) | 1mo | $20,000 | $19 | 82 |
| 11411 N 91st Ave #235 | 0.02mi | 2/2.0 | 1,024 (-9%) | 6mo | $85,000 | $83 | 80 |
| 10951 N 91 Ave #23 | 0.23mi | 3/2.0 (+1) | 1,152 (+3%) | 4mo | $85,000 | $74 | 76 |
| 10951 N 91st Ave #223 | 0.23mi | 2/2.0 | 1,024 (-9%) | 0mo | $69,900 | $68 | 75 |
| 10951 N 91st Ave #218 | 0.32mi | 3/2.0 (+1) | 1,168 (+4%) | 1mo | $114,000 | $98 | 72 |
| 10951 N 91st Ave #175 | 0.23mi | 3/2.0 (+1) | 1,054 (-6%) | 4mo | $74,200 | $70 | 71 |
| 11411 N 91st Ave #131 | 0.16mi | 2/2.0 | 980 (-12%) | 4mo | $46,000 | $47 | 68 |
| 11411 N 91st Ave #215 | 0.16mi | 2/2.0 | 966 (-14%) | 4mo | $12,000 | $12 | 66 |
| 10951 N 91st Ave #6 | 0.34mi | 3/2.0 (+1) | 1,056 (-6%) | 7mo | $85,000 | $80 | 64 |
| 10951 N 91st Ave #216 | 0.32mi | 2/2.0 | 980 (-12%) | 6mo | $82,000 | $84 | 59 |
| 11000 N 91st Ave #84 | 0.23mi | 3/1.0 (+1) | 980 (-12%) | 4mo | $60,000 | $61 | 56 |
| 11275 N 99th Ave #118 | 0.72mi | 3/2.0 (+1) | 1,273 (+14%) | 2mo | $265,000 | $208 | 37 |
Match score weights: distance 35% · size 25% · config 20% · recency 20%. Top-matched comps best support the ARV.
Projected returns pro-forma
-3.0% appreciation · 0.62% rent growth · sell at horizon
- IRR
- 47.7%
- Equity multiple
- 3.01×
- Total profit
- $39,247
- Equity at exit
- $10,422
- IRR
- 52.4%
- Equity multiple
- 5.55×
- Total profit
- $88,962
- Equity at exit
- $6,044
Cash invested: $19,572 (down + closing). Projections, not guarantees.
Landlord ↔ Tenant lean methodology
- Overall (STATE)
- 87 Strongly Landlord-Friendly
- State Arizona
- 87 Strongly Landlord-Friendly · R+3
- County
- — inherits STATE
- City
- — inherits STATE
ZIP-level market 85345
- Home prices YoY
- -19.8%
- Rents YoY
- 0.6%
- Active inventory
- 333
- Price-to-rent
- 3.4×
Monthly cashflow live
- Estimated rent
- $1,695 high interval (Pro) →
- Mortgage (P&I)
- −$367
- Tax est. 1.5%
- −$87 /mo · $1,048/yr
- Insurance
- −$29
- HOA
- −$0
- Vacancy / Maint / Mgmt
- −$356
- Net cashflow
- $856
Break-even live
Sensitivity live
| Price | -10% $904 | -5% $880 | +0% $856 | +5% $832 | +10% $808 |
|---|---|---|---|---|---|
| Rent | -10% $722 | -5% $789 | +0% $856 | +5% $923 | +10% $990 |
| Rate | -1.0pp $891 | -0.5pp $874 | base $856 | +0.5pp $838 | +1.0pp $819 |
UW: 25.0% down · 7.5% · 30yr · 1.5% tax · 5.0% vac · 8.0% maint · 8.0% mgmt
Financing live
Cash to close
- Down payment
- $17,475
- Closing costs
- $2,097
- Reserves months
- —
- Total cash needed
- —
Loan-product check · same deal, 3 products live
Conventional
25% down · 7.5% · 30yr
- Down + closing
- —
- Monthly P&I
- —
- Monthly cashflow
- —
- DSCR
- —
- Eligible?
- —
Personal DTI + credit; lowest rate.
DSCR
20% down · 8.5% · 30yr
- Down + closing
- —
- Monthly P&I
- —
- Monthly cashflow
- —
- DSCR
- —
- Eligible?
- —
No personal income docs; deal must DSCR.
Hard money
10% down · 12.0% · 12mo
- Down + closing
- —
- Monthly P&I
- —
- Monthly cashflow
- —
- DSCR
- —
- Eligible?
- —
Short-term bridge; refi at stabilization.
Rent comps 40 comps
| Address | Beds | Baths | Sqft | Rent | $/sqft | DOM | Units | Dist |
|---|---|---|---|---|---|---|---|---|
| 11411 N 91st Ave Unit 134 Peoria, AZ | 3.0 | 2.0 | 1310 | $1,599 | $1.22 | 44d | 1 | 0.02mi |
| 11411 N 91st Ave Unit 213 Peoria, AZ | 2.0 | 2.0 | 858 | $1,399 | $1.63 | 25d | 1 | 0.18mi |
| 8821 W Sahuaro Dr Peoria, AZ | 3.0 | 2.0 | 1074 | $1,595 | $1.49 | 3d | 1 | 0.46mi |
| 8821 W Sahuaro Dr Peoria, AZ | 3.0 | 2.0 | 1074 | $1,595 | $1.49 | 25d | 1 | 0.46mi |
| 8650 W Peoria Ave Peoria, AZ | 1.0–2.0 | 1.0–2.0 | 836 | $1,492 | $1.78 | 3d | 19 | 0.67mi |
| 10860 N 85th Ave Peoria, AZ | 2.0 | 1.0 | 780 | $1,225 | $1.57 | 44d | 1 | 0.70mi |
| 10860 N 85th Ave Peoria, AZ | 1.0–2.0 | 1.0 | 630 | $1,350 | $2.14 | 4d | 1 | 0.70mi |
| 8930 W Monroe St Peoria, AZ | 3.0 | 2.0 | 1300 | $1,899 | $1.46 | 44d | 2 | 0.70mi |
| 8930 W Monroe St Peoria, AZ | 3.0 | 2.0 | 1300 | $2,099 | $1.61 | 24d | 1 | 0.70mi |
| 10860 N 85th Ave Unit 87 Peoria, AZ | 2.0 | 1.0 | 780 | $1,149 | $1.47 | 5d | 1 | 0.70mi |
| 8630 W Shaw Butte Dr Peoria, AZ | 3.0 | 2.0 | 1284 | $1,951 | $1.52 | 13d | 1 | 0.71mi |
| 8560 W Peoria Ave Peoria, AZ | 2.0 | 1.0 | 888 | $1,450 | $1.63 | 1d | 8 | 0.73mi |
| 10221 N 87th Ln Peoria, AZ | 3.0 | 2.0 | 1232 | $2,059 | $1.67 | 44d | 1 | 0.76mi |
| 10101 N 91st Ave #109 Peoria, AZ | 2.0 | 2.5 | 1161 | $1,395 | $1.20 | 3d | 1 | 0.83mi |
| 10316 N 94th Ln Peoria, AZ | 3.0 | 2.0 | 1352 | $2,000 | $1.48 | 25d | 1 | 0.87mi |
| 9002 W Malapai Dr Peoria, AZ | 3.0 | 2.0 | 1270 | $2,040 | $1.61 | 20d | 1 | 0.88mi |
| 9426 W Monroe St Peoria, AZ | 3.0 | 3.5 | 1405 | $1,800 | $1.28 | 17d | 1 | 0.90mi |
| 10701 N 99th Ave Unit 230 Peoria, AZ | 2.0 | 2.0 | 784 | $1,099 | $1.40 | 21d | 1 | 0.91mi |
| 8311 W Edwards St Peoria, AZ | 3.0 | 2.0 | 1242 | $2,100 | $1.69 | 25d | 1 | 0.93mi |
| 12751 N Plaza Del Rio Blvd Peoria, AZ | 1.0–2.0 | 1.0–2.0 | 1007 | $1,890 | $1.88 | 1d | 10 | 0.95mi |
| 11429 N 83rd Ave #2 Peoria, AZ | 1.0 | 1.0 | 750 | $1,100 | $1.47 | 25d | 1 | 0.96mi |
| 11110 N 82nd Ln Peoria, AZ | 3.0 | 2.0 | 1350 | $1,899 | $1.41 | 25d | 1 | 0.98mi |
| 8773 W Dahlia Dr Peoria, AZ | 3.0 | 2.5 | 1439 | $2,200 | $1.53 | 5d | 1 | 1.03mi |
| 9323 W Ironwood Dr Peoria, AZ | 3.0 | 2.0 | 1306 | $2,085 | $1.60 | 44d | 1 | 1.05mi |
| 9323 W Ironwood Dr Peoria, AZ | 3.0 | 2.0 | 1306 | $1,985 | $1.52 | 24d | 1 | 1.05mi |
| 8834 W Purdue Ave Peoria, AZ | 3.0 | 2.0 | 1319 | $1,800 | $1.36 | 3d | 1 | 1.05mi |
| 8609 W Dahlia Dr Peoria, AZ | 3.0 | 3.0 | 1431 | $1,550 | $1.08 | 44d | 1 | 1.11mi |
| 10104 N 96th Dr Unit A Peoria, AZ | 2.0 | 2.0 | 1072 | $1,750 | $1.63 | 25d | 1 | 1.12mi |
| 12480 N 83rd Dr Peoria, AZ | 3.0 | 2.0 | 1410 | $1,895 | $1.34 | 2d | 1 | 1.14mi |
| 8280 W Madison St Peoria, AZ | 2.0 | 2.0 | 800 | $1,400 | $1.75 | 44d | 1 | 1.17mi |
| 11014 N 81st Ave Peoria, AZ | 3.0 | 3.0 | 1133 | $1,699 | $1.50 | 5d | 1 | 1.19mi |
| 10110 N 97th Dr Unit A Peoria, AZ | 2.0 | 1.5 | 1025 | $1,500 | $1.46 | 25d | 1 | 1.20mi |
| 10822 N Balboa Dr Sun City, AZ | 2.0 | 1.0 | 942 | $3,000 | $3.18 | 25d | 1 | 1.23mi |
| 9626 W Mountain View Rd Unit A Peoria, AZ | 2.0 | 2.0 | 1156 | $1,500 | $1.30 | 44d | 1 | 1.25mi |
| 8656 W Willow Ave Peoria, AZ | 3.0 | 2.0 | 1347 | $2,000 | $1.48 | 12d | 1 | 1.29mi |
| 13310 N Plaza del Rio Blvd Peoria, AZ | 1.0–3.0 | 1.0–2.0 | 981 | $1,556 | $1.59 | 2d | 13 | 1.30mi |
| 8551 W Carol Ave Peoria, AZ | 3.0 | 2.0 | 1323 | $2,135 | $1.61 | 12d | 1 | 1.32mi |
| 8885 W Thunderbird Rd Peoria, AZ | 1.0–2.0 | 1.0–2.0 | 879 | $1,725 | $1.96 | 2d | 26 | 1.39mi |
| 7914 W Mescal St Peoria, AZ | 3.0 | 2.0 | 1296 | $1,700 | $1.31 | 5d | 1 | 1.40mi |
| 8165 W Whitney Dr Peoria, AZ | 1.0–2.0 | 1.0–2.0 | 911 | $2,223 | $2.44 | 1d | 229 | 1.41mi |
Listing history 25 events
-
2026-06-18days on market $69,900 Active 74 DOM
-
2026-06-17days on market $69,900 Active 73 DOM
-
2026-06-16days on market $69,900 Active 72 DOM
-
2026-06-15days on market $69,900 Active 71 DOM
-
2026-06-13days on market $69,900 Active 69 DOM
-
2026-06-13days on market $69,900 Active 68 DOM
-
2026-06-09days on market $69,900 Active 65 DOM
-
2026-06-08days on market $69,900 Active 64 DOM
-
2026-06-07days on market $69,900 Active 63 DOM
-
2026-06-04days on market $69,900 Active 60 DOM
-
2026-06-03days on market $69,900 Active 59 DOM
-
2026-06-02days on market $69,900 Active 58 DOM
-
2026-06-01days on market $69,900 Active 57 DOM
-
2026-05-31days on market $69,900 Active 56 DOM
-
2026-05-13price $69,900 682-char remark
Show marketing remark (682 chars)
ON LEASED LAND: Don't miss out on this absolutely stunning remodeled 2 bedroom 2 bath 1997 Redman manufactured home. Primary bath has custom walk in shower. Primary bedroom features walk in closet. 2nd bedroom has entrance to hall bath. Kitchen is elegantly updated with added kitchen island. Updated lighting throughout. Front porch to enjoy your morning beverage. Private Fenced area for your fur babies. Roof only a few years old, ac just updated. 1 Year home warranty. Located in highly sought after Casa Del Sol West, a 55 plus age restricted gated resort style community. Featuring pool, spa, billiards, putting green fitness, laundry. Lots of activities.
-
2026-04-05$72,500 Active 682-char remark
Show marketing remark (682 chars)
ON LEASED LAND: Don't miss out on this absolutely stunning remodeled 2 bedroom 2 bath 1997 Redman manufactured home. Primary bath has custom walk in shower. Primary bedroom features walk in closet. 2nd bedroom has entrance to hall bath. Kitchen is elegantly updated with added kitchen island. Updated lighting throughout. Front porch to enjoy your morning beverage. Private Fenced area for your fur babies. Roof only a few years old, ac just updated. 1 Year home warranty. Located in highly sought after Casa Del Sol West, a 55 plus age restricted gated resort style community. Featuring pool, spa, billiards, putting green fitness, laundry. Lots of activities.
-
2025-04-01soldstatus $28,500 Closed 477-char remark
Show marketing remark (477 chars)
ON LEASED LAND: Beautiful manufactured home located in a gated 55 plus resort style community. Well maintained. Primary bedroom is good size with walk in closet. Separate tub and shower in primary. Split floor plan. Front room and kitchen open for a great open feel. Kitchen has breakfast bar as well, Community is an active adult community with lots of activities. Dog park, putting green, beautiful pool and spa. Workout facility, billiards just to name a few.
-
2025-03-07historical Contract Contingent on Buyer Sale 477-char remark
Show marketing remark (477 chars)
ON LEASED LAND: Beautiful manufactured home located in a gated 55 plus resort style community. Well maintained. Primary bedroom is good size with walk in closet. Separate tub and shower in primary. Split floor plan. Front room and kitchen open for a great open feel. Kitchen has breakfast bar as well, Community is an active adult community with lots of activities. Dog park, putting green, beautiful pool and spa. Workout facility, billiards just to name a few.
-
2025-02-20$39,000 Active 477-char remark
Show marketing remark (477 chars)
ON LEASED LAND: Beautiful manufactured home located in a gated 55 plus resort style community. Well maintained. Primary bedroom is good size with walk in closet. Separate tub and shower in primary. Split floor plan. Front room and kitchen open for a great open feel. Kitchen has breakfast bar as well, Community is an active adult community with lots of activities. Dog park, putting green, beautiful pool and spa. Workout facility, billiards just to name a few.
-
2020-12-18soldstatus $43,000 Closed
-
2020-12-04historical Under Contract Accepting Backups
-
2020-11-18price $45,000
-
2020-10-13price $55,000
-
2020-09-10price $59,000
-
2020-08-31$62,500 Active
ⓘ Source: listings_history table (triggers on properties + properties_extension) + one-shot
backfill from property_details.listing_events for pre-trigger history.
Climate risk First Street
- Flood 1/10 Low FEMA zone X (shaded) · 0% chance over 30 yrs
- Wildfire 1/10 Low
- Heat 9/10 Extreme 6 d/yr ≥113°F today · 16 d/yr by 30 yrs out
- Wind 1/10 Low
- Air quality 2/10 Low 1 unhealthy d/yr today · 1 by 30 yrs out
Nearby sold comps map
Loading sold comps map…
Walkable amenities ~0.75 mi
Loading nearby amenities…
Taxation est. · year 1
- Rental income
- $20,339
- − Mortgage interest
- −$3,915
- − Property taxes
- −$1,048
- − Insurance
- −$350
- − Repairs & maintenance
- −$1,627
- − Management
- −$1,627
- − Depreciation
- −$2,033
- Taxable income
- $9,738
- Est. tax owed @ 24.0%
- −$2,337
- After-tax cash flow
- $7,934/yr
For passive investors: Depreciation is non-cash, so a rental often shows a tax loss while cash-flowing — sheltering income. Rental losses are passive: they offset passive income freely, and up to $25,000/yr can offset ordinary (W-2) income if you actively participate and your MAGI is under $100k (phasing out to $0 by $150k); unused losses carry forward. On sale, claimed depreciation is recaptured at up to 25%, and gains may owe capital-gains tax (a 1031 exchange can defer both). Figures are a year-1 estimate at your 24.0% rate — not tax advice; consult a CPA.
Condition & rehab AI · 12 photos
This remodeled 2-bedroom 2-bath manufactured home is in good condition with updated kitchens and bathrooms, and a well-maintained exterior. It is located in a highly sought-after gated community with amenities.
Value-add opportunities
- Both Painting exterior siding — Enhances curb appeal and can increase value
- Both Landscaping improvements — Enhances curb appeal and can increase value
- Both Add a small garden bed — Enhances curb appeal and can increase value
Renovation cost estimate screening
Value-add ROI direction
- Both Painting exterior siding — Enhances curb appeal and can increase value ↑
- Both Landscaping improvements — Enhances curb appeal and can increase value ↑
- Both Add a small garden bed — Enhances curb appeal and can increase value ↑
ⓘ Cost ranges are severity-bucket heuristics (US national rule-of-thumb). Get contractor quotes + a written scope before underwriting a rehab budget.
Schools (NCES district)
- District
- Peoria Unified School District (4237)
- NCES district ID
- 0406250
- Math proficiency
- 36% ▼ -14.00%
- Reading proficiency
- 42% ▼ -8.00%
- Median HH income
- $60,171
- Composite
- 34.62/100
- National rank
- #5152
- State rank
- #64 of 249 in AZ
Livability — Peoria
- Score
- 76/100
- State rank
- #14
- US rank
- #3603
Category grades
Schools grade is shown separately in the Schools card above.
Census & demographics
- Census place
- Peoria, AZ
- County
- Maricopa County · 4,537,380 people
- City population
- 206,687
- Metro
- Phoenix-Mesa-Chandler, AZ
- Population (ZIP)
- 60,918
- Household income
- $67,380
- Rent vs Own
- Severe rent burden
- 1879.0
Population outlook (Maricopa County) Hauer SSP2
- Today (2025)
- 4,979,203 people
- By 2030
- 5,378,229 · +8.0%
- By 2040
- 6,156,598 · +23.6%
- By 2050
- 6,872,376 · +38.0%
- By 2075
- 8,401,270 · +68.7%
- By 2100
- 9,247,439 · +85.7%
Race, ethnicity, and origin ACS 2023
- Neighborhood character
- Diverse neighborhood (Simpson 0.62)
- Race & ethnicity
- White 51% Hispanic / Latino 34% Two or more races 14% Black 5% Asian 4% Native American 2%
- Hispanic origin (detail)
- Mexican 29%
- Common ancestry
- Romanian 2% Italian 2% Slovak 1%
- Foreign-born
- 13% · Canada, Vietnam
- Languages at home
- 76% English-only · Spanish 18% Other Indo-European 1% Vietnamese 1%
Political lean MEDSL · Maricopa
- 2024 margin
- Toss-up / Even · D 47.7% · R 51.2% · Other 1.1%
- 2008→2024 swing
- +7.1pp toward D · 2008: -10.6pp · 2024: -3.5pp
- All cycles
- 2024: R+3.5 2020: D+2.2 2016: R+3.5 2012: R+12.0 2008: R+10.6
Not yet ingested
- Civics
- —
Market trends
- HPI YoY
- ▼ -80.77%
- Current HPI
- 328.1069
- Rent YoY
- ▲ 0.62%
- Metro
- Phoenix-Mesa-Chandler, AZ
- State GDP YoY
- ▲ 4.54%
- F500 in state
- 20
Industry mix (Fortune 500 HQ in AZ)
| Industry | F500 HQs | Revenue |
|---|---|---|
| Technology | 2 | $13B |
|
||
| Mining / Metals | 1 | $23B |
|
||
| Environmental Services | 1 | $16B |
|
||
| Metals / Steel | 1 | $14B |
|
||
| Technology Distribution | 1 | $9B |
|
||
| Homebuilding | 1 | $8B |
|
||
Price history
+11.8% since first listed11 events — show timeline
- 2026-05-13 Price Changed $69,900 ARMLS
- 2026-04-05 Listed $72,500 ARMLS
- 2025-04-01 Sold (MLS) $28,500 ARMLS
- 2025-03-07 Contingent — ARMLS
- 2025-02-20 Listed $39,000 ARMLS
- 2020-12-18 Sold (MLS) $43,000 ARMLS
- 2020-12-04 Contingent — ARMLS
- 2020-11-18 Price Changed $45,000 ARMLS
- 2020-10-13 Price Changed $55,000 ARMLS
- 2020-09-10 Price Changed $59,000 ARMLS
- 2020-08-31 Listed $62,500 ARMLS
Cash-flow waterfall
monthlySold comps — $/sqft
last 12 mo · ≤1 miLoading sold comps…