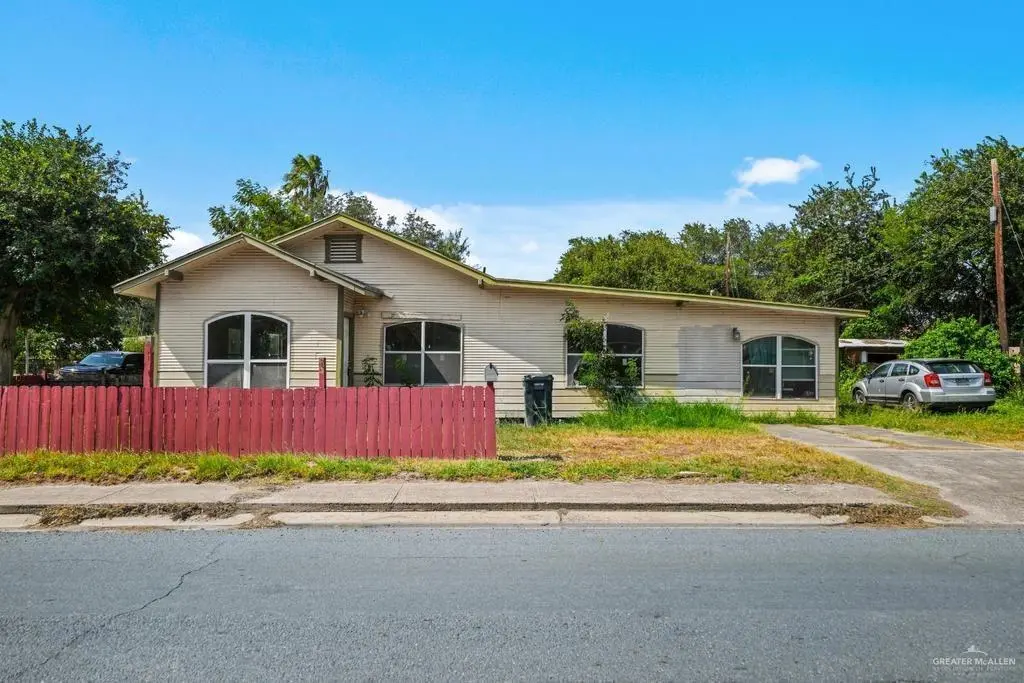
2122 W Hackberry Ave · McAllen, TX
Flood risk 1/10 · Minimal
- FEMA flood zone
- X (shaded)
- Chance of flooding over 30 yrs
- 0.0%
- Est. flood insurance / yr
- $507 – $1,088
Fire risk 1/10 · Minimal
- Est. fire insurance / yr
- $1,222 – $2,270
Heat risk 9/10 · Severe
- Hot days now (above 111°F)
- 7 days/yr
- Hot days in 30 yrs
- 22 days/yr
Wind risk 8/10 · Major
- Chance of severe wind over 30 yrs
- 99.0%
Air-quality risk 3/10 · Minor
- Unhealthy air days now
- 1 days/yr
- Unhealthy air days in 30 yrs
- 4 days/yr
Risk factors via First Street. Map © Google.
Why this score? — see what drove the C grade
The composite is a weighted blend of 9 inputs, each scored 0–100. Each bar is that input's sub-score; the figure is the points it added to the 100-point composite (weight × sub-score).
- Cash flow +20.6/30.0
- ARV discount +13.1/15.0
- DSCR +6.5/10.0
- 1% rule +6.0/10.0
- Livability +3.8/5.0
- Schools +3.3/10.0
- Rent growth +2.9/5.0
- Condition / age +2.5/5.0
- Appreciation +0.0/10.0
$135,000
🖨 Deal sheet 📄 Offer letter ✓ Due diligence
Listing remarks MLS
Corner Lot Home with Attached Guest Suite in Prime Location! This spacious 3 bedroom, 2 bath home features an open layout and sits on a desirable corner lot. An attached 1-bedroom, 1-bath suite offers flexible options for rental income, extended family, or a private home office. It's full of potential and ideally located close to shops, schools, and major routes. A great opportunity to make it your own!
Key facts
- Close to schools
- Attached guest suite
- Close to shops
Tags
Neighborhood map
What this means for you Summary
Snapshot
- This is a 3-bed/2.0-bath single-family listed at $135k.
Deal economics
- At list price, monthly cash flow is $180 ($2k/yr) — positive.
- The deal already cash-flows at list — no discount required.
- Meets the 1% rule at list price ($1k rent vs $135k).
- Recommended offer: $119k (12.0% below list) — sets the bar for market timing.
- Cap rate 7.9% vs local median 3.7% in McAllen — top-decile yield for the area; either an underpriced asset or a hidden risk that comps aren't pricing in. Stress-test before assuming the spread holds.
Location & tenants
- Location reads 76/100 on livability (#119 in TX, #3,771 nationally) — a middle-class / working-renter tenant base. Strengths: cost of living A+, housing A+, health & safety A+; Watch: employment D, amenities F, commute F.
- Mcallen ISD (urban): math 34% / reading 45% proficiency, ranked #440 of 826 in TX (top 53%) — families likely to look elsewhere, expect single-tenant / working-renter base with shorter leases.
- Market conditions: Rents rising (+1.8%/yr); 385 active listings in the ZIP; 37 comparable units currently listed for rent nearby; rentals lingering (median 44d on market — plan ~5-8 weeks vacancy on turnover, expect pricing pressure); 59% of comp listings sitting > 30 days — soft ceiling on asking rent; 7,378 units permitted in Hidalgo County in 2024 (641 in 5+ unit buildings).
- This rent runs 37% of the median local income ($48k/yr) — at the standard rent-burdened threshold; future hikes will face affordability resistance.
Forward outlook
- Local home prices are declining (-3.0%/yr); year-one equity from $933 of loan paydown is wiped out by about $4k of value loss. Plan a longer hold.
- Hidalgo County population projected at +28% by 2050 — long-run rental-demand tailwind backs the buy-and-hold thesis.
Negotiation context
- It's been on market 299 days — a 12% lower offer ($119k) is reasonable based on typical stale-listing flexibility.
Risks & watch-outs
- Watch-outs: built in 1951 — expect roof / HVAC / electrical / plumbing capex.
- Climate carrying-cost: severe wind risk, 99% chance of damaging wind over 30y; extreme-heat days projected 7→22/yr by 2055 (HVAC capex compounding) — expect insurance premiums to compound above CPI over the hold.
Questions for the listing agent
- It's been on market 299 days. Have you received any prior offers? Is the seller open to a 12% concession, seller financing, or rate buy-down credit?
- Built in 1951 — when were the roof, HVAC, electrical panel, plumbing, and water heater last replaced?
- Why hasn't it sold? Are there any deal-killer items the seller is aware of (foundation, flood, title, zoning, code violations)?
- Is there a deadline driving the sale (1031 exchange, divorce, estate, relocation)? That informs how much negotiation room exists.
- Schools are B-rated — typically a magnet for longer-tenancy family renters. What's the average tenant stay here, and is there a school-zone premium baked into asking?
- What's the average days-on-market for RENTAL listings here right now (not sales)? A rising rental-DOM trend means longer vacancies and softer asking-rent achievability than the comps imply.
- What's the recent tenant-quality profile in this submarket — average credit score on applications, eviction rate, late-payment / NSF rate, and stable-employment percentage? A property-management company in the area should have these aggregated.
- How much new for-sale + rental construction is in the pipeline within 1–3 miles? Heavy new supply typically softens prices + rents 12–24 months out; constrained supply supports both.
Investment metrics
- 1% rule
- 1.10% ✓
- Cap rate
- 7.89%
- Cash-on-cash
- 5.71%
- DSCR
- 1.25
- GRM
- 7.6
CMA / ARV
- ARV (median comp)
- $154,367
- List price
- $135,000
- Delta
- -12.55%
- Verdict
- UNDERPRICED
- Comps
- 20 within 1.0 mi
Show comp detail 7 sales within ~0.75 mi
| Address | Dist | Beds/Ba | Sqft | Sold | Price | $/sf | Match |
|---|---|---|---|---|---|---|---|
| 1107 N 19th St | 0.27mi | 3/2.0 | 1,872 (+7%) | 4mo | $110,000 | $59 | 72 |
| 1312 Kendlewood Ave | 0.61mi | 3/2.0 | 1,725 (-1%) | 3mo | $257,000 | $149 | 67 |
| 811 N 16th St | 0.38mi | 3/2.0 | 1,665 (-5%) | 11mo | $139,000 | $83 | 66 |
| 2524 Fir Ave | 0.38mi | 4/2.0 (+1) | 1,872 (+7%) | 19mo | $159,900 | $85 | 50 |
| 509 N 17th St | 0.35mi | 3/2.0 | 1,490 (-15%) | 16mo | $219,750 | $147 | 45 |
| 413 N 12th St | 0.69mi | 4/2.0 (+1) | 1,606 (-8%) | 5mo | $159,500 | $99 | 45 |
| 1317 Nyssa Ave | 0.64mi | 4/3.0 (+1) | 1,961 (+12%) | 14mo | $279,000 | $142 | 29 |
Match score weights: distance 35% · size 25% · config 20% · recency 20%. Top-matched comps best support the ARV.
Projected returns pro-forma
-3.0% appreciation · 1.78% rent growth · sell at horizon
- IRR
- -8.9%
- Equity multiple
- 0.68×
- Total profit
- $-12,158
- Equity at exit
- $20,129
- IRR
- -1.1%
- Equity multiple
- 0.93×
- Total profit
- $-2,808
- Equity at exit
- $11,672
Cash invested: $37,800 (down + closing). Projections, not guarantees.
Landlord ↔ Tenant lean methodology
- Overall (STATE)
- 87 Strongly Landlord-Friendly
- State Texas
- 87 Strongly Landlord-Friendly · R+5
- County
- — inherits STATE
- City
- — inherits STATE
ZIP-level market 78501
- Home prices YoY
- -23.3%
- Rents YoY
- 1.8%
- Active inventory
- 385
- Price-to-rent
- 7.6×
Monthly cashflow live
- Estimated rent
- $1,489 high interval (Pro) →
- Mortgage (P&I)
- −$708
- Tax from tax record
- −$232 /mo · $2,787/yr
- Insurance
- −$56
- HOA
- −$0
- Vacancy / Maint / Mgmt
- −$313
- Net cashflow
- $180
Break-even live
UW: 25.0% down · 7.5% · 30yr · 1.5% tax · 5.0% vac · 8.0% maint · 8.0% mgmt
Financing live
Cash to close
- Down payment
- $33,750
- Closing costs
- $4,050
- Reserves months
- —
- Total cash needed
- —
Loan-product check · same deal, 3 products live
Conventional
25% down · 7.5% · 30yr
- Down + closing
- —
- Monthly P&I
- —
- Monthly cashflow
- —
- DSCR
- —
- Eligible?
- —
Personal DTI + credit; lowest rate.
DSCR
20% down · 8.5% · 30yr
- Down + closing
- —
- Monthly P&I
- —
- Monthly cashflow
- —
- DSCR
- —
- Eligible?
- —
No personal income docs; deal must DSCR.
Hard money
10% down · 12.0% · 12mo
- Down + closing
- —
- Monthly P&I
- —
- Monthly cashflow
- —
- DSCR
- —
- Eligible?
- —
Short-term bridge; refi at stabilization.
Rent comps 37 comps
| Address | Beds | Baths | Sqft | Rent | $/sqft | DOM | Units | Dist |
|---|---|---|---|---|---|---|---|---|
| 2120 Date Palm Ave Unit B McAllen, TX | 3.0 | 2.0 | 1150 | $1,250 | $1.09 | 19d | 1 | 0.28mi |
| 3501 N 23rd Ln McAllen, TX | 2.0–3.0 | 1.5–2.0 | 1179 | $1,100 | $0.93 | 43d | 2 | 0.29mi |
| 419 N 17th St Unit 2 McAllen, TX | 3.0 | 2.5 | 1600 | $1,500 | $0.94 | 21d | 1 | 0.42mi |
| 609 N 15th St McAllen, TX | 2.0 | 1.0 | 1900 | $1,700 | $0.89 | 43d | 1 | 0.49mi |
| 2604 Quince Ln McAllen, TX | 3.0 | 2.0 | 1800 | $1,450 | $0.81 | 43d | 1 | 0.65mi |
| 1203 Jasmine Ave McAllen, TX | 3.0 | 2.0 | 1588 | $1,500 | $0.94 | 43d | 1 | 0.69mi |
| 1601 Redwood Ave McAllen, TX | 2.0 | 1.0 | 1292 | $1,100 | $0.85 | 43d | 1 | 0.70mi |
| 2616 Quince Ave McAllen, TX | 3.0 | 2.0 | 1134 | $1,450 | $1.28 | 23d | 1 | 0.72mi |
| 1024 Laurel Ave McAllen, TX | 3.0 | 2.0 | 1466 | $1,600 | $1.09 | 43d | 1 | 0.79mi |
| 1016 Laurel Ave McAllen, TX | 2.0 | 1.0 | 1124 | $1,425 | $1.27 | 14d | 1 | 0.81mi |
| 2421 Vine Ave Unit C McAllen, TX | 2.0 | 1.0 | 1050 | $800 | $0.76 | 14d | 1 | 0.89mi |
| 1808 N Broadway St McAllen, TX | 4.0 | 3.0 | 1800 | $2,400 | $1.33 | 43d | 1 | 0.90mi |
| 2114 Galveston Ave W Unit 3 McAllen, TX | 3.0 | 2.5 | 1064 | $1,350 | $1.27 | 43d | 1 | 0.97mi |
| 2108 Galveston Ave W Unit 4 McAllen, TX | 3.0 | 2.5 | 1064 | $1,500 | $1.41 | 43d | 1 | 0.97mi |
| 2108 Galveston Ave W Unit 5 McAllen, TX | 3.0 | 2.5 | 1064 | $1,350 | $1.27 | 43d | 1 | 0.97mi |
| 1516 Walnut Ave McAllen, TX | 4.0 | 2.0 | 2188 | $1,495 | $0.68 | 43d | 1 | 1.01mi |
| 1900 La Vista Ave McAllen, TX | 4.0 | 2.0 | 1410 | $2,400 | $1.70 | 43d | 1 | 1.04mi |
| 601 N 6th St McAllen, TX | 3.0 | 1.5 | 1075 | $1,350 | $1.26 | 43d | 1 | 1.11mi |
| 813 S Bicentennial Blvd McAllen, TX | 3.0 | 2.5 | 1429 | $2,000 | $1.40 | 43d | 1 | 1.12mi |
| 3600 Cedar Ave McAllen, TX | 3.0 | 2.5 | 1854 | $1,700 | $0.92 | 43d | 1 | 1.13mi |
| 1515 W Houston Ave McAllen, TX | 2.0 | 1.0 | 1050 | $1,800 | $1.71 | 43d | 1 | 1.15mi |
| 1515 S 16th St McAllen, TX | 2.0 | 1.0 | 1050 | $975 | $0.93 | 43d | 1 | 1.15mi |
| 2419 N 28th Ln McAllen, TX | 3.0 | 2.0 | 1510 | $1,250 | $0.83 | 23d | 1 | 1.22mi |
| 2419 N 28th Ln McAllen, TX | 3.0 | 2.0 | 1510 | $1,250 | $0.83 | 14d | 1 | 1.22mi |
| 2419 N 28th Ln McAllen, TX | 3.0 | 2.0 | 1510 | $1,250 | $0.83 | 43d | 1 | 1.22mi |
| 2716 N 27th Ln McAllen, TX | 3.0 | 2.5 | 1458 | $1,750 | $1.20 | 14d | 1 | 1.29mi |
| 439 Quince Cir McAllen, TX | 2.0 | 1.0 | 1200 | $1,400 | $1.17 | 23d | 1 | 1.29mi |
| 2900 N 24th St McAllen, TX | 4.0 | 2.0 | 2009 | $1,900 | $0.95 | 43d | 1 | 1.30mi |
| 405 Cedar Ave McAllen, TX | 3.0 | 3.0 | 1935 | $2,000 | $1.03 | 43d | 1 | 1.31mi |
| 915-917 Galveston Ave Unit 917-3 McAllen, TX | 3.0 | 2.5 | 1455 | $995 | $0.68 | 43d | 1 | 1.33mi |
| 1209 Harvey St McAllen, TX | 2.0 | 1.0 | 1408 | $1,350 | $0.96 | 14d | 1 | 1.37mi |
| 600 S 8th St McAllen, TX | 4.0 | 2.0 | 2112 | $1,800 | $0.85 | 19d | 1 | 1.37mi |
| 615 W Dallas Ave Apt A-16 McAllen, TX | 2.0 | 2.0 | 1069 | $2,350 | $2.20 | 21d | 1 | 1.38mi |
| 609 Walnut Ave McAllen, TX | 3.0 | 2.0 | 1323 | $1,800 | $1.36 | 23d | 1 | 1.40mi |
| 3501 Westway Ave McAllen, TX | 3.0 | 2.0 | 1364 | $1,500 | $1.10 | 23d | 1 | 1.43mi |
| 3101 N 25 1/2 St McAllen, TX | 3.0 | 2.0 | 1462 | $1,600 | $1.09 | 23d | 1 | 1.46mi |
| 3207 N 20th St McAllen, TX | 3.0 | 2.0 | 1627 | $2,200 | $1.35 | 43d | 1 | 1.47mi |
Listing history 18 events
-
2026-06-18days on market $135,000 Active 299 DOM
-
2026-06-17days on market $135,000 Active 298 DOM
-
2026-06-16days on market $135,000 Active 297 DOM
-
2026-06-15days on market $135,000 Active 296 DOM
-
2026-06-14days on market $135,000 Active 294 DOM
-
2026-06-10days on market $135,000 Active 291 DOM
-
2026-06-09days on market $135,000 Active 290 DOM
-
2026-06-08days on market $135,000 Active 289 DOM
-
2026-06-07days on market $135,000 Active 288 DOM
-
2026-06-05days on market $135,000 Active 285 DOM
-
2026-06-03days on market $135,000 Active 284 DOM
-
2026-06-03price $135,000 Active 283 DOM
-
2026-06-02days on market $140,000 Active 283 DOM
-
2026-06-01days on market $140,000 Active 282 DOM
-
2026-05-31days on market $140,000 Active 281 DOM
-
2026-05-31days on market $140,000 Active 280 DOM
-
2025-08-23$140,000 Active 406-char remark
Show marketing remark (406 chars)
Corner Lot Home with Attached Guest Suite in Prime Location! This spacious 3 bedroom, 2 bath home features an open layout and sits on a desirable corner lot. An attached 1-bedroom, 1-bath suite offers flexible options for rental income, extended family, or a private home office. It's full of potential and ideally located close to shops, schools, and major routes. A great opportunity to make it your own!
-
2015-02-24soldstatus
ⓘ Source: listings_history table (triggers on properties + properties_extension) + one-shot
backfill from property_details.listing_events for pre-trigger history.
Tax reassessment forecast TX · Resets to sale price
- Current annual tax
- $2,787 · $232/mo
- Projected year-2 tax
- $2,787 · $232/mo
- Expected delta
- $0/yr ($0/mo · 0.0%)
ⓘ Screening estimate from a state-policy table — verify with the county assessor before closing.
Climate risk First Street
- Flood 1/10 Low FEMA zone X (shaded) · 0% chance over 30 yrs
- Wildfire 1/10 Low
- Heat 9/10 Extreme 7 d/yr ≥111°F today · 22 d/yr by 30 yrs out
- Wind 8/10 Severe 99% chance of damaging wind over 30 yrs
- Air quality 3/10 Moderate 1 unhealthy d/yr today · 4 by 30 yrs out
Nearby sold comps map
Loading sold comps map…
Walkable amenities ~0.75 mi
Loading nearby amenities…
Taxation est. · year 1
- Rental income
- $17,870
- − Mortgage interest
- −$7,562
- − Property taxes
- −$2,787
- − Insurance
- −$675
- − Repairs & maintenance
- −$1,430
- − Management
- −$1,430
- − Depreciation
- −$3,927
- Taxable income
- $59
- Est. tax owed @ 24.0%
- −$14
- After-tax cash flow
- $2,145/yr
For passive investors: Depreciation is non-cash, so a rental often shows a tax loss while cash-flowing — sheltering income. Rental losses are passive: they offset passive income freely, and up to $25,000/yr can offset ordinary (W-2) income if you actively participate and your MAGI is under $100k (phasing out to $0 by $150k); unused losses carry forward. On sale, claimed depreciation is recaptured at up to 25%, and gains may owe capital-gains tax (a 1031 exchange can defer both). Figures are a year-1 estimate at your 24.0% rate — not tax advice; consult a CPA.
Schools (NCES district)
- District
- Mcallen ISD
- NCES district ID
- 4829670
- Math proficiency
- 34% ▼ -22.00%
- Reading proficiency
- 45% ▼ -5.00%
- Median HH income
- $40,805
- Composite
- 33.16/100
- National rank
- #5551
- State rank
- #440 of 826 in TX
Livability — McAllen
- Score
- 76/100
- State rank
- #119
- US rank
- #3771
Category grades
Schools grade is shown separately in the Schools card above.
Census & demographics
- Census place
- McAllen, TX
- County
- Hidalgo County · 623,128 people
- City population
- 144,650
- Metro
- McAllen-Edinburg-Mission, TX
- Population (ZIP)
- 58,935
- Household income
- $48,071
- Rent vs Own
- Severe rent burden
- 3043.0
Population outlook (Hidalgo County) Hauer SSP2
- Today (2025)
- 955,232 people
- By 2030
- 1,009,774 · +5.7%
- By 2040
- 1,120,332 · +17.3%
- By 2050
- 1,225,036 · +28.2%
- By 2075
- 1,439,189 · +50.7%
- By 2100
- 1,533,429 · +60.5%
Race, ethnicity, and origin ACS 2023
- Neighborhood character
- Predominantly Hispanic (89%)
- Race & ethnicity
- Hispanic / Latino 89% Two or more races 32% White 8% Asian 2%
- Hispanic origin (detail)
- Mexican 85%
- Foreign-born
- 28% · Canada, Vietnam
- Languages at home
- 22% English-only · Spanish 76%
Political lean MEDSL · Hidalgo
- 2024 margin
- Toss-up / Even · D 48.1% · R 51.0%
- 2008→2024 swing
- -41.6pp toward R · 2008: 38.7pp · 2024: -2.9pp
- All cycles
- 2024: R+2.9 2020: D+17.1 2016: D+40.5 2012: D+41.8 2008: D+38.7
Not yet ingested
- Civics
- —
Market trends
- HPI YoY
- ▼ -69.99%
- Current HPI
- 230.0213
- Rent YoY
- ▲ 1.78%
- Metro
- McAllen-Edinburg-Mission, TX
- State GDP YoY
- ▲ 3.95%
- F500 in state
- 110
Industry mix (Fortune 500 HQ in TX)
| Industry | F500 HQs | Revenue |
|---|---|---|
| Energy | 16 | $1,198B |
|
||
| Technology | 5 | $198B |
|
||
| Engineering / Construction | 4 | $72B |
|
||
| Energy Services | 3 | $60B |
|
||
| Utilities | 3 | $41B |
|
||
| Healthcare | 2 | $330B |
|
||
Price history
2 events — show timeline
- 2025-08-23 Listed $140,000 MCALLENMLS
- 2015-02-24 Sold (Public Records) — Public Records
Property tax history
+9.9%/yrLatest (2025): $2,787 · +16.7% YoY. Source: county tax records.
Cash-flow waterfall
monthlySold comps — $/sqft
last 12 mo · ≤1 miLoading sold comps…