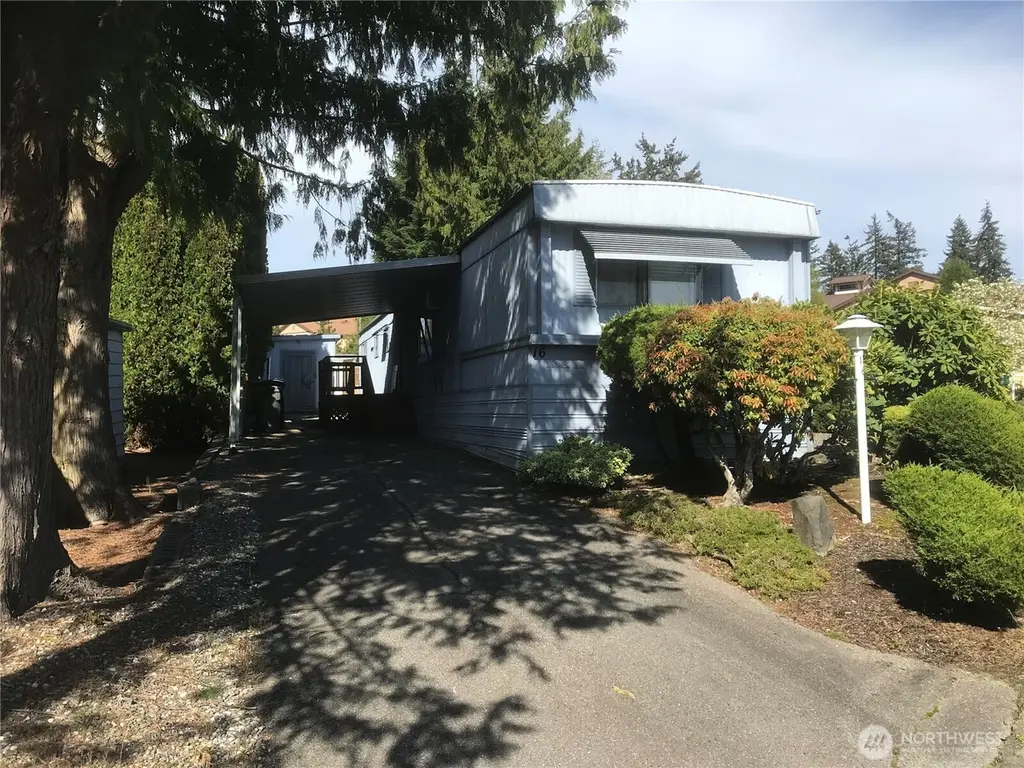
4111 164th St SW #16 · North Lynnwood, WA
Flood risk No data
- FEMA flood zone
- —
- Chance of flooding over 30 yrs
- —
- Est. flood insurance / yr
- —
Fire risk No data
- Est. fire insurance / yr
- —
Heat risk No data
- Hot days now (above threshold)
- —
- Hot days in 30 yrs
- —
Wind risk No data
- Chance of severe wind over 30 yrs
- —
Air-quality risk No data
- Unhealthy air days now
- —
- Unhealthy air days in 30 yrs
- —
Risk factors via First Street. Map © Google.
Why this score? — see what drove the D+ grade
The composite is a weighted blend of 9 inputs, each scored 0–100. Each bar is that input's sub-score; the figure is the points it added to the 100-point composite (weight × sub-score).
- Cash flow +15.0/30.0
- ARV discount +7.5/15.0
- Schools +5.4/10.0
- 1% rule +5.0/10.0
- DSCR +5.0/10.0
- Livability +4.5/5.0
- Rent growth +2.8/5.0
- Condition / age +2.5/5.0
- Appreciation +0.0/10.0
$40,000
🖨 Deal sheet 📄 Offer letter ✓ Due diligence
Listing remarks
This freshly cleaned home is a great deal for a larger single wide in a nice park. It is 2 bed, 1 and 3/4 bath with carport and large shed for lots of extra storage or a workshop for projects or crafts. It is electrified for light and power tools and has a workbench and storage shelves. The bedrooms in the home are at the 2 ends of the home and are both fairly large with kitchen with eating space and large living room in the middle. There is a new washing machine and newer fridge and oven. The home needs some updating but with a little time and effort it can be a very nice home. The park has a single entrance so there is no through traffic making for a safe and secure environment. The clubh
Key facts
- Single entrance
- Functional kitchen
- Clubhouse
Tags
Property features AI
Finance
- Other: Taxes reported; Bus line nearby; Directions available to park entrance
- Financial info: Listing terms: Cash
- HOA & community: Manufactured home park approved for sale; Park amenities: Clubhouse, common area, exercise room, high-speed internet available, RV parking; Senior community; Pets allowed (cats OK, dogs OK — see remarks); Approximately 70 homes in the park; Land lease: $1,350
Exterior
- Parking: Carport
- Utilities: Electric energy; Public water; Public sewer; Electric water heater (outside closet, west side); Cable connected (Xfinity); Power provided by Sno PUD
- Home design: Manufactured single-wide home; One story; South-facing entry
- Construction: Metal/vinyl construction materials; Built-up roof; Pillar/post/pier foundation; Mobile home remains
- Exterior features: Metal/vinyl exterior; Cul-de-sac lot; Paved access; Skirted with metal
Interior
- Kitchen: Dishwasher; Refrigerator; Stove/Range
- Bedrooms: 2 bedrooms
- Flooring: Vinyl flooring; Carpet flooring
- Bathrooms: 1 full bathroom; 1 three-quarter bathroom; 1 bathtub; 2 showers
- Heating & cooling: Forced air heating; Forced air cooling
- Interior features: Water heater; Kitchen with eating space; Living room
- Laundry & utility: Washer included
Neighborhood map
What this means for you Summary
Snapshot
- This is a 2-bed/2.0-bath manufactured listed at $40k.
Deal economics
- At list price, monthly cash flow is $2k ($18k/yr) — positive.
- The deal already cash-flows at list — no discount required.
- Meets the 1% rule at list price ($2k rent vs $40k).
- Recommended offer: $39k (3.0% below list) — sets the bar for market timing.
- Cap rate 51.7% vs local median 2.4% in North Lynnwood — top-decile yield for the area; either an underpriced asset or a hidden risk that comps aren't pricing in. Stress-test before assuming the spread holds.
Location & tenants
- Location reads 90/100 on livability (#6 in WA, #107 nationally) — a professional / high-income tenant draw. Strengths: schools A+, amenities A+, commute A+; Watch: cost of living F.
- Edmonds School District (suburban): math 54% / reading 65% proficiency, ranked #53 of 291 in WA (top 18%) — acceptable for families but not a draw, mixed tenant base, ~2y average lease.
- Market conditions: Rents rising (+1.2%/yr); 232 active listings in the ZIP; 40 comparable units currently listed for rent nearby; rentals leasing fast (median 3d on market — plan ~1-2 weeks tenant-placement turnaround); solid renter incomes; 3,982 units permitted in Snohomish County in 2024 (1,492 in 5+ unit buildings).
Forward outlook
- Local home prices are declining (-3.0%/yr); year-one equity from $277 of loan paydown is wiped out by about $1k of value loss. Plan a longer hold.
- Snohomish County population projected at +30% by 2050 — long-run rental-demand tailwind backs the buy-and-hold thesis.
- At projected returns (-3.0% appreciation + 1.2% rent growth), your $11k cash investment doubles in ~1 year — after that, you're playing with house money.
Negotiation context
- It's been on market 35 days — a 3% lower offer ($39k) is reasonable based on typical stale-listing flexibility.
- 4 sale attempts; this cycle's ask has dropped $5k (11%) from the opening price — seller is motivated, your offer sets the floor, not the list.
Questions for the listing agent
- It's been on market 35 days. Have you received any prior offers? Is the seller open to a 3% concession, seller financing, or rate buy-down credit?
- Built in 1976 — when were the roof, HVAC, electrical panel, plumbing, and water heater last replaced?
- Is there a deadline driving the sale (1031 exchange, divorce, estate, relocation)? That informs how much negotiation room exists.
- Schools are A-rated — typically a magnet for longer-tenancy family renters. What's the average tenant stay here, and is there a school-zone premium baked into asking?
- The area grade is low — what's the realistic commute time and amenity access for the typical tenant pool here? Any planned neighborhood developments (good or bad) we should know about?
- What's the average days-on-market for RENTAL listings here right now (not sales)? A rising rental-DOM trend means longer vacancies and softer asking-rent achievability than the comps imply.
- What's the recent tenant-quality profile in this submarket — average credit score on applications, eviction rate, late-payment / NSF rate, and stable-employment percentage? A property-management company in the area should have these aggregated.
- How much new for-sale + rental construction is in the pipeline within 1–3 miles? Heavy new supply typically softens prices + rents 12–24 months out; constrained supply supports both.
Investment metrics
- 1% rule
- 5.61% ✓
- Cap rate
- 51.68%
- Cash-on-cash
- 162.10%
- DSCR
- 8.21
- GRM
- 1.5
CMA / ARV
- ARV (median comp)
- $95,387
- List price
- $40,000
- Delta
- -58.07%
- Verdict
- UNDERPRICED
- Comps
- 5 within 1.0 mi
Show comp detail 4 sales within ~0.75 mi
| Address | Dist | Beds/Ba | Sqft | Sold | Price | $/sf | Match |
|---|---|---|---|---|---|---|---|
| 4111 164th St SW #16 | 0.00mi | 2/2.0 | 952 (0%) | 0mo | $40,000 | $42 | 100 |
| 4111 164th St SW #36 | 0.00mi | 2/1.0 | 924 (-3%) | 4mo | $39,900 | $43 | 87 |
| 3832 164th St SW #10 | 0.27mi | 2/2.0 | 924 (-3%) | 11mo | $113,556 | $123 | 73 |
| 3832 164th St SW Unit 9 | 0.27mi | 2/2.0 | 1,008 (+6%) | 8mo | $95,000 | $94 | 70 |
Match score weights: distance 35% · size 25% · config 20% · recency 20%. Top-matched comps best support the ARV.
Projected returns pro-forma
-3.0% appreciation · 1.22% rent growth · sell at horizon
- IRR
- —
- Equity multiple
- 8.67×
- Total profit
- $85,951
- Equity at exit
- $5,964
- IRR
- —
- Equity multiple
- 17.37×
- Total profit
- $183,386
- Equity at exit
- $3,458
Cash invested: $11,200 (down + closing). Projections, not guarantees.
Landlord ↔ Tenant lean methodology
- Overall (STATE)
- 28 Tenant-Leaning
- State Washington
- 28 Tenant-Leaning · D+8
- County
- — inherits STATE
- City
- — inherits STATE
ZIP-level market 98087
- Rents YoY
- 1.2%
- Active inventory
- 232
- Price-to-rent
- 1.5×
Monthly cashflow live
- Estimated rent
- $2,243 high interval (Pro) →
- Mortgage (P&I)
- −$210
- Tax from tax record
- −$33 /mo · $393/yr
- Insurance
- −$17
- HOA
- −$0
- Vacancy / Maint / Mgmt
- −$471
- Net cashflow
- $1,513
Break-even live
UW: 25.0% down · 7.5% · 30yr · 1.5% tax · 5.0% vac · 8.0% maint · 8.0% mgmt
Financing live
Cash to close
- Down payment
- $10,000
- Closing costs
- $1,200
- Reserves months
- —
- Total cash needed
- —
Loan-product check · same deal, 3 products live
Conventional
25% down · 7.5% · 30yr
- Down + closing
- —
- Monthly P&I
- —
- Monthly cashflow
- —
- DSCR
- —
- Eligible?
- —
Personal DTI + credit; lowest rate.
DSCR
20% down · 8.5% · 30yr
- Down + closing
- —
- Monthly P&I
- —
- Monthly cashflow
- —
- DSCR
- —
- Eligible?
- —
No personal income docs; deal must DSCR.
Hard money
10% down · 12.0% · 12mo
- Down + closing
- —
- Monthly P&I
- —
- Monthly cashflow
- —
- DSCR
- —
- Eligible?
- —
Short-term bridge; refi at stabilization.
Rent comps 40 comps
| Address | Beds | Baths | Sqft | Rent | $/sqft | DOM | Units | Dist |
|---|---|---|---|---|---|---|---|---|
| 4217 164th St SW Unit A204 Lynnwood, WA | 3.0 | 2.0 | 1100 | $2,450 | $2.23 | 44d | 1 | 0.11mi |
| 3805 164th St SW Lynnwood, WA | 1.0–2.0 | 1.0–2.0 | 843 | $2,295 | $2.72 | 2d | 5 | 0.20mi |
| 15914 44th Ave W Lynnwood, WA | 1.0–2.0 | 1.0–2.0 | 932 | $2,159 | $2.32 | 2d | 10 | 0.26mi |
| 3711 164th St SW Lynnwood, WA | 1.0–2.0 | 1.0–2.0 | 845 | $2,533 | $3.00 | 2d | 7 | 0.27mi |
| 2510 164th St SW Lynnwood, WA | 3.0 | 1.0–2.0 | 998 | $2,670 | $2.68 | 2d | 1 | 0.32mi |
| 15700 44th Ave W Lynnwood, WA | 1.0–3.0 | 1.0–2.0 | 940 | $1,979 | $2.11 | 2d | 1 | 0.33mi |
| 16419 Spruce Way Lynnwood, WA | 2.0 | 2.0 | 946 | $2,550 | $2.70 | 2d | 1 | 0.33mi |
| 16104 36th Ave W Lynnwood, WA | 1.0–2.0 | 1.0 | 761 | $2,099 | $2.76 | 3d | 6 | 0.33mi |
| 16419 Spruce Way Unit H4 Lynnwood, WA | 2.0 | 2.0 | 900 | $2,350 | $2.61 | 44d | 1 | 0.34mi |
| 4109 156th St SW Unit A3 Lynnwood, WA | 2.0 | 1.0 | 988 | $1,895 | $1.92 | 24d | 1 | 0.35mi |
| 4109 156th St SW Unit B4 Lynnwood, WA | 2.0 | 1.0 | 985 | $1,995 | $2.03 | 44d | 1 | 0.35mi |
| 3333 164th St SW Lynnwood, WA | 1.0–2.0 | 1.0–2.0 | 1048 | $2,518 | $2.40 | 3d | 20 | 0.39mi |
| 4525 164th St SW Lynnwood, WA | 2.0–3.0 | 1.0–2.0 | 1093 | $1,902 | $1.74 | 2d | 13 | 0.41mi |
| 15713 35th Ave W Lynnwood, WA | 2.0 | 1.0 | 940 | $2,000 | $2.13 | 24d | 1 | 0.47mi |
| 16200 Admiralty Way Lynnwood, WA | 2.0 | 1.0–2.0 | 783 | $3,019 | $3.86 | 2d | 33 | 0.57mi |
| 16003 Admiralty Way Lynnwood, WA | 1.0–4.0 | 1.0–2.0 | 1156 | $1,891 | $1.64 | 2d | 5 | 0.63mi |
| 16604 48th Ave W Lynnwood, WA | 1.0–3.0 | 1.0–2.0 | 890 | $2,162 | $2.43 | 3d | 9 | 0.63mi |
| 3116 164th St SW #2211 Lynnwood, WA | 2.0 | 1.5 | 1100 | $2,475 | $2.25 | 5d | 1 | 0.68mi |
| 16308 52nd Ave W Unit 4 Edmonds, WA | 2.0 | 1.0 | 900 | $1,795 | $1.99 | 11d | 1 | 0.72mi |
| 15001 35th Ave W Lynnwood, WA | 1.0–3.0 | 1.0–2.0 | 885 | $2,010 | $2.27 | 5d | 15 | 0.79mi |
| 17314 44th Ave W Unit C Lynnwood, WA | 2.0 | 1.5 | 1000 | $2,200 | $2.20 | 18d | 1 | 0.81mi |
| 3717 148th St SW Lynnwood, WA | 2.0 | 1.0–2.0 | 865 | $1,912 | $2.21 | 2d | 6 | 0.88mi |
| 4902 148th St SW Edmonds, WA | 1.0–2.0 | 1.0–2.0 | 801 | $2,221 | $2.77 | 2d | 10 | 0.90mi |
| 17529 44th Ave W Lynnwood, WA | 2.0 | 1.0 | 1000 | $2,395 | $2.40 | 4d | 1 | 0.96mi |
| 4410 176th St SW Lynnwood, WA | 1.0–2.0 | 1.0 | 770 | $1,850 | $2.40 | 5d | 3 | 1.00mi |
| 4432 176th St SW Unit 2 Lynnwood, WA | 2.0 | 2.0 | 1004 | $2,195 | $2.19 | 24d | 1 | 1.07mi |
| 4432 176th St SW Unit 3 Lynnwood, WA | 2.0 | 2.0 | 1004 | $2,195 | $2.19 | 44d | 1 | 1.07mi |
| 4428 176th St SW Unit 4 Lynnwood, WA | 2.0 | 2.0 | 1004 | $2,195 | $2.19 | 24d | 1 | 1.07mi |
| 4702 176th St SW Lynnwood, WA | 1.0–2.0 | 1.0 | 886 | $1,925 | $2.17 | 2d | 8 | 1.08mi |
| 4816 176th St SW Lynnwood, WA | 1.0–2.0 | 1.0–1.5 | 802 | $1,970 | $2.45 | 3d | 6 | 1.09mi |
| 4502 176th St SW Unit 2 Lynnwood, WA | 2.0 | 2.0 | 1004 | $2,195 | $2.19 | 44d | 1 | 1.11mi |
| 5419 172nd Pl SW Lynnwood, WA | 3.0 | 2.0 | 980 | $2,895 | $2.95 | 24d | 1 | 1.11mi |
| 17422 52nd Ave W Lynnwood, WA | 2.0 | 1.5 | 850 | $1,960 | $2.31 | 24d | 1 | 1.12mi |
| 17828 44th Ave W Unit 2 Lynnwood, WA | 2.0 | 2.0 | 750 | $2,100 | $2.80 | 44d | 1 | 1.14mi |
| 14611 Admiralty Way Lynnwood, WA | 1.0–3.0 | 1.0–2.0 | 1004 | $2,299 | $2.29 | 2d | 11 | 1.18mi |
| 14500 Admiralty Way Lynnwood, WA | 2.0 | 1.5 | 816 | $1,700 | $2.08 | 3d | 1 | 1.22mi |
| 16116 Ash Way Lynnwood, WA | 1.0–3.0 | 1.0–2.0 | 1000 | $2,420 | $2.42 | 3d | 9 | 1.34mi |
| 18031 36th Ave W Lynnwood, WA | 1.0–2.0 | 1.0–2.0 | 760 | $2,186 | $2.88 | 2d | 6 | 1.34mi |
| 16605 Ash Way Lynnwood, WA | 2.0 | 1.0–2.0 | 802 | $3,125 | $3.89 | 2d | 71 | 1.35mi |
| 18124 36th Ave W Lynnwood, WA | 1.0–2.0 | 1.0–2.0 | 821 | $2,155 | $2.62 | 3d | 8 | 1.36mi |
Listing history 9 events
-
2026-05-06price $40,000
-
2026-04-21$45,000 Active
-
2025-12-12soldstatus $39,950 Closed
-
2025-12-03status Pending
-
2025-11-17status Active
-
2025-11-07status Pending
-
2025-10-30status Active
-
2025-10-20status Pending
-
2025-10-17$39,950 Active
ⓘ Source: listings_history table (triggers on properties + properties_extension) + one-shot
backfill from property_details.listing_events for pre-trigger history.
Tax reassessment forecast WA · Resets to sale price
- Current annual tax
- $393 · $33/mo
- Projected year-2 tax
- $393 · $33/mo
- Expected delta
- $0/yr ($0/mo · 0.0%)
ⓘ Screening estimate from a state-policy table — verify with the county assessor before closing.
Nearby sold comps map
Loading sold comps map…
Walkable amenities ~0.75 mi
Loading nearby amenities…
Taxation est. · year 1
- Rental income
- $26,918
- − Mortgage interest
- −$2,241
- − Property taxes
- −$393
- − Insurance
- −$200
- − Repairs & maintenance
- −$2,153
- − Management
- −$2,153
- − Depreciation
- −$1,164
- Taxable income
- $18,614
- Est. tax owed @ 24.0%
- −$4,467
- After-tax cash flow
- $13,688/yr
For passive investors: Depreciation is non-cash, so a rental often shows a tax loss while cash-flowing — sheltering income. Rental losses are passive: they offset passive income freely, and up to $25,000/yr can offset ordinary (W-2) income if you actively participate and your MAGI is under $100k (phasing out to $0 by $150k); unused losses carry forward. On sale, claimed depreciation is recaptured at up to 25%, and gains may owe capital-gains tax (a 1031 exchange can defer both). Figures are a year-1 estimate at your 24.0% rate — not tax advice; consult a CPA.
Schools (NCES district)
- District
- Edmonds School District
- NCES district ID
- 5302400
- Math proficiency
- 54% ▼ -1.00%
- Reading proficiency
- 65% ▬ 0.00%
- Median HH income
- $67,451
- Composite
- 53.94/100
- National rank
- #3026
- State rank
- #53 of 291 in WA
Livability — North Lynnwood
- Score
- 90/100
- State rank
- #6
- US rank
- #107
Category grades
Schools grade is shown separately in the Schools card above.
Census & demographics
- Census place
- North Lynnwood, WA
- County
- Snohomish County · 786,756 people
- City population
- 40,607
- Metro
- Seattle-Tacoma-Bellevue, WA
- Population (ZIP)
- 41,796
- Household income
- $106,693
- Rent vs Own
- Severe rent burden
- 2303.0
Population outlook (Snohomish County) Hauer SSP2
- Today (2025)
- 899,800 people
- By 2030
- 960,975 · +6.8%
- By 2040
- 1,074,447 · +19.4%
- By 2050
- 1,171,954 · +30.2%
- By 2075
- 1,384,849 · +53.9%
- By 2100
- 1,497,296 · +66.4%
Race, ethnicity, and origin ACS 2023
- Neighborhood character
- Highly diverse neighborhood (Simpson 0.71)
- Race & ethnicity
- White 48% Asian 20% Two or more races 13% Hispanic / Latino 12% Black 8% Pacific Islander 2%
- Hispanic origin (detail)
- Mexican 8%
- Common ancestry
- Portuguese 3% Slovak 3% Italian 3%
- Foreign-born
- 29% · Canada, South Korea, Vietnam
- Languages at home
- 64% English-only · Spanish 6% Russian/Polish/Slavic 5% Other Indo-European 5%
Political lean MEDSL · Snohomish
- 2024 margin
- D (+19.0) · D 57.8% · R 38.9% · Other 3.3%
- 2008→2024 swing
- +0.1pp no change · 2008: 18.9pp · 2024: 19.0pp
- All cycles
- 2024: D+19.0 2020: D+20.6 2016: D+16.6 2012: D+16.2 2008: D+18.9
Not yet ingested
- Civics
- —
Market trends
- HPI YoY
- ▼ -723.54%
- Current HPI
- 320.6888
- Rent YoY
- ▲ 1.22%
- Metro
- Seattle-Tacoma-Bellevue, WA
- State GDP YoY
- ▲ 4.65%
- F500 in state
- 22
Industry mix (Fortune 500 HQ in WA)
| Industry | F500 HQs | Revenue |
|---|---|---|
| Retail | 2 | $269B |
|
||
| Technology / Retail | 1 | $638B |
|
||
| Technology | 1 | $245B |
|
||
| Telecommunications | 1 | $38B |
|
||
| Food / Beverage | 1 | $36B |
|
||
| Automotive / Trucks | 1 | $34B |
|
||
Price history
+0.1% since first listed11 events — show timeline
- 2026-06-09 Sold (MLS) $40,000 NWMLS as Distributed by MLS Grid
- 2026-05-28 Pending — NWMLS as Distributed by MLS Grid
- 2026-05-06 Price Changed $40,000 NWMLS as Distributed by MLS Grid
- 2026-04-21 Listed $45,000 NWMLS as Distributed by MLS Grid
- 2025-12-12 Sold (MLS) $39,950 NWMLS as Distributed by MLS Grid
- 2025-12-03 Pending — NWMLS as Distributed by MLS Grid
- 2025-11-17 Relisted — NWMLS as Distributed by MLS Grid
- 2025-11-07 Pending — NWMLS as Distributed by MLS Grid
- 2025-10-30 Relisted — NWMLS as Distributed by MLS Grid
- 2025-10-20 Pending — NWMLS as Distributed by MLS Grid
- 2025-10-17 Listed $39,950 NWMLS as Distributed by MLS Grid
Property tax history
+7.3%/yrLatest (2026): $393 · +13.2% YoY. Source: county tax records.
Cash-flow waterfall
monthlySold comps — $/sqft
last 12 mo · ≤1 miLoading sold comps…