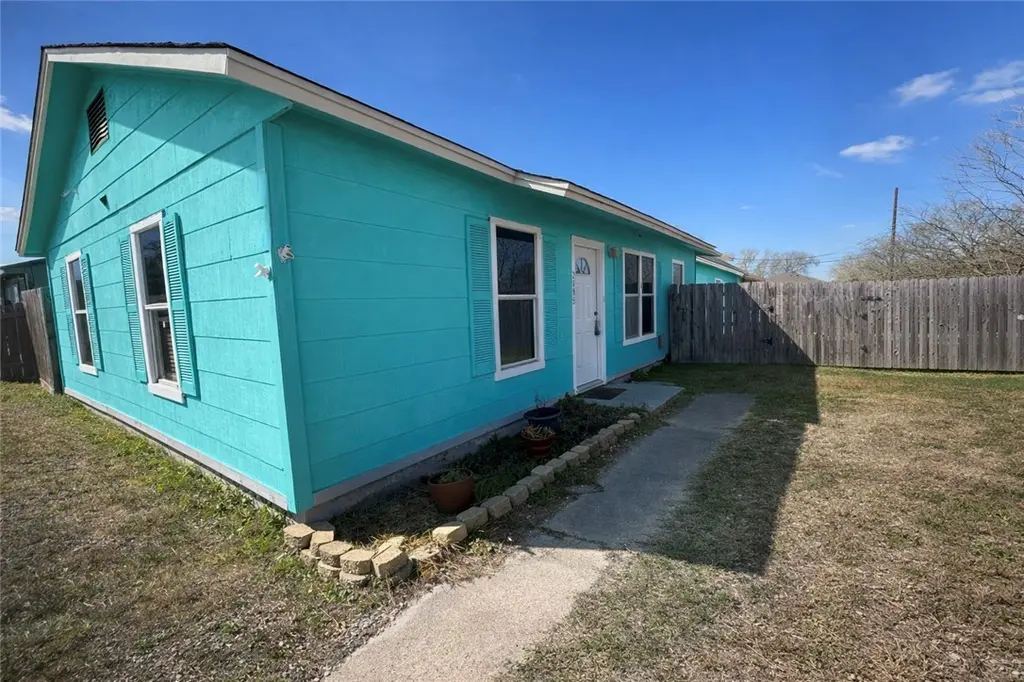
2695 Avenue I · Ingleside, TX
Flood risk 6/10 · Moderate
- FEMA flood zone
- X (unshaded)
- Chance of flooding over 30 yrs
- 0.67%
- Est. flood insurance / yr
- $507 – $1,088
Fire risk 2/10 · Minimal
- Est. fire insurance / yr
- $1,222 – $2,270
Heat risk 10/10 · Severe
- Hot days now (above 106°F)
- 7 days/yr
- Hot days in 30 yrs
- 28 days/yr
Wind risk 9/10 · Severe
- Chance of severe wind over 30 yrs
- 99.0%
Air-quality risk 1/10 · Minimal
- Unhealthy air days now
- 0 days/yr
- Unhealthy air days in 30 yrs
- 0 days/yr
Risk factors via First Street. Map © Google.
Why this score? — see what drove the C- grade
The composite is a weighted blend of 9 inputs, each scored 0–100. Each bar is that input's sub-score; the figure is the points it added to the 100-point composite (weight × sub-score).
- Cash flow +19.0/30.0
- ARV discount +12.4/15.0
- DSCR +6.0/10.0
- 1% rule +5.5/10.0
- Schools +3.6/10.0
- Livability +3.6/5.0
- Condition / age +2.5/5.0
- Appreciation +0.0/10.0
- Rent growth +0.0/5.0
$139,900
🖨 Deal sheet 📄 Offer letter ✓ Due diligence
Listing remarks MLS
AMAZING 3 BEDROOM 1 BATH, HUGE LOT! THIS HOME IS SUCH A DOLLHOUSE, PLUS THERE IS A LARGE (SIZE OF A TINY HOME ) STORAGE IN THE BACK. PRICED TO SELL. SELLER HAS DONE SOME PAINTING AND ADDED NEW CABINETS AND COUNTER TOP IN THE KITCHEN.
Key facts
- Recent water heater
- Storage
- Laundry room
Tags
Neighborhood map
What this means for you Summary
Snapshot
- This is a 3-bed/1.0-bath single-family listed at $140k.
Deal economics
- At list price, monthly cash flow is $146 ($2k/yr) — positive.
- The deal already cash-flows at list — no discount required.
- Meets the 1% rule at list price ($1k rent vs $140k).
- Cap rate 7.5% vs local median 3.4% in Ingleside — top-decile yield for the area; either an underpriced asset or a hidden risk that comps aren't pricing in. Stress-test before assuming the spread holds.
Location & tenants
- Location reads 71/100 on livability (#323 in TX) — a middle-class / working-renter tenant base. Strengths: cost of living A+, housing A+, employment B; Watch: schools D+, crime F, amenities F.
- Ingleside ISD (town): math 39% / reading 44% proficiency, ranked #319 of 826 in TX (top 39%) — families likely to look elsewhere, expect single-tenant / working-renter base with shorter leases.
- Market conditions: Rents falling (-11.8%/yr); 146 active listings in the ZIP; 5 comparable units currently listed for rent nearby; rentals leasing fast (median 14d on market — plan ~1-2 weeks tenant-placement turnaround); 40% of comp listings sitting > 30 days — soft ceiling on asking rent; 344 units permitted in San Patricio County in 2024 (0 in 5+ unit buildings).
Forward outlook
- Local home prices are declining (-3.0%/yr); year-one equity from $967 of loan paydown is wiped out by about $4k of value loss. Plan a longer hold.
- San Patricio County population projected at +27% by 2050 — long-run rental-demand tailwind backs the buy-and-hold thesis.
Negotiation context
- Only 12 days on market — expect competitive offers; lowballing is unlikely to land.
- 9 sale attempts since 16y ago with the ask held roughly flat each time — persistent listings suggest the price (not the market) is what's stuck; bring a comps-based counter.
Risks & watch-outs
- Watch-outs: built in 1958 — expect roof / HVAC / electrical / plumbing capex.
- Climate carrying-cost: major flood risk; severe wind risk, 99% chance of damaging wind over 30y; extreme-heat days projected 7→28/yr by 2055 (HVAC capex compounding) — expect insurance premiums to compound above CPI over the hold.
Questions for the listing agent
- Built in 1958 — when were the roof, HVAC, electrical panel, plumbing, and water heater last replaced?
- Is there a deadline driving the sale (1031 exchange, divorce, estate, relocation)? That informs how much negotiation room exists.
- Schools are D-rated, which usually means shorter tenancies and higher turnover. Who's the typical renter profile here, and what's been the actual vacancy rate?
- Crime grade is F in this area — have there been break-ins, vandalism, or insurance claims at this property in the last 3 years? What carrier currently insures it and at what premium?
- What's the average days-on-market for RENTAL listings here right now (not sales)? A rising rental-DOM trend means longer vacancies and softer asking-rent achievability than the comps imply.
- What's the recent tenant-quality profile in this submarket — average credit score on applications, eviction rate, late-payment / NSF rate, and stable-employment percentage? A property-management company in the area should have these aggregated.
- How much new for-sale + rental construction is in the pipeline within 1–3 miles? Heavy new supply typically softens prices + rents 12–24 months out; constrained supply supports both.
Investment metrics
- 1% rule
- 1.05% ✓
- Cap rate
- 7.55%
- Cash-on-cash
- 4.49%
- DSCR
- 1.20
- GRM
- 7.9
CMA / ARV
- ARV (median comp)
- $157,162
- List price
- $139,900
- Delta
- -10.98%
- Verdict
- UNDERPRICED
- Comps
- 20 within 1.0 mi
Show comp detail 7 sales within ~0.75 mi
| Address | Dist | Beds/Ba | Sqft | Sold | Price | $/sf | Match |
|---|---|---|---|---|---|---|---|
| 2325 2nd St | 0.14mi | 2/2.0 (-1) | 888 (+3%) | 22mo | $179,000 | $202 | 61 |
| 2747 Avenue K | 0.16mi | 2/1.0 (-1) | 924 (+7%) | 21mo | $164,900 | $178 | 58 |
| 2704 Avenue F | 0.16mi | 3/1.0 | 962 (+11%) | 20mo | $62,500 | $65 | 57 |
| 2556 Avenue B | 0.47mi | 3/1.0 | 904 (+5%) | 23mo | $157,000 | $174 | 52 |
| 2571 First St | 0.43mi | 2/1.0 (-1) | 968 (+12%) | 6mo | $169,900 | $176 | 50 |
| 2553 Avenue C | 0.44mi | 2/2.0 (-1) | 968 (+12%) | 10mo | $199,000 | $206 | 42 |
| 3007 Sunset Dr | 0.71mi | 3/1.5 | 960 (+11%) | 10mo | $132,500 | $138 | 38 |
Match score weights: distance 35% · size 25% · config 20% · recency 20%. Top-matched comps best support the ARV.
Projected returns pro-forma
-3.0% appreciation · 0.0% rent growth · sell at horizon
- IRR
- -12.9%
- Equity multiple
- 0.55×
- Total profit
- $-17,601
- Equity at exit
- $20,860
- IRR
- -9.6%
- Equity multiple
- 0.50×
- Total profit
- $-19,765
- Equity at exit
- $12,096
Cash invested: $39,172 (down + closing). Projections, not guarantees.
Landlord ↔ Tenant lean methodology
- Overall (STATE)
- 87 Strongly Landlord-Friendly
- State Texas
- 87 Strongly Landlord-Friendly · R+5
- County
- — inherits STATE
- City
- — inherits STATE
ZIP-level market 78362
- Home prices YoY
- -21.7%
- Rents YoY
- -11.8%
- Active inventory
- 146
- Price-to-rent
- 7.9×
Monthly cashflow live
- Estimated rent
- $1,471 high interval (Pro) →
- Mortgage (P&I)
- −$734
- Tax from tax record
- −$224 /mo · $2,686/yr
- Insurance
- −$58
- HOA
- −$0
- Vacancy / Maint / Mgmt
- −$309
- Net cashflow
- $146
Break-even live
UW: 25.0% down · 7.5% · 30yr · 1.5% tax · 5.0% vac · 8.0% maint · 8.0% mgmt
Financing live
Cash to close
- Down payment
- $34,975
- Closing costs
- $4,197
- Reserves months
- —
- Total cash needed
- —
Loan-product check · same deal, 3 products live
Conventional
25% down · 7.5% · 30yr
- Down + closing
- —
- Monthly P&I
- —
- Monthly cashflow
- —
- DSCR
- —
- Eligible?
- —
Personal DTI + credit; lowest rate.
DSCR
20% down · 8.5% · 30yr
- Down + closing
- —
- Monthly P&I
- —
- Monthly cashflow
- —
- DSCR
- —
- Eligible?
- —
No personal income docs; deal must DSCR.
Hard money
10% down · 12.0% · 12mo
- Down + closing
- —
- Monthly P&I
- —
- Monthly cashflow
- —
- DSCR
- —
- Eligible?
- —
Short-term bridge; refi at stabilization.
Rent comps 5 comps
| Address | Beds | Baths | Sqft | Rent | $/sqft | DOM | Units | Dist |
|---|---|---|---|---|---|---|---|---|
| 2850 Avenue J Ingleside, TX | 1.0–2.0 | 1.0–2.0 | 917 | $1,495 | $1.63 | 13d | 9 | 0.29mi |
| 2706 State Highway 361 Ingleside, TX | 1.0–3.0 | 1.0–2.0 | 884 | $1,705 | $1.93 | 13d | 9 | 0.91mi |
| 2114 Zephyr Cir Unit A Ingleside, TX | 2.0 | 1.0 | 900 | $1,150 | $1.28 | 43d | 1 | 0.97mi |
| 2100 Breezeway Cir Unit 20 Ingleside, TX | 2.0 | 1.5 | 1050 | $1,150 | $1.10 | 43d | 1 | 1.02mi |
| 2109 Breezeway Cir Ingleside, TX | 2.0 | 1.0 | 700 | $1,100 | $1.57 | 13d | 1 | 1.03mi |
Listing history 34 events
-
2026-06-14days on market $139,900 Active 12 DOM
-
2026-06-10days on market $139,900 Active 9 DOM
-
2026-06-09days on market $139,900 Active 8 DOM
-
2026-06-08days on market $139,900 Active 7 DOM
-
2026-06-07days on market $139,900 Active 6 DOM
-
2026-06-03days on market $139,900 Active 2 DOM
-
2026-06-02days on market $139,900 Active 1 DOM
-
2026-05-31days on market $139,900 Active 99 DOM
-
2026-05-30days on market $139,900 Active 98 DOM
-
2026-03-06$139,900 Active 234-char remark
Show marketing remark (234 chars)
AMAZING 3 BEDROOM 1 BATH, HUGE LOT! THIS HOME IS SUCH A DOLLHOUSE, PLUS THERE IS A LARGE (SIZE OF A TINY HOME ) STORAGE IN THE BACK. PRICED TO SELL. SELLER HAS DONE SOME PAINTING AND ADDED NEW CABINETS AND COUNTER TOP IN THE KITCHEN.
-
2026-03-06price $139,900 234-char remark
Show marketing remark (234 chars)
AMAZING 3 BEDROOM 1 BATH, HUGE LOT! THIS HOME IS SUCH A DOLLHOUSE, PLUS THERE IS A LARGE (SIZE OF A TINY HOME ) STORAGE IN THE BACK. PRICED TO SELL. SELLER HAS DONE SOME PAINTING AND ADDED NEW CABINETS AND COUNTER TOP IN THE KITCHEN.
-
2026-03-03historical 234-char remark
Show marketing remark (234 chars)
AMAZING 3 BEDROOM 1 BATH, HUGE LOT! THIS HOME IS SUCH A DOLLHOUSE, PLUS THERE IS A LARGE (SIZE OF A TINY HOME ) STORAGE IN THE BACK. PRICED TO SELL. SELLER HAS DONE SOME PAINTING AND ADDED NEW CABINETS AND COUNTER TOP IN THE KITCHEN.
-
2026-03-03status Pending 234-char remark
Show marketing remark (234 chars)
AMAZING 3 BEDROOM 1 BATH, HUGE LOT! THIS HOME IS SUCH A DOLLHOUSE, PLUS THERE IS A LARGE (SIZE OF A TINY HOME ) STORAGE IN THE BACK. PRICED TO SELL. SELLER HAS DONE SOME PAINTING AND ADDED NEW CABINETS AND COUNTER TOP IN THE KITCHEN.
-
2026-02-28historical 234-char remark
Show marketing remark (234 chars)
AMAZING 3 BEDROOM 1 BATH, HUGE LOT! THIS HOME IS SUCH A DOLLHOUSE, PLUS THERE IS A LARGE (SIZE OF A TINY HOME ) STORAGE IN THE BACK. PRICED TO SELL. SELLER HAS DONE SOME PAINTING AND ADDED NEW CABINETS AND COUNTER TOP IN THE KITCHEN.
-
2026-02-16$135,900 Active 234-char remark
Show marketing remark (234 chars)
AMAZING 3 BEDROOM 1 BATH, HUGE LOT! THIS HOME IS SUCH A DOLLHOUSE, PLUS THERE IS A LARGE (SIZE OF A TINY HOME ) STORAGE IN THE BACK. PRICED TO SELL. SELLER HAS DONE SOME PAINTING AND ADDED NEW CABINETS AND COUNTER TOP IN THE KITCHEN.
-
2025-06-02$135,500 Active
-
2020-04-01historical
-
2020-03-27soldstatus Closed
-
2020-03-25soldstatus
-
2020-03-01$89,000 Active
-
2019-12-29historical
-
2019-12-03status Active
-
2019-11-18historical
-
2019-10-23price $93,000
-
2019-10-11status Active
-
2019-10-05historical Option Period
-
2019-09-18price $89,900
-
2019-09-01price $99,900
-
2019-08-17$102,500 Active
-
2014-12-22soldstatus
-
2014-12-18soldstatus
-
2014-05-29$69,900
-
2010-12-20$68,000
-
1991-01-08soldstatus
ⓘ Source: listings_history table (triggers on properties + properties_extension) + one-shot
backfill from property_details.listing_events for pre-trigger history.
Tax reassessment forecast TX · Resets to sale price
- Current annual tax
- $2,686 · $224/mo
- Projected year-2 tax
- $2,686 · $224/mo
- Expected delta
- $0/yr ($0/mo · 0.0%)
ⓘ Screening estimate from a state-policy table — verify with the county assessor before closing.
Climate risk First Street
- Flood 6/10 Major FEMA zone X (unshaded) · 67% chance over 30 yrs
- Wildfire 2/10 Low
- Heat 10/10 Extreme 7 d/yr ≥106°F today · 28 d/yr by 30 yrs out
- Wind 9/10 Extreme 99% chance of damaging wind over 30 yrs
- Air quality 1/10 Low 0 unhealthy d/yr today · 0 by 30 yrs out
Nearby sold comps map
Loading sold comps map…
Walkable amenities ~0.75 mi
Loading nearby amenities…
Taxation est. · year 1
- Rental income
- $17,654
- − Mortgage interest
- −$7,837
- − Property taxes
- −$2,686
- − Insurance
- −$700
- − Repairs & maintenance
- −$1,412
- − Management
- −$1,412
- − Depreciation
- −$4,070
- Taxable loss
- −$462
- Est. tax savings @ 24.0%
- +$111
- After-tax cash flow
- $1,868/yr
For passive investors: Depreciation is non-cash, so a rental often shows a tax loss while cash-flowing — sheltering income. Rental losses are passive: they offset passive income freely, and up to $25,000/yr can offset ordinary (W-2) income if you actively participate and your MAGI is under $100k (phasing out to $0 by $150k); unused losses carry forward. On sale, claimed depreciation is recaptured at up to 25%, and gains may owe capital-gains tax (a 1031 exchange can defer both). Figures are a year-1 estimate at your 24.0% rate — not tax advice; consult a CPA.
Schools (NCES district)
- District
- Ingleside ISD
- NCES district ID
- 4824180
- Math proficiency
- 39% ▼ -9.00%
- Reading proficiency
- 44% ▲ 1.00%
- Median HH income
- $57,908
- Composite
- 36.48/100
- National rank
- #4659
- State rank
- #319 of 826 in TX
Livability — Ingleside
- Score
- 71/100
- State rank
- #323
- US rank
- #7128
Category grades
Schools grade is shown separately in the Schools card above.
Census & demographics
- Census place
- Ingleside, TX
- County
- San Patricio County · 31,224 people
- City population
- 10,816
- Metro
- Corpus Christi, TX
- Population (ZIP)
- 10,816
- Household income
- $71,058
- Rent vs Own
- Severe rent burden
- 226.0
Population outlook (San Patricio County) Hauer SSP2
- Today (2025)
- 75,538 people
- By 2030
- 79,575 · +5.3%
- By 2040
- 87,670 · +16.1%
- By 2050
- 96,107 · +27.2%
- By 2075
- 117,984 · +56.2%
- By 2100
- 130,010 · +72.1%
Race, ethnicity, and origin ACS 2023
- Neighborhood character
- Diverse neighborhood (Simpson 0.56)
- Race & ethnicity
- White 52% Hispanic / Latino 42% Two or more races 19% Black 2%
- Hispanic origin (detail)
- Mexican 39% Cuban 2%
- Common ancestry
- Slovak 1% Portuguese 1% Romanian 1%
- Foreign-born
- 8% · Canada
- Languages at home
- 78% English-only · Spanish 20%
Political lean MEDSL · San Patricio
- 2024 margin
- Solid R (+36.4) · D 31.4% · R 67.8%
- 2008→2024 swing
- -19.8pp toward R · 2008: -16.6pp · 2024: -36.4pp
- All cycles
- 2024: R+36.4 2020: R+29.1 2016: R+24.1 2012: R+20.6 2008: R+16.6
Not yet ingested
- Civics
- —
Market trends
- HPI YoY
- ▼ -54.88%
- Current HPI
- 197.9261
- Rent YoY
- ▼ -11.80%
- Metro
- Corpus Christi, TX
- State GDP YoY
- ▲ 3.95%
- F500 in state
- 110
Industry mix (Fortune 500 HQ in TX)
| Industry | F500 HQs | Revenue |
|---|---|---|
| Energy | 16 | $1,198B |
|
||
| Technology | 5 | $198B |
|
||
| Engineering / Construction | 4 | $72B |
|
||
| Energy Services | 3 | $60B |
|
||
| Utilities | 3 | $41B |
|
||
| Healthcare | 2 | $330B |
|
||
Price history
+105.7% since first listed25 events — show timeline
- 2026-03-06 Listed $139,900 CBMLS
- 2026-03-06 Price Changed $139,900 CBMLS
- 2026-03-03 Delisted — CBMLS
- 2026-03-03 Pending — CBMLS
- 2026-02-28 Delisted — CBMLS
- 2026-02-16 Listed $135,900 CBMLS
- 2025-06-02 Listed $135,500 CBMLS
- 2020-04-01 Delisted — CBMLS
- 2020-03-27 Sold (MLS) — CBMLS
- 2020-03-25 Sold (Public Records) — Public Records
- 2020-03-01 Listed $89,000 CBMLS
- 2019-12-29 Delisted — CBMLS
- 2019-12-03 Relisted — CBMLS
- 2019-11-18 Delisted — CBMLS
- 2019-10-23 Price Changed $93,000 CBMLS
- 2019-10-11 Relisted — CBMLS
- 2019-10-05 Contingent — CBMLS
- 2019-09-18 Price Changed $89,900 CBMLS
- 2019-09-01 Price Changed $99,900 CBMLS
- 2019-08-17 Listed $102,500 CBMLS
- 2014-12-22 Sold (Public Records) — Public Records
- 2014-12-18 Sold (MLS) — CBMLS
- 2014-05-29 Listed $69,900 CBMLS
- 2010-12-20 Listed $68,000 CBMLS
- 1991-01-08 Sold (Public Records) — Public Records
Property tax history
+10.7%/yrLatest (2025): $2,686 · +8.0% YoY. Source: county tax records.
Cash-flow waterfall
monthlySold comps — $/sqft
last 12 mo · ≤1 miLoading sold comps…