7097 Spring Garden Dr · Springfield, VA
Flood risk 1/10 · Minimal
- FEMA flood zone
- X (unshaded)
- Chance of flooding over 30 yrs
- 0.0%
- Est. flood insurance / yr
- $507 – $1,088
Fire risk 1/10 · Minimal
- Est. fire insurance / yr
- $666 – $1,236
Heat risk 7/10 · Major
- Hot days now (above 104°F)
- 7 days/yr
- Hot days in 30 yrs
- 16 days/yr
Wind risk 4/10 · Minor
- Chance of severe wind over 30 yrs
- 17.0%
Air-quality risk 3/10 · Minor
- Unhealthy air days now
- 2 days/yr
- Unhealthy air days in 30 yrs
- 3 days/yr
Risk factors via First Street. Map © Google.
Why this score? — see what drove the B- grade
The composite is a weighted blend of 9 inputs, each scored 0–100. Each bar is that input's sub-score; the figure is the points it added to the 100-point composite (weight × sub-score).
- Cash flow +25.3/30.0
- 1% rule +8.9/10.0
- DSCR +8.3/10.0
- ARV discount +7.5/15.0
- Schools +6.3/10.0
- Rent growth +5.0/5.0
- Livability +4.5/5.0
- Condition / age +2.5/5.0
- Appreciation +0.0/10.0
$235,000
🖨 Deal sheet 📄 Offer letter ✓ Due diligence
Listing remarks MLS
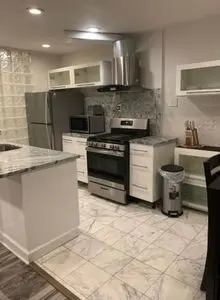
Affordable 3bed 2bath unit just walking distance from restaurants and grocery stores! Easy access to the highway and less than 5 miles from the upcoming new TSA HQ. Needs some TLC to make it your own. French doors open to the patio and provides quick access to the community pool. This is a great opportunity to own a large unit! Assigned parking right at the entrance of the building!
Key facts
- Metro only 5min away
- Renovated in 2022
- Built 1964
Tags
Neighborhood map
What this means for you Summary
Snapshot
- This is a 3-bed/2.0-bath condo listed at $235k.
Deal economics
- At list price, monthly cash flow is $530 ($6k/yr) — positive.
- The deal already cash-flows at list — no discount required.
- Meets the 1% rule at list price ($3k rent vs $235k).
- Recommended offer: $231k (1.5% below list) — sets the bar for market timing.
- Cap rate 9.0% vs local median 3.1% in Springfield — top-decile yield for the area; either an underpriced asset or a hidden risk that comps aren't pricing in. Stress-test before assuming the spread holds.
Location & tenants
- Location reads 90/100 on livability (#2 in VA, #77 nationally) — a professional / high-income tenant draw. Strengths: schools A+, crime A+, amenities A+; Watch: cost of living F.
- Fairfax County Public School District (suburban): math 61% / reading 73% proficiency, ranked #13 of 131 in VA (top 10%) — acceptable for families but not a draw, mixed tenant base, ~2y average lease.
- Market conditions: Rents rising fast (+11.1%/yr); 37 active listings in the ZIP; 12 comparable units currently listed for rent nearby; rentals at typical pace (median 22d on market — plan ~3-4 weeks tenant-placement turnaround); high-income renter base; 2,861 units permitted in Fairfax County in 2024 (1,829 in 5+ unit buildings).
- This rent runs 32% of the median local income ($123k/yr) — at the standard rent-burdened threshold; future hikes will face affordability resistance.
Forward outlook
- Local home prices are declining (-3.0%/yr); year-one equity from $2k of loan paydown is wiped out by about $7k of value loss. Plan a longer hold.
- Fairfax County population projected at +13% by 2050 — modest demand growth; plan on rents tracking national, not racing it.
- At projected returns (-3.0% appreciation + 8.0% rent growth), your $66k cash investment doubles in ~7 years — after that, you're playing with house money.
Negotiation context
- It's been on market 23 days — a 2% lower offer ($231k) is reasonable based on typical stale-listing flexibility.
- 4 sale attempts since 8y ago with the ask held roughly flat each time — persistent listings suggest the price (not the market) is what's stuck; bring a comps-based counter.
- Current owner paid $177k; 33% above their basis — modest negotiation headroom, anchor on the comps not their cost.
Risks & watch-outs
- Climate carrying-cost: extreme-heat days projected 7→16/yr by 2055 (HVAC capex compounding) — expect insurance premiums to compound above CPI over the hold.
Questions for the listing agent
- Built in 1964 — when were the roof, HVAC, electrical panel, plumbing, and water heater last replaced?
- What does the HOA fee cover, when was the last increase, and are there any pending special assessments or reserve-fund shortfalls?
- Any open or pending special assessments — roof, HVAC, plumbing, elevator, façade? What's the per-unit balance and payoff schedule, and is the seller paying it off at close or rolling it to the buyer?
- Is there a deadline driving the sale (1031 exchange, divorce, estate, relocation)? That informs how much negotiation room exists.
- Schools are A-rated — typically a magnet for longer-tenancy family renters. What's the average tenant stay here, and is there a school-zone premium baked into asking?
- What's the average days-on-market for RENTAL listings here right now (not sales)? A rising rental-DOM trend means longer vacancies and softer asking-rent achievability than the comps imply.
- What's the recent tenant-quality profile in this submarket — average credit score on applications, eviction rate, late-payment / NSF rate, and stable-employment percentage? A property-management company in the area should have these aggregated.
- How much new apartment / multifamily construction is in the pipeline within 1–3 miles? Heavy new supply (>2% of stock underway) typically softens rents 12–24 months out; light construction supports rent growth.
Investment metrics
- 1% rule
- 1.39% ✓
- Cap rate
- 9.00%
- Cash-on-cash
- 9.67%
- DSCR
- 1.43
- GRM
- 6.0
CMA / ARV
No comps found within radius.
Projected returns pro-forma
-3.0% appreciation · 8.0% rent growth · sell at horizon
- IRR
- 4.9%
- Equity multiple
- 1.20×
- Total profit
- $13,218
- Equity at exit
- $35,039
- IRR
- 19.1%
- Equity multiple
- 3.05×
- Total profit
- $134,599
- Equity at exit
- $20,319
Cash invested: $65,800 (down + closing). Projections, not guarantees.
Landlord ↔ Tenant lean methodology
- Overall (STATE)
- 55 Moderately Landlord-Leaning
- State Virginia
- 55 Moderately Landlord-Leaning · D+2
- County
- — inherits STATE
- City
- — inherits STATE
ZIP-level market 22150
- Rents YoY
- 11.1%
- Active inventory
- 37
- Price-to-rent
- 6.0×
Monthly cashflow live
- Estimated rent
- $3,257 high interval (Pro) →
- Mortgage (P&I)
- −$1,232
- Tax from tax record
- −$279 /mo · $3,345/yr
- Insurance
- −$98
- HOA est. from 1 same-building comp
- −$434
- Vacancy / Maint / Mgmt
- −$684
- Net cashflow
- $530
Break-even live
UW: 25.0% down · 7.5% · 30yr · 1.5% tax · 5.0% vac · 8.0% maint · 8.0% mgmt
Financing live
Cash to close
- Down payment
- $58,750
- Closing costs
- $7,050
- Reserves months
- —
- Total cash needed
- —
Loan-product check · same deal, 3 products live
Conventional
25% down · 7.5% · 30yr
- Down + closing
- —
- Monthly P&I
- —
- Monthly cashflow
- —
- DSCR
- —
- Eligible?
- —
Personal DTI + credit; lowest rate.
DSCR
20% down · 8.5% · 30yr
- Down + closing
- —
- Monthly P&I
- —
- Monthly cashflow
- —
- DSCR
- —
- Eligible?
- —
No personal income docs; deal must DSCR.
Hard money
10% down · 12.0% · 12mo
- Down + closing
- —
- Monthly P&I
- —
- Monthly cashflow
- —
- DSCR
- —
- Eligible?
- —
Short-term bridge; refi at stabilization.
Rent comps 12 comps
| Address | Beds | Baths | Sqft | Rent | $/sqft | DOM | Units | Dist |
|---|---|---|---|---|---|---|---|---|
| 6917 Villa del Rey Ct Springfield, VA | 2.0 | 2.5 | 1120 | $2,900 | $2.59 | 24d | 1 | 0.38mi |
| 6800 Spring Crest Dr Springfield, VA | 3.0 | 1.0–2.0 | 1021 | $4,734 | $4.63 | 2d | 94 | 0.59mi |
| 6320 Howe Pl Springfield, VA | 3.0 | 1.5 | 1204 | $3,100 | $2.57 | 5d | 1 | 0.72mi |
| 6116 Cumberland Ave Springfield, VA | 1.0–2.0 | 1.0 | 653 | $2,331 | $3.57 | 1d | 19 | 0.73mi |
| 6802 Junction Blvd Springfield, VA | 1.0–2.0 | 1.0–2.0 | 962 | $3,029 | $3.15 | 1d | 27 | 0.75mi |
| 7410 Dickenson St Springfield, VA | 3.0 | 1.5 | 1247 | $3,700 | $2.97 | 24d | 1 | 0.93mi |
| 6524 Greenleaf St Springfield, VA | 4.0 | 2.0 | 1125 | $1,100 | $0.98 | 44d | 1 | 1.20mi |
| 5909 Gloucester Ave Springfield, VA | 4.0 | 2.5 | 1360 | $3,500 | $2.57 | 21d | 1 | 1.21mi |
| 6631 Rockleigh Way Alexandria, VA | 2.0 | 3.5 | 1212 | $2,900 | $2.39 | 43d | 1 | 1.24mi |
| 6610 Bowie Dr Springfield, VA | 3.0 | 2.0 | 1102 | $3,400 | $3.09 | 10d | 1 | 1.26mi |
| 6497 Windham Ave Alexandria, VA | 2.0 | 1.0 | 728 | $2,400 | $3.30 | 43d | 1 | 1.28mi |
| 7504 June St Springfield, VA | 3.0 | 1.0 | 1404 | $2,850 | $2.03 | 3d | 1 | 1.35mi |
HOA detail condo
- Monthly dues
- $0 · $0/yr
- Likely covers
- poolparking
- Assessments
- None detected in remarks — confirm with the listing agent.
Listing history 25 events
-
2026-06-18days on market $235,000 Active 23 DOM
-
2026-06-17days on market $235,000 Active 22 DOM
-
2026-06-16days on market $235,000 Active 21 DOM
-
2026-06-15days on market $235,000 Active 20 DOM
-
2026-06-13days on market $235,000 Active 18 DOM
-
2026-06-13days on market $235,000 Active 17 DOM
-
2026-06-09days on market $235,000 Active 14 DOM
-
2026-06-08days on market $235,000 Active 13 DOM
-
2026-06-07days on market $235,000 Active 12 DOM
-
2026-06-04days on market $235,000 Active 9 DOM
-
2026-06-03days on market $235,000 Active 8 DOM
-
2026-06-02days on market $235,000 Active 7 DOM
-
2026-06-01days on market $235,000 Active 6 DOM
-
2026-05-31days on market $235,000 Active 5 DOM
-
2026-05-26$235,000 Active
-
2025-10-21historical $1,700
-
2025-10-13$1,700
-
2025-09-08historical $1,700
-
2025-09-06$1,700
-
2022-01-05price $1,650
-
2018-05-02soldstatus $177,000
-
2018-05-01soldstatus $177,000 Sold 385-char remark
Show marketing remark (385 chars)
Affordable 3bed 2bath unit just walking distance from restaurants and grocery stores! Easy access to the highway and less than 5 miles from the upcoming new TSA HQ. Needs some TLC to make it your own. French doors open to the patio and provides quick access to the community pool. This is a great opportunity to own a large unit! Assigned parking right at the entrance of the building!
-
2018-03-19status Contingent (No Kick Out) 385-char remark
Show marketing remark (385 chars)
Affordable 3bed 2bath unit just walking distance from restaurants and grocery stores! Easy access to the highway and less than 5 miles from the upcoming new TSA HQ. Needs some TLC to make it your own. French doors open to the patio and provides quick access to the community pool. This is a great opportunity to own a large unit! Assigned parking right at the entrance of the building!
-
2018-02-09$225,000 Active 385-char remark
Show marketing remark (385 chars)
Affordable 3bed 2bath unit just walking distance from restaurants and grocery stores! Easy access to the highway and less than 5 miles from the upcoming new TSA HQ. Needs some TLC to make it your own. French doors open to the patio and provides quick access to the community pool. This is a great opportunity to own a large unit! Assigned parking right at the entrance of the building!
-
1985-12-02soldstatus $63,500
ⓘ Source: listings_history table (triggers on properties + properties_extension) + one-shot
backfill from property_details.listing_events for pre-trigger history.
Tax reassessment forecast VA · Resets to sale price
- Current annual tax
- $3,345 · $279/mo
- Projected year-2 tax
- $3,345 · $279/mo
- Expected delta
- $0/yr ($0/mo · 0.0%)
ⓘ Screening estimate from a state-policy table — verify with the county assessor before closing.
Climate risk First Street
- Flood 1/10 Low FEMA zone X (unshaded) · 0% chance over 30 yrs
- Wildfire 1/10 Low
- Heat 7/10 Severe 7 d/yr ≥104°F today · 16 d/yr by 30 yrs out
- Wind 4/10 Moderate 17% chance of damaging wind over 30 yrs
- Air quality 3/10 Moderate 2 unhealthy d/yr today · 3 by 30 yrs out
Nearby sold comps map
Loading sold comps map…
Walkable amenities ~0.75 mi
Loading nearby amenities…
Taxation est. · year 1
- Rental income
- $39,089
- − Mortgage interest
- −$13,164
- − Property taxes
- −$3,345
- − Insurance
- −$1,175
- − Repairs & maintenance
- −$3,127
- − Management
- −$3,127
- − HOA
- −$5,208
- − Depreciation
- −$6,836
- Taxable income
- $3,107
- Est. tax owed @ 24.0%
- −$746
- After-tax cash flow
- $5,618/yr
For passive investors: Depreciation is non-cash, so a rental often shows a tax loss while cash-flowing — sheltering income. Rental losses are passive: they offset passive income freely, and up to $25,000/yr can offset ordinary (W-2) income if you actively participate and your MAGI is under $100k (phasing out to $0 by $150k); unused losses carry forward. On sale, claimed depreciation is recaptured at up to 25%, and gains may owe capital-gains tax (a 1031 exchange can defer both). Figures are a year-1 estimate at your 24.0% rate — not tax advice; consult a CPA.
Schools (NCES district)
- District
- Fairfax County Public School District
- NCES district ID
- 5101260
- Math proficiency
- 61% ▼ -24.00%
- Reading proficiency
- 73% ▼ -8.00%
- Median HH income
- $110,238
- Composite
- 62.59/100
- National rank
- #679
- State rank
- #13 of 131 in VA
Livability — Springfield
- Score
- 90/100
- State rank
- #2
- US rank
- #77
Category grades
Schools grade is shown separately in the Schools card above.
Census & demographics
- Census place
- Springfield, VA
- County
- Fairfax County · 1,104,456 people
- City population
- 106,450
- Metro
- Washington-Arlington-Alexandria, DC-VA-MD-WV
- Population (ZIP)
- 27,955
- Household income
- $123,114
- Rent vs Own
- Severe rent burden
- 1326.0
Population outlook (Fairfax County) Hauer SSP2
- Today (2025)
- 1,237,259 people
- By 2030
- 1,277,758 · +3.3%
- By 2040
- 1,346,508 · +8.8%
- By 2050
- 1,397,919 · +13.0%
- By 2075
- 1,493,100 · +20.7%
- By 2100
- 1,465,712 · +18.5%
Race, ethnicity, and origin ACS 2023
- Neighborhood character
- Highly diverse neighborhood (Simpson 0.74)
- Race & ethnicity
- White 32% Asian 30% Hispanic / Latino 22% Black 12% Two or more races 11%
- Hispanic origin (detail)
- Mexican 1%
- Common ancestry
- Romanian 2% Italian 1% Slovak 1%
- Foreign-born
- 41% · Canada, Vietnam, China
- Languages at home
- 46% English-only · Spanish 20% Other Indo-European 12% Vietnamese 7%
Political lean MEDSL · Fairfax
- 2024 margin
- Solid D (+35.0) · D 66.1% · R 31.1% · Other 2.8%
- 2008→2024 swing
- +13.8pp toward D · 2008: 21.2pp · 2024: 35.0pp
- All cycles
- 2024: D+35.0 2020: D+41.9 2016: D+36.2 2012: D+19.8 2008: D+21.2
Not yet ingested
- Civics
- —
Market trends
- HPI YoY
- ▼ -427.72%
- Current HPI
- 316.9985
- Rent YoY
- ▲ 11.14%
- Metro
- Washington-Arlington-Alexandria, DC-VA-MD-WV
- State GDP YoY
- ▲ 2.40%
- F500 in state
- 50
Industry mix (Fortune 500 HQ in VA)
| Industry | F500 HQs | Revenue |
|---|---|---|
| Aerospace / Defense | 4 | $236B |
|
||
| Technology / Defense | 3 | $32B |
|
||
| Financial Services | 2 | $176B |
|
||
| Utilities | 2 | $27B |
|
||
| Insurance | 2 | $25B |
|
||
| Technology | 2 | $15B |
|
||
Price history
+270.1% since first listed11 events — show timeline
- 2026-05-26 Listed $235,000 FSBO.com
- 2025-10-21 Rental Removed $1,700 TURBOTENANT
- 2025-10-13 Listed for Rent $1,700 TURBOTENANT
- 2025-09-08 Rental Removed $1,700 TURBOTENANT
- 2025-09-06 Listed for Rent $1,700 TURBOTENANT
- 2022-01-05 Price Changed $1,650 TURBOTENANT
- 2018-05-02 Sold (Public Records) $177,000 Public Records
- 2018-05-01 Sold (MLS) $177,000 MRIS
- 2018-03-19 Pending — MRIS
- 2018-02-09 Listed $225,000 MRIS
- 1985-12-02 Sold (Public Records) $63,500 Public Records
Property tax history
+3.0%/yrLatest (2025): $3,345 · -0.2% YoY. Source: county tax records.
Cash-flow waterfall
monthlySold comps — $/sqft
last 12 mo · ≤1 miLoading sold comps…