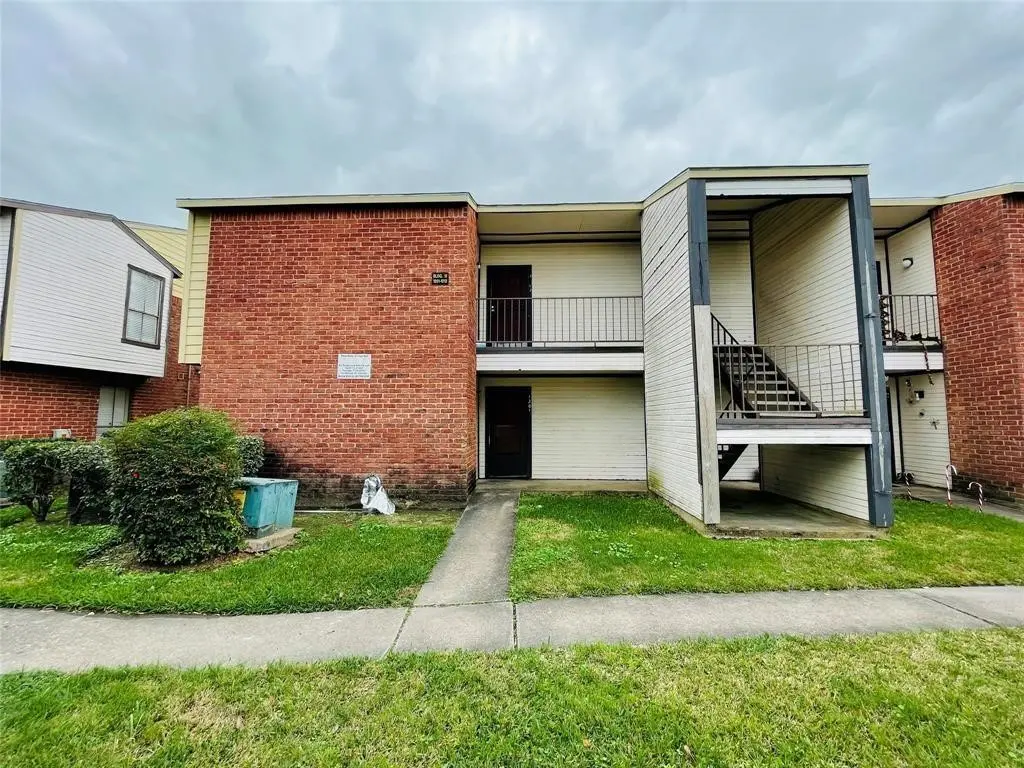
13480 S Thorntree Dr #1004 · Houston, TX
Flood risk 6/10 · Moderate
- FEMA flood zone
- X (unshaded)
- Chance of flooding over 30 yrs
- 0.72%
- Est. flood insurance / yr
- $507 – $1,088
Fire risk 1/10 · Minimal
- Est. fire insurance / yr
- $1,222 – $2,270
Heat risk 9/10 · Severe
- Hot days now (above 109°F)
- 7 days/yr
- Hot days in 30 yrs
- 25 days/yr
Wind risk 9/10 · Severe
- Chance of severe wind over 30 yrs
- 99.0%
Air-quality risk 2/10 · Minimal
- Unhealthy air days now
- 2 days/yr
- Unhealthy air days in 30 yrs
- 2 days/yr
Risk factors via First Street. Map © Google.
Why this score? — see what drove the B+ grade
The composite is a weighted blend of 9 inputs, each scored 0–100. Each bar is that input's sub-score; the figure is the points it added to the 100-point composite (weight × sub-score).
- Cash flow +30.0/30.0
- ARV discount +15.0/15.0
- 1% rule +10.0/10.0
- DSCR +10.0/10.0
- Livability +3.7/5.0
- Schools +2.8/10.0
- Condition / age +2.5/5.0
- Rent growth +2.3/5.0
- Appreciation +0.0/10.0
$54,000
🖨 Deal sheet 📄 Offer letter ✓ Due diligence
Listing remarks MLS
This is also a good investment opportunity for those investors who would like to include another unit in their portfolio. This property is being sold with three other investment properties. Kindly refer to these MLS numbers: 13480 S Thorntree Drive #910 - 79853163 13480 S Thorntree Drive #508 - 15241348 13480 S Thorntree Drive #1206 - 88053105 This location is very strategic for students and those who work within or near the Medical Center.
Key facts
- $208 HOA
- Parking
- Built 1982
Neighborhood map
What this means for you Summary
Snapshot
- This is a 2-bed/1.0-bath condo listed at $54k.
Deal economics
- At list price, monthly cash flow is $235 ($3k/yr) — positive.
- The deal already cash-flows at list — no discount required.
- Meets the 1% rule at list price ($1k rent vs $54k).
- Recommended offer: $48k (12.0% below list) — sets the bar for market timing.
- Cap rate 11.5% vs local median 3.2% in Houston — top-decile yield for the area; either an underpriced asset or a hidden risk that comps aren't pricing in. Stress-test before assuming the spread holds.
Location & tenants
- Location reads 74/100 on livability (#184 in TX, #4,771 nationally) — a middle-class / working-renter tenant base. Strengths: amenities A+, cost of living A+, housing A+; Watch: schools D, crime F.
- Galena Park ISD (suburban): math 32% / reading 33% proficiency, ranked #578 of 826 in TX (top 70%) — families likely to look elsewhere, expect single-tenant / working-renter base with shorter leases; 74% free/reduced lunch — lower-income household profile, screen leases tightly.
- Market conditions: Rents soft (-0.8%/yr); 162 active listings in the ZIP; 40 comparable units currently listed for rent nearby; rentals leasing fast (median 13d on market — plan ~1-2 weeks tenant-placement turnaround); 29,883 units permitted in Harris County in 2024 (8,621 in 5+ unit buildings).
Forward outlook
- Local home prices are declining (-3.0%/yr); year-one equity from $373 of loan paydown is wiped out by about $2k of value loss. Plan a longer hold.
- Harris County population projected at +47% by 2050 — long-run rental-demand tailwind backs the buy-and-hold thesis.
Negotiation context
- It's been on market 303 days — a 12% lower offer ($48k) is reasonable based on typical stale-listing flexibility.
- 4 sale attempts since 24y ago; this cycle's ask has dropped $15k (22%) from the opening price — seller is motivated, your offer sets the floor, not the list.
Risks & watch-outs
- Climate carrying-cost: major flood risk; severe wind risk, 99% chance of damaging wind over 30y; extreme-heat days projected 7→25/yr by 2055 (HVAC capex compounding) — expect insurance premiums to compound above CPI over the hold.
Questions for the listing agent
- It's been on market 303 days. Have you received any prior offers? Is the seller open to a 12% concession, seller financing, or rate buy-down credit?
- What does the HOA fee cover, when was the last increase, and are there any pending special assessments or reserve-fund shortfalls?
- Any open or pending special assessments — roof, HVAC, plumbing, elevator, façade? What's the per-unit balance and payoff schedule, and is the seller paying it off at close or rolling it to the buyer?
- Why hasn't it sold? Are there any deal-killer items the seller is aware of (foundation, flood, title, zoning, code violations)?
- Is there a deadline driving the sale (1031 exchange, divorce, estate, relocation)? That informs how much negotiation room exists.
- Schools are D-rated, which usually means shorter tenancies and higher turnover. Who's the typical renter profile here, and what's been the actual vacancy rate?
- Crime grade is F in this area — have there been break-ins, vandalism, or insurance claims at this property in the last 3 years? What carrier currently insures it and at what premium?
- What's the average days-on-market for RENTAL listings here right now (not sales)? A rising rental-DOM trend means longer vacancies and softer asking-rent achievability than the comps imply.
- What's the recent tenant-quality profile in this submarket — average credit score on applications, eviction rate, late-payment / NSF rate, and stable-employment percentage? A property-management company in the area should have these aggregated.
- How much new apartment / multifamily construction is in the pipeline within 1–3 miles? Heavy new supply (>2% of stock underway) typically softens rents 12–24 months out; light construction supports rent growth.
Investment metrics
- 1% rule
- 1.98% ✓
- Cap rate
- 11.51%
- Cash-on-cash
- 18.65%
- DSCR
- 1.83
- GRM
- 4.2
CMA / ARV
- ARV (median comp)
- $66,364
- List price
- $54,000
- Delta
- -18.63%
- Verdict
- UNDERPRICED
- Comps
- 20 within 1.0 mi
Projected returns pro-forma
-3.0% appreciation · 0.0% rent growth · sell at horizon
- IRR
- 5.8%
- Equity multiple
- 1.21×
- Total profit
- $3,240
- Equity at exit
- $8,052
- IRR
- 11.1%
- Equity multiple
- 1.70×
- Total profit
- $10,631
- Equity at exit
- $4,669
Cash invested: $15,120 (down + closing). Projections, not guarantees.
Landlord ↔ Tenant lean methodology
- Overall (STATE)
- 87 Strongly Landlord-Friendly
- State Texas
- 87 Strongly Landlord-Friendly · R+5
- County
- — inherits STATE
- City
- — inherits STATE
ZIP-level market 77015
- Home prices YoY
- -10.8%
- Rents YoY
- -0.8%
- Active inventory
- 162
- Price-to-rent
- 4.2×
Monthly cashflow live
- Estimated rent
- $1,070 high interval (Pro) →
- Mortgage (P&I)
- −$283
- Tax from tax record
- −$97 /mo · $1,158/yr
- Insurance
- −$22
- HOA
- −$208
- Vacancy / Maint / Mgmt
- −$225
- Net cashflow
- $235
Break-even live
UW: 25.0% down · 7.5% · 30yr · 1.5% tax · 5.0% vac · 8.0% maint · 8.0% mgmt
Financing live
Cash to close
- Down payment
- $13,500
- Closing costs
- $1,620
- Reserves months
- —
- Total cash needed
- —
Loan-product check · same deal, 3 products live
Conventional
25% down · 7.5% · 30yr
- Down + closing
- —
- Monthly P&I
- —
- Monthly cashflow
- —
- DSCR
- —
- Eligible?
- —
Personal DTI + credit; lowest rate.
DSCR
20% down · 8.5% · 30yr
- Down + closing
- —
- Monthly P&I
- —
- Monthly cashflow
- —
- DSCR
- —
- Eligible?
- —
No personal income docs; deal must DSCR.
Hard money
10% down · 12.0% · 12mo
- Down + closing
- —
- Monthly P&I
- —
- Monthly cashflow
- —
- DSCR
- —
- Eligible?
- —
Short-term bridge; refi at stabilization.
Rent comps 40 comps
| Address | Beds | Baths | Sqft | Rent | $/sqft | DOM | Units | Dist |
|---|---|---|---|---|---|---|---|---|
| 90 Uvalde Rd Houston, TX | 1.0–2.0 | 1.0–2.0 | 868 | $1,347 | $1.55 | 1d | 20 | 0.17mi |
| 206 Spinwood Dr Houston, TX | 2.0 | 2.0 | 860 | $1,040 | $1.21 | 43d | 1 | 0.22mi |
| 13502 N Thorntree Dr Unit 1047 Houston, TX | 1.0 | 1.0 | 583 | $824 | $1.41 | 10d | 1 | 0.22mi |
| 13502 N Thorntree Dr Houston, TX | 1.0 | 1.0 | 583 | $773 | $1.33 | 12d | 1 | 0.23mi |
| 250 Uvalde Rd Houston, TX | 1.0–3.0 | 1.0–2.0 | 909 | $1,039 | $1.14 | 2d | 26 | 0.23mi |
| 13502 N Thorntree Dr Unit 424 Houston, TX | 2.0 | 2.0 | 766 | $939 | $1.23 | 5d | 1 | 0.25mi |
| 13502 N Thorntree Dr Unit 13523 Houston, TX | 1.0 | 1.0 | 583 | $781 | $1.34 | 2d | 1 | 0.25mi |
| 13502 N Thorntree Dr Unit 425 Houston, TX | 2.0 | 2.0 | 766 | $963 | $1.26 | 10d | 1 | 0.25mi |
| 13502 N Thorntree Dr Unit 13523 Houston, TX | 1.0 | 1.0 | 635 | $869 | $1.37 | 12d | 1 | 0.25mi |
| 13502 N Thorntree Dr Unit 13553 Houston, TX | 1.0 | 1.0 | 635 | $864 | $1.36 | 43d | 1 | 0.25mi |
| 316 White Cedar St Houston, TX | 1.0 | 1.0 | 712 | $1,035 | $1.45 | 21d | 1 | 0.26mi |
| 316 White Cedar St Houston, TX | 2.0 | 2.0 | 1028 | $1,306 | $1.27 | 24d | 1 | 0.26mi |
| 316 White Cedar St Houston, TX | 1.0 | 1.0 | 712 | $1,035 | $1.45 | 19d | 1 | 0.26mi |
| 8 Uvalde Rd Houston, TX | 3.0 | 2.0 | 1125 | $1,000 | $0.89 | 43d | 1 | 0.39mi |
| 353 Audrey Ln Unit 365 1/2 Houston, TX | 2.0 | 1.0 | 800 | $1,375 | $1.72 | 43d | 1 | 0.51mi |
| 13161 Woodforest Blvd Houston, TX | 2.0 | 2.0 | 965 | $1,058 | $1.10 | 43d | 1 | 0.56mi |
| 14445 Wallisville Rd Houston, TX | 2.0 | 1.0–2.0 | 659 | $1,210 | $1.83 | 1d | 10 | 0.62mi |
| 14346 Wallisville Rd Houston, TX | 2.0 | 2.0 | 936 | $1,360 | $1.45 | 43d | 1 | 0.68mi |
| 14340 Wallisville Rd Unit 2047 Houston, TX | 2.0 | 2.0 | 940 | $1,425 | $1.52 | 10d | 1 | 0.69mi |
| 14340 Wallisville Rd Unit 1162 Houston, TX | 1.0 | 1.0 | 670 | $1,080 | $1.61 | 5d | 1 | 0.69mi |
| 14340 Wallisville Rd Houston, TX | 1.0 | 1.0 | 670 | $1,069 | $1.60 | 12d | 1 | 0.69mi |
| 14340 Wallisville Rd Unit 2162 Houston, TX | 2.0 | 2.0 | 940 | $1,390 | $1.48 | 5d | 1 | 0.69mi |
| 14340 Wallisville Rd Unit 325 Houston, TX | 1.0 | 1.0 | 670 | $1,077 | $1.61 | 2d | 1 | 0.69mi |
| 14340 Wallisville Rd Unit 2148 Houston, TX | 2.0 | 2.0 | 940 | $1,382 | $1.47 | 2d | 1 | 0.69mi |
| 14340 Wallisville Rd Unit 14361 Houston, TX | 1.0 | 1.0 | 670 | $1,077 | $1.61 | 2d | 1 | 0.70mi |
| 14340 Wallisville Rd Unit 14377 Houston, TX | 2.0 | 2.0 | 940 | $1,414 | $1.50 | 10d | 1 | 0.70mi |
| 14340 Wallisville Rd Unit 14397 Houston, TX | 2.0 | 2.0 | 936 | $1,410 | $1.51 | 43d | 1 | 0.70mi |
| 14340 Wallisville Rd Unit 14391 Houston, TX | 1.0 | 1.0 | 669 | $1,090 | $1.63 | 43d | 1 | 0.70mi |
| 14340 Wallisville Rd Unit 14361 Houston, TX | 1.0 | 1.0 | 669 | $1,095 | $1.64 | 12d | 1 | 0.70mi |
| 14340 Wallisville Rd Unit 425 Houston, TX | 2.0 | 2.0 | 940 | $1,382 | $1.47 | 2d | 1 | 0.70mi |
| 5675 Purple Sage Rd Houston, TX | 1.0–2.0 | 1.0–2.0 | 782 | $1,129 | $1.44 | 3d | 18 | 0.74mi |
| 12955 Woodforest Blvd Unit 305 Houston, TX | 1.0 | 1.0 | 728 | $975 | $1.34 | 24d | 1 | 0.76mi |
| 15110 N Castlegory Houston, TX | 2.0 | 2.0 | 1079 | $1,670 | $1.55 | 11d | 1 | 0.84mi |
| 12905 Woodforest Blvd Houston, TX | 2.0 | 1.0 | 886 | $1,098 | $1.24 | 20d | 2 | 0.84mi |
| 5921 Uvalde Rd Houston, TX | 1.0 | 1.0 | 644 | $963 | $1.50 | 43d | 1 | 0.88mi |
| 5921 Uvalde Rd Houston, TX | 2.0 | 1.0 | 800 | $1,141 | $1.43 | 24d | 1 | 0.88mi |
| 5921 Uvalde Rd Houston, TX | 1.0 | 1.0 | 644 | $963 | $1.50 | 20d | 1 | 0.88mi |
| 13925 Alderson St Houston, TX | 2.0 | 1.0 | 700 | $1,273 | $1.82 | 3d | 1 | 0.91mi |
| 13925 Alderson St Houston, TX | 1.0 | 1.0 | 620 | $845 | $1.36 | 3d | 1 | 0.91mi |
| 13925 Alderson St Houston, TX | 1.0 | 1.0 | 620 | $844 | $1.36 | 2d | 1 | 0.91mi |
HOA detail condo
- Monthly dues
- $208 · $2,496/yr
- Assessments
- None detected in remarks — confirm with the listing agent.
Listing history 28 events
-
2026-06-18days on market $54,000 Active 303 DOM
-
2026-06-17days on market $54,000 Active 302 DOM
-
2026-06-16days on market $54,000 Active 301 DOM
-
2026-06-15days on market $54,000 Active 300 DOM
-
2026-06-13days on market $54,000 Active 298 DOM
-
2026-06-13days on market $54,000 Active 297 DOM
-
2026-06-09days on market $54,000 Active 294 DOM
-
2026-06-08days on market $54,000 Active 293 DOM
-
2026-06-07days on market $54,000 Active 292 DOM
-
2026-06-04days on market $54,000 Active 289 DOM
-
2026-06-03days on market $54,000 Active 288 DOM
-
2026-06-02days on market $54,000 Active 287 DOM
-
2026-06-01days on market $54,000 Active 286 DOM
-
2026-05-31days on market $54,000 Active 285 DOM
-
2026-03-03price $54,000 454-char remark
Show marketing remark (454 chars)
This is also a good investment opportunity for those investors who would like to include another unit in their portfolio. This property is being sold with three other investment properties. Kindly refer to these MLS numbers: 13480 S Thorntree Drive #910 - 79853163 13480 S Thorntree Drive #508 - 15241348 13480 S Thorntree Drive #1206 - 88053105 This location is very strategic for students and those who work within or near the Medical Center.
-
2025-09-15price $57,000 454-char remark
Show marketing remark (454 chars)
This is also a good investment opportunity for those investors who would like to include another unit in their portfolio. This property is being sold with three other investment properties. Kindly refer to these MLS numbers: 13480 S Thorntree Drive #910 - 79853163 13480 S Thorntree Drive #508 - 15241348 13480 S Thorntree Drive #1206 - 88053105 This location is very strategic for students and those who work within or near the Medical Center.
-
2025-08-19$68,990 Active 454-char remark
Show marketing remark (454 chars)
This is also a good investment opportunity for those investors who would like to include another unit in their portfolio. This property is being sold with three other investment properties. Kindly refer to these MLS numbers: 13480 S Thorntree Drive #910 - 79853163 13480 S Thorntree Drive #508 - 15241348 13480 S Thorntree Drive #1206 - 88053105 This location is very strategic for students and those who work within or near the Medical Center.
-
2022-06-14soldstatus
-
2022-04-07soldstatus
-
2022-04-05soldstatus Sold 162-char remark
Show marketing remark (162 chars)
No more showings! Thanks! GREAT INVESTMENT OPPORTUNITY!! NEVER FLOODED, CASH OFFER ONLY, LOCKBOX IN FD, CALL LISTING AGENT FOR MORE INFOR, package sales available
-
2022-02-28status Pending 162-char remark
Show marketing remark (162 chars)
No more showings! Thanks! GREAT INVESTMENT OPPORTUNITY!! NEVER FLOODED, CASH OFFER ONLY, LOCKBOX IN FD, CALL LISTING AGENT FOR MORE INFOR, package sales available
-
2022-02-28$47,000 Active 162-char remark
Show marketing remark (162 chars)
No more showings! Thanks! GREAT INVESTMENT OPPORTUNITY!! NEVER FLOODED, CASH OFFER ONLY, LOCKBOX IN FD, CALL LISTING AGENT FOR MORE INFOR, package sales available
-
2011-11-04soldstatus
-
2003-12-10historical
-
2003-09-10$28,000
-
2003-04-25historical
-
2002-10-23$28,000
-
2001-04-18soldstatus
ⓘ Source: listings_history table (triggers on properties + properties_extension) + one-shot
backfill from property_details.listing_events for pre-trigger history.
Tax reassessment forecast TX · Resets to sale price
- Current annual tax
- $1,158 · $97/mo
- Projected year-2 tax
- $1,158 · $97/mo
- Expected delta
- $0/yr ($0/mo · 0.0%)
ⓘ Screening estimate from a state-policy table — verify with the county assessor before closing.
Climate risk First Street
- Flood 6/10 Major FEMA zone X (unshaded) · 72% chance over 30 yrs
- Wildfire 1/10 Low
- Heat 9/10 Extreme 7 d/yr ≥109°F today · 25 d/yr by 30 yrs out
- Wind 9/10 Extreme 99% chance of damaging wind over 30 yrs
- Air quality 2/10 Low 2 unhealthy d/yr today · 2 by 30 yrs out
Nearby sold comps map
Loading sold comps map…
Walkable amenities ~0.75 mi
Loading nearby amenities…
Taxation est. · year 1
- Rental income
- $12,838
- − Mortgage interest
- −$3,025
- − Property taxes
- −$1,158
- − Insurance
- −$270
- − Repairs & maintenance
- −$1,027
- − Management
- −$1,027
- − HOA
- −$2,496
- − Depreciation
- −$1,571
- Taxable income
- $2,264
- Est. tax owed @ 24.0%
- −$543
- After-tax cash flow
- $2,276/yr
For passive investors: Depreciation is non-cash, so a rental often shows a tax loss while cash-flowing — sheltering income. Rental losses are passive: they offset passive income freely, and up to $25,000/yr can offset ordinary (W-2) income if you actively participate and your MAGI is under $100k (phasing out to $0 by $150k); unused losses carry forward. On sale, claimed depreciation is recaptured at up to 25%, and gains may owe capital-gains tax (a 1031 exchange can defer both). Figures are a year-1 estimate at your 24.0% rate — not tax advice; consult a CPA.
Schools (NCES district)
- District
- Galena Park ISD
- NCES district ID
- 4820250
- Math proficiency
- 32% ▼ -20.00%
- Reading proficiency
- 33% ▼ -7.00%
- Median HH income
- $43,158
- Composite
- 27.62/100
- National rank
- #6927
- State rank
- #578 of 826 in TX
Livability — Houston
- Score
- 74/100
- State rank
- #184
- US rank
- #4771
Category grades
Schools grade is shown separately in the Schools card above.
Census & demographics
- County
- Harris County · 4,702,590 people
- City population
- 3,226,434
- Metro
- Houston-The Woodlands-Sugar Land, TX
- Population (ZIP)
- 58,415
- Household income
- $57,753
- Rent vs Own
- Severe rent burden
- 1816.0
Population outlook (Harris County) Hauer SSP2
- Today (2025)
- 5,571,493 people
- By 2030
- 6,089,821 · +9.3%
- By 2040
- 7,142,806 · +28.2%
- By 2050
- 8,185,864 · +46.9%
- By 2075
- 10,574,329 · +89.8%
- By 2100
- 12,109,958 · +117.4%
Race, ethnicity, and origin ACS 2023
- Neighborhood character
- Predominantly Hispanic (77%)
- Race & ethnicity
- Hispanic / Latino 77% Two or more races 54% Black 14% White 6% Asian 1% Native American 1%
- Hispanic origin (detail)
- Mexican 60% Cuban 2%
- Foreign-born
- 33% · Canada, Vietnam
- Languages at home
- 31% English-only · Spanish 68% Vietnamese 1%
Political lean MEDSL · Harris
- 2024 margin
- Lean D (+5.5) · D 52.0% · R 46.4% · Other 1.6%
- 2008→2024 swing
- +3.9pp toward D · 2008: 1.6pp · 2024: 5.5pp
- All cycles
- 2024: D+5.5 2020: D+13.3 2016: D+12.4 2012: D+0.1 2008: D+1.6
Not yet ingested
- Civics
- —
Market trends
- HPI YoY
- ▼ -36.47%
- Current HPI
- 300.1821
- Rent YoY
- ▼ -0.83%
- Metro
- Houston-The Woodlands-Sugar Land, TX
- State GDP YoY
- ▲ 3.95%
- F500 in state
- 110
Industry mix (Fortune 500 HQ in TX)
| Industry | F500 HQs | Revenue |
|---|---|---|
| Energy | 16 | $1,198B |
|
||
| Technology | 5 | $198B |
|
||
| Engineering / Construction | 4 | $72B |
|
||
| Energy Services | 3 | $60B |
|
||
| Utilities | 3 | $41B |
|
||
| Healthcare | 2 | $330B |
|
||
Price history
+92.9% since first listed14 events — show timeline
- 2026-03-03 Price Changed $54,000 HARMLS
- 2025-09-15 Price Changed $57,000 HARMLS
- 2025-08-19 Listed $68,990 HARMLS
- 2022-06-14 Sold (Public Records) — Public Records
- 2022-04-07 Sold (Public Records) — Public Records
- 2022-04-05 Sold (MLS) — HARMLS
- 2022-02-28 Pending — HARMLS
- 2022-02-28 Listed $47,000 HARMLS
- 2011-11-04 Sold (Public Records) — Public Records
- 2003-12-10 Listing Removed — HARMLS
- 2003-09-10 Listed $28,000 HARMLS
- 2003-04-25 Listing Removed — HARMLS
- 2002-10-23 Listed $28,000 HARMLS
- 2001-04-18 Sold (Public Records) — Public Records
Property tax history
+10.7%/yrLatest (2025): $1,158 · +24.9% YoY. Source: county tax records.
Cash-flow waterfall
monthlySold comps — $/sqft
last 12 mo · ≤1 miLoading sold comps…