4637 Fleming St · Zachary, LA
Flood risk 1/10 · Minimal
- FEMA flood zone
- X (unshaded)
- Chance of flooding over 30 yrs
- 0.0%
- Est. flood insurance / yr
- $507 – $1,088
Fire risk 1/10 · Minimal
- Est. fire insurance / yr
- $1,269 – $2,357
Heat risk 8/10 · Major
- Hot days now (above 108°F)
- 7 days/yr
- Hot days in 30 yrs
- 20 days/yr
Wind risk 9/10 · Severe
- Chance of severe wind over 30 yrs
- 99.0%
Air-quality risk 2/10 · Minimal
- Unhealthy air days now
- 1 days/yr
- Unhealthy air days in 30 yrs
- 2 days/yr
Risk factors via First Street. Map © Google.
Why this score? — see what drove the C grade
The composite is a weighted blend of 9 inputs, each scored 0–100. Each bar is that input's sub-score; the figure is the points it added to the 100-point composite (weight × sub-score).
- Cash flow +22.5/30.0
- ARV discount +8.9/15.0
- DSCR +7.2/10.0
- 1% rule +5.3/10.0
- Schools +4.7/10.0
- Rent growth +3.5/5.0
- Livability +3.5/5.0
- Condition / age +2.5/5.0
- Appreciation +0.0/10.0
$158,000
🖨 Deal sheet 📄 Offer letter ✓ Due diligence
Listing remarks MLS
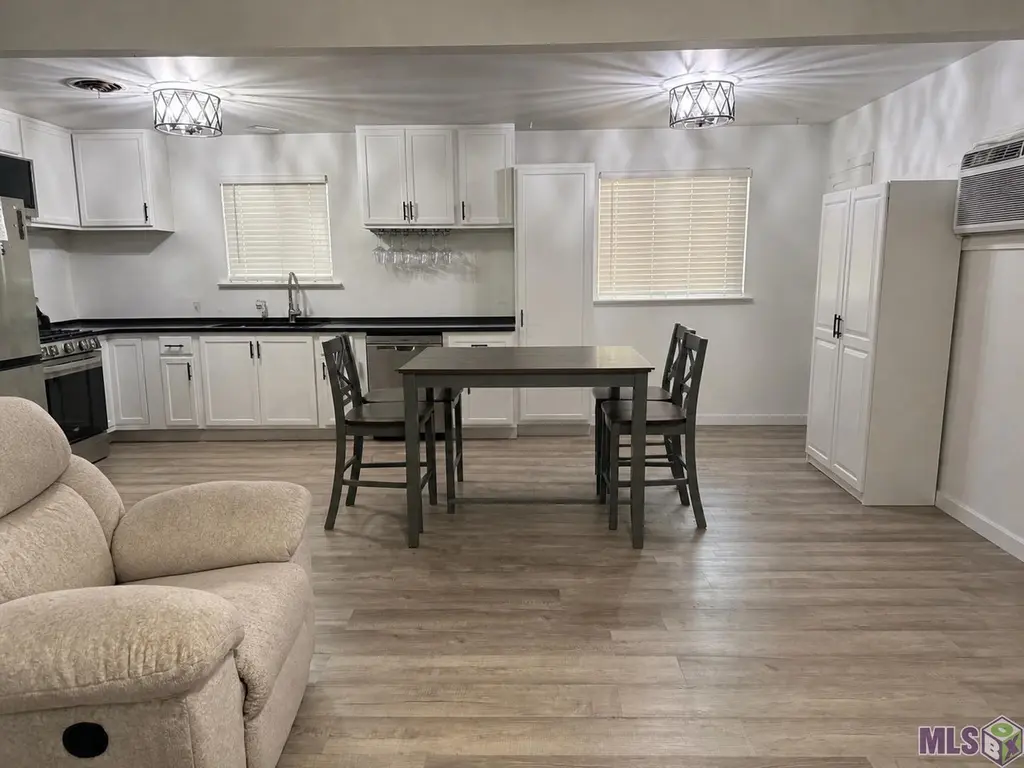
UPDATED 3 BEDROOM 1 BATH HOME ON LARGE FENCED IN LOT. FLOOD ZONE X, NO FLOOD INSURANCE REQUIRED. NO CARPET, NEW FLOORING, FRESH PAINT! 20' X 16' SHOP WITH ELECTRICAL INSTALLED, READY FOR CONNECTION TO MAIN PANEL. CHICKEN COOP TO REMAIN. 19' X 10' COVERED PATIO IN REAR OF HOME. ROOF 4 YEARS OLD. PERFECT STARTER HOME WITH PLENTY OF ROOM FOR PETS AND CHILDREN. GREAT SCHOOLS.
Key facts
- Fresh paint
- New flooring
- Large fenced in lot
Tags
Property features AI
Finance
- Other: Located in Woodview Subdivision
Exterior
- Parking: Covered garage
- Utilities: Public water
- Home design: Detached single-family home; Single-story
- Construction: Built with wood siding and brick; Slab foundation
- Exterior features: Lot approximately 0.3 acres with dimensions 69 x 153 x 69 x 152; Wood siding and brick exterior
Interior
- Bathrooms: 1 full bathroom
- Interior features: Central and electric heating; Central air conditioning plus wall unit(s)
Neighborhood map
What this means for you Summary
Snapshot
- This is a 3-bed/1.0-bath single-family listed at $158k.
Deal economics
- At list price, monthly cash flow is $266 ($3k/yr) — positive.
- The deal already cash-flows at list — no discount required.
- Meets the 1% rule at list price ($2k rent vs $158k).
- Cap rate 8.3% vs local median 4.5% in Zachary — top-decile yield for the area; either an underpriced asset or a hidden risk that comps aren't pricing in. Stress-test before assuming the spread holds.
Location & tenants
- Location reads 69/100 on livability (#64 in LA) — a middle-class / working-renter tenant base. Strengths: schools A+, employment A+, housing A+; Watch: crime C-, amenities F, commute F.
- Zachary Community School District (suburban): math 46% / reading 60% proficiency, ranked #8 of 98 in LA (top 8%) — acceptable for families but not a draw, mixed tenant base, ~2y average lease.
- Market conditions: Rents rising fast (+4.2%/yr); 584 active listings in the ZIP; 4 comparable units currently listed for rent nearby; rentals at typical pace (median 19d on market — plan ~3-4 weeks tenant-placement turnaround); solid renter incomes; 2,252 units permitted in East Baton Rouge Parish in 2024 (440 in 5+ unit buildings).
Forward outlook
- Local home prices are declining (-3.0%/yr); year-one equity from $1k of loan paydown is wiped out by about $5k of value loss. Plan a longer hold.
- East Baton Rouge County population projected at +4% by 2050 — modest demand growth; plan on rents tracking national, not racing it.
Negotiation context
- Only 13 days on market — expect competitive offers; lowballing is unlikely to land.
- 2 sale attempts with the ask held roughly flat each time — persistent listings suggest the price (not the market) is what's stuck; bring a comps-based counter.
Risks & watch-outs
- Climate carrying-cost: severe wind risk, 99% chance of damaging wind over 30y; extreme-heat days projected 7→20/yr by 2055 (HVAC capex compounding) — expect insurance premiums to compound above CPI over the hold.
Questions for the listing agent
- Built in 1979 — when were the roof, HVAC, electrical panel, plumbing, and water heater last replaced?
- Is there a deadline driving the sale (1031 exchange, divorce, estate, relocation)? That informs how much negotiation room exists.
- Schools are A-rated — typically a magnet for longer-tenancy family renters. What's the average tenant stay here, and is there a school-zone premium baked into asking?
- What's the average days-on-market for RENTAL listings here right now (not sales)? A rising rental-DOM trend means longer vacancies and softer asking-rent achievability than the comps imply.
- What's the recent tenant-quality profile in this submarket — average credit score on applications, eviction rate, late-payment / NSF rate, and stable-employment percentage? A property-management company in the area should have these aggregated.
- How much new for-sale + rental construction is in the pipeline within 1–3 miles? Heavy new supply typically softens prices + rents 12–24 months out; constrained supply supports both.
Investment metrics
- 1% rule
- 1.03% ✓
- Cap rate
- 8.32%
- Cash-on-cash
- 7.22%
- DSCR
- 1.32
- GRM
- 8.1
CMA / ARV
- ARV (on-the-fly)
- $163,020
- Comps found
- 10
Show comp detail 10 sales within ~0.75 mi
| Address | Dist | Beds/Ba | Sqft | Sold | Price | $/sf | Match |
|---|---|---|---|---|---|---|---|
| 4843 Kennedy Dr | 0.10mi | 3/2.0 | 1,116 (-2%) | 18mo | $190,000 | $170 | 73 |
| 4543 41st St | 0.48mi | 3/1.0 | 1,182 (+4%) | 14mo | $180,000 | $152 | 60 |
| 4866 June St | 0.22mi | 3/1.5 | 1,253 (+10%) | 19mo | $190,000 | $152 | 56 |
| 4301 Marshall St | 0.49mi | 3/1.0 | 1,113 (-2%) | 22mo | $79,000 | $71 | 55 |
| 4279 Robert St | 0.59mi | 3/1.5 | 1,105 (-3%) | 15mo | $165,000 | $149 | 53 |
| 4226 Nelson St | 0.57mi | 2/1.0 (-1) | 1,147 (+1%) | 21mo | $114,900 | $100 | 50 |
| 3978 Nelson St | 0.67mi | 3/1.0 | 1,054 (-8%) | 8mo | $150,000 | $142 | 50 |
| 4031 Florida St | 0.65mi | 3/1.0 | 1,034 (-9%) | 12mo | $120,000 | $116 | 44 |
| 4105 Bennett St | 0.54mi | 2/1.0 (-1) | 1,293 (+13%) | 14mo | $173,000 | $134 | 35 |
| 4035 Nelson St | 0.62mi | 2/1.0 (-1) | 1,295 (+14%) | 14mo | $185,000 | $143 | 32 |
Match score weights: distance 35% · size 25% · config 20% · recency 20%. Top-matched comps best support the ARV.
Projected returns pro-forma
-3.0% appreciation · 4.18% rent growth · sell at horizon
- IRR
- -4.0%
- Equity multiple
- 0.85×
- Total profit
- $-6,714
- Equity at exit
- $23,558
- IRR
- 6.9%
- Equity multiple
- 1.54×
- Total profit
- $24,107
- Equity at exit
- $13,661
Cash invested: $44,240 (down + closing). Projections, not guarantees.
Landlord ↔ Tenant lean methodology
- Overall (STATE)
- 90 Strongly Landlord-Friendly
- State Louisiana
- 90 Strongly Landlord-Friendly · R+12
- County
- — inherits STATE
- City
- — inherits STATE
ZIP-level market 70791
- Home prices YoY
- -21.6%
- Rents YoY
- 4.2%
- Active inventory
- 584
- Price-to-rent
- 8.1×
Monthly cashflow live
- Estimated rent
- $1,625 medium interval (Pro) →
- Mortgage (P&I)
- −$829
- Tax from tax record
- −$123 /mo · $1,475/yr
- Insurance
- −$66
- HOA
- −$0
- Vacancy / Maint / Mgmt
- −$341
- Net cashflow
- $266
Break-even live
UW: 25.0% down · 7.5% · 30yr · 1.5% tax · 5.0% vac · 8.0% maint · 8.0% mgmt
Financing live
Cash to close
- Down payment
- $39,500
- Closing costs
- $4,740
- Reserves months
- —
- Total cash needed
- —
Loan-product check · same deal, 3 products live
Conventional
25% down · 7.5% · 30yr
- Down + closing
- —
- Monthly P&I
- —
- Monthly cashflow
- —
- DSCR
- —
- Eligible?
- —
Personal DTI + credit; lowest rate.
DSCR
20% down · 8.5% · 30yr
- Down + closing
- —
- Monthly P&I
- —
- Monthly cashflow
- —
- DSCR
- —
- Eligible?
- —
No personal income docs; deal must DSCR.
Hard money
10% down · 12.0% · 12mo
- Down + closing
- —
- Monthly P&I
- —
- Monthly cashflow
- —
- DSCR
- —
- Eligible?
- —
Short-term bridge; refi at stabilization.
Rent comps 4 comps
| Address | Beds | Baths | Sqft | Rent | $/sqft | DOM | Units | Dist |
|---|---|---|---|---|---|---|---|---|
| 4133 Lee St #17 Zachary, LA | 2.0 | 1.0 | 800 | $975 | $1.22 | 14d | 1 | 0.59mi |
| 4133 Lee St #17 Zachary, LA | 2.0 | 1.0 | 800 | $975 | $1.22 | 19d | 1 | 0.59mi |
| 5633 Emmie Dr Zachary, LA | 3.0 | 3.0 | 1441 | $2,150 | $1.49 | 19d | 1 | 0.59mi |
| 4150 McHugh Rd Zachary, LA | 1.0–3.0 | 1.0–2.0 | 993 | $1,690 | $1.70 | 14d | 8 | 1.08mi |
Listing history 5 events
-
2026-05-31days on market $158,000 Active 13 DOM
-
2026-05-31days on market $158,000 Active 12 DOM
-
2026-05-18$165,000 Active
Show marketing remark (374 chars)
UPDATED 3 BEDROOM 1 BATH HOME ON LARGE FENCED IN LOT. FLOOD ZONE X, NO FLOOD INSURANCE REQUIRED. NO CARPET, NEW FLOORING, FRESH PAINT! 20' X 16' SHOP WITH ELECTRICAL INSTALLED, READY FOR CONNECTION TO MAIN PANEL. CHICKEN COOP TO REMAIN. 19' X 10' COVERED PATIO IN REAR OF HOME. ROOF 4 YEARS OLD. PERFECT STARTER HOME WITH PLENTY OF ROOM FOR PETS AND CHILDREN. GREAT SCHOOLS.
-
2026-05-18$165,000 Active 374-char remark
Show marketing remark (374 chars)
UPDATED 3 BEDROOM 1 BATH HOME ON LARGE FENCED IN LOT. FLOOD ZONE X, NO FLOOD INSURANCE REQUIRED. NO CARPET, NEW FLOORING, FRESH PAINT! 20' X 16' SHOP WITH ELECTRICAL INSTALLED, READY FOR CONNECTION TO MAIN PANEL. CHICKEN COOP TO REMAIN. 19' X 10' COVERED PATIO IN REAR OF HOME. ROOF 4 YEARS OLD. PERFECT STARTER HOME WITH PLENTY OF ROOM FOR PETS AND CHILDREN. GREAT SCHOOLS.
-
1997-06-19soldstatus
ⓘ Source: listings_history table (triggers on properties + properties_extension) + one-shot
backfill from property_details.listing_events for pre-trigger history.
Tax reassessment forecast LA · Resets to sale price
- Current annual tax
- $1,475 · $123/mo
- Projected year-2 tax
- $1,475 · $123/mo
- Expected delta
- $0/yr ($0/mo · 0.0%)
ⓘ Screening estimate from a state-policy table — verify with the county assessor before closing.
Climate risk First Street
- Flood 1/10 Low FEMA zone X (unshaded) · 0% chance over 30 yrs
- Wildfire 1/10 Low
- Heat 8/10 Severe 7 d/yr ≥108°F today · 20 d/yr by 30 yrs out
- Wind 9/10 Extreme 99% chance of damaging wind over 30 yrs
- Air quality 2/10 Low 1 unhealthy d/yr today · 2 by 30 yrs out
Nearby sold comps map
Loading sold comps map…
Walkable amenities ~0.75 mi
Loading nearby amenities…
Taxation est. · year 1
- Rental income
- $19,497
- − Mortgage interest
- −$8,850
- − Property taxes
- −$1,475
- − Insurance
- −$790
- − Repairs & maintenance
- −$1,560
- − Management
- −$1,560
- − Depreciation
- −$4,596
- Taxable income
- $666
- Est. tax owed @ 24.0%
- −$160
- After-tax cash flow
- $3,035/yr
For passive investors: Depreciation is non-cash, so a rental often shows a tax loss while cash-flowing — sheltering income. Rental losses are passive: they offset passive income freely, and up to $25,000/yr can offset ordinary (W-2) income if you actively participate and your MAGI is under $100k (phasing out to $0 by $150k); unused losses carry forward. On sale, claimed depreciation is recaptured at up to 25%, and gains may owe capital-gains tax (a 1031 exchange can defer both). Figures are a year-1 estimate at your 24.0% rate — not tax advice; consult a CPA.
Schools (NCES district)
- District
- Zachary Community School District
- NCES district ID
- 2200039
- Math proficiency
- 46% ▼ -38.00%
- Reading proficiency
- 60% ▼ -28.00%
- Median HH income
- $68,531
- Composite
- 46.99/100
- National rank
- #2349
- State rank
- #8 of 98 in LA
Livability — Zachary
- Score
- 69/100
- State rank
- #64
- US rank
- #8274
Category grades
Schools grade is shown separately in the Schools card above.
Census & demographics
- Census place
- Zachary, LA
- County
- East Baton Rouge Parish · 399,686 people
- City population
- 30,385
- Metro
- Baton Rouge, LA
- Population (ZIP)
- 30,385
- Household income
- $78,263
- Rent vs Own
- Severe rent burden
- 718.0
Population outlook (East Baton Rouge County) Hauer SSP2
- Today (2025)
- 464,810 people
- By 2030
- 472,137 · +1.6%
- By 2040
- 480,243 · +3.3%
- By 2050
- 484,422 · +4.2%
- By 2075
- 492,069 · +5.9%
- By 2100
- 476,347 · +2.5%
Race, ethnicity, and origin ACS 2023
- Neighborhood character
- Diverse neighborhood (Simpson 0.55)
- Race & ethnicity
- White 53% Black 41% Two or more races 4% Hispanic / Latino 2% Asian 2%
- Common ancestry
- Lithuanian 6% Italian 2% Slovak 1%
- Foreign-born
- 2% · Canada
- Languages at home
- 96% English-only · Spanish 1% German/W. Germanic 1% French/Haitian/Cajun 1%
Political lean MEDSL · East Baton Rouge
- 2024 margin
- D (+11.1) · D 54.5% · R 43.4% · Other 2.1%
- 2008→2024 swing
- +8.9pp toward D · 2008: 2.2pp · 2024: 11.1pp
- All cycles
- 2024: D+11.1 2020: D+13.1 2016: D+9.2 2012: D+5.2 2008: D+2.2
Not yet ingested
- Civics
- —
Market trends
- HPI YoY
- ▼ -47.01%
- Current HPI
- 170.2143
- Rent YoY
- ▲ 4.18%
- Metro
- Baton Rouge, LA
- State GDP YoY
- ▲ 3.29%
- F500 in state
- 10
Industry mix (Fortune 500 HQ in LA)
| Industry | F500 HQs | Revenue |
|---|---|---|
| Telecommunications | 2 | $23B |
|
||
| Utilities | 1 | $12B |
|
||
| Wholesale / Distribution | 1 | $5B |
|
||
| Advertising | 1 | $2B |
|
||
Price history
+0.0% since first listed3 events — show timeline
- 2026-05-18 Listed $165,000 AcadianaMLS
- 2026-05-18 Listed $165,000 GBRMLS
- 1997-06-19 Sold (Public Records) — Public Records
Property tax history
+44.0%/yrLatest (2025): $1,475 · -13.2% YoY. Source: county tax records.
Cash-flow waterfall
monthlySold comps — $/sqft
last 12 mo · ≤1 miLoading sold comps…