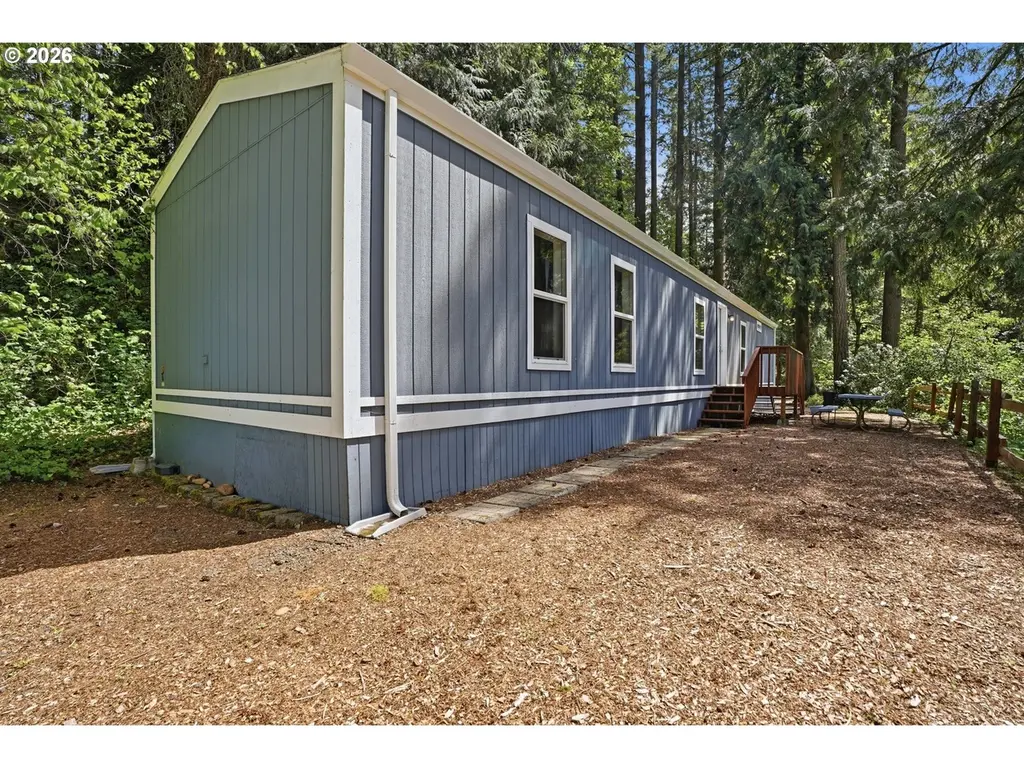
32700 SE Leewood Ln #115 · Boring, OR
Flood risk 1/10 · Minimal
- FEMA flood zone
- X (unshaded)
- Chance of flooding over 30 yrs
- 0.0%
- Est. flood insurance / yr
- $507 – $1,088
Fire risk 5/10 · Moderate
- Est. fire insurance / yr
- $498 – $926
Heat risk 2/10 · Minimal
- Hot days now (above 90°F)
- 7 days/yr
- Hot days in 30 yrs
- 15 days/yr
Wind risk 1/10 · Minimal
- Chance of severe wind over 30 yrs
- —
Air-quality risk 9/10 · Severe
- Unhealthy air days now
- 11 days/yr
- Unhealthy air days in 30 yrs
- 12 days/yr
Risk factors via First Street. Map © Google.
Why this score? — see what drove the B grade
The composite is a weighted blend of 9 inputs, each scored 0–100. Each bar is that input's sub-score; the figure is the points it added to the 100-point composite (weight × sub-score).
- Cash flow +30.0/30.0
- 1% rule +10.0/10.0
- DSCR +10.0/10.0
- ARV discount +7.5/15.0
- Schools +5.0/10.0
- Rent growth +2.5/5.0
- Livability +2.5/5.0
- Condition / age +2.5/5.0
- Appreciation +0.0/10.0
$90,900
🖨 Deal sheet 📄 Offer letter ✓ Due diligence
Listing remarks
Tucked into the peaceful, one-of-a-kind setting of Big Valley Woods, this beautifully updated home offers a rare blend of privacy, nature, and comfort. Surrounded by mature trees, tranquil ponds, and abundant wildlife, the community delivers a true wooded retreat feel while still being conveniently located in Boring, Oregon. This 2 bed, 2 bath, 924 sq ft home features an open floor plan with vaulted peak ceilings, creating a bright and spacious feel throughout the main living area. The layout flows comfortably into large bedrooms and well-sized bathrooms, offering both functionality and comfort. Recently remodeled and truly move-in ready, updates include vinyl windows, newer carpet, and fre
Key facts
- Open floor plan
- Abundant wildlife
- Peaceful setting
Tags
Property features AI
Finance
- Other: Leased land; lot features include level terrain and trees; Concrete road surface within park
- Financial info: Monthly lot rent; Land lease in effect (lease expiration available)
- HOA & community: Community center, gym, recreation center; Disc golf and hiking trails; Common areas and maintained grounds; Trash and sewer services included; Water included; Weight room; Park name: Big Valley Woods; Park home lot is leased (land lease)
Exterior
- Parking: Driveway
- Utilities: Public water; Public sewer; Electric service; Internet service: other
- Home design: Manufactured home in a park (residential); Updated/remodeled condition; View of trees/woods; Single-story (main level living)
- Construction: Built in 1997; Composition roof; Pillar/post/pier foundation; Manufactured by Redman
- Exterior features: Outbuilding and tool shed; Public road access; T-111 siding; Trees/wooded view
Interior
- Kitchen: Free-standing range; Built-in range; Eat bar and kitchen/dining room combo
- Bedrooms: Primary bedroom on main level with closet and wall-to-wall carpet; Second bedroom on main level with closet and wall-to-wall carpet
- Flooring: Vinyl flooring in kitchen areas; Wall-to-wall carpet in living areas and bedrooms
- Bathrooms: Two full bathrooms (both on main level); Bathrooms include bathtub with shower
- Heating & cooling: Forced air heating; Window unit(s) for cooling; Electric hot water
- Interior features: High ceilings; Vinyl flooring in kitchen and other areas; Wall-to-wall carpet in living areas and bedrooms; Vinyl window frames; Minimal steps (accessibility)
- Laundry & utility: Main-level utility room with washer/dryer hookups
Neighborhood map
What this means for you Summary
Snapshot
- This is a 2-bed/2.0-bath condo listed at $91k.
Deal economics
- At list price, monthly cash flow is $343 ($4k/yr) — positive.
- The deal already cash-flows at list — no discount required.
- Meets the 1% rule at list price ($2k rent vs $91k).
- Recommended offer: $88k (3.0% below list) — sets the bar for market timing.
Location & tenants
- Location reads: area grade B — affects rentability + tenant quality, not the cash-flow math above.
- Oregon Trail SD 46 (town): math 47% / reading 64% proficiency, ranked #12 of 183 in OR (top 7%) — acceptable for families but not a draw, mixed tenant base, ~2y average lease.
- Zoned schools: Naas Elementary School (345 students, 47% FRL); Boring Middle School (405 students, 34% FRL); Sandy High School (1,440 students, 32% FRL) — zoned schools at 38% FRL track the district average.
- Market conditions: 38 active listings in the ZIP; 946 units permitted in Clackamas County in 2024 (188 in 5+ unit buildings).
Forward outlook
- Local home prices are declining (-3.0%/yr); year-one equity from $628 of loan paydown is wiped out by about $3k of value loss. Plan a longer hold.
- Clackamas County population projected at +25% by 2050 — long-run rental-demand tailwind backs the buy-and-hold thesis.
- At projected returns (-3.0% appreciation + 3.0% rent growth), your $25k cash investment doubles in ~8 years — after that, you're playing with house money.
Negotiation context
- It's been on market 45 days — a 3% lower offer ($88k) is reasonable based on typical stale-listing flexibility.
Risks & watch-outs
- Watch-outs: HOA is 39% of rent.
- Climate carrying-cost: moderate wildfire risk — expect insurance premiums to compound above CPI over the hold.
Questions for the listing agent
- It's been on market 45 days. Have you received any prior offers? Is the seller open to a 3% concession, seller financing, or rate buy-down credit?
- What does the HOA fee cover, when was the last increase, and are there any pending special assessments or reserve-fund shortfalls?
- Any open or pending special assessments — roof, HVAC, plumbing, elevator, façade? What's the per-unit balance and payoff schedule, and is the seller paying it off at close or rolling it to the buyer?
- Is there a deadline driving the sale (1031 exchange, divorce, estate, relocation)? That informs how much negotiation room exists.
- What's the average days-on-market for RENTAL listings here right now (not sales)? A rising rental-DOM trend means longer vacancies and softer asking-rent achievability than the comps imply.
- What's the recent tenant-quality profile in this submarket — average credit score on applications, eviction rate, late-payment / NSF rate, and stable-employment percentage? A property-management company in the area should have these aggregated.
- How much new apartment / multifamily construction is in the pipeline within 1–3 miles? Heavy new supply (>2% of stock underway) typically softens rents 12–24 months out; light construction supports rent growth.
Investment metrics
- 1% rule
- 2.51% ✓
- Cap rate
- 10.82%
- Cash-on-cash
- 16.18%
- DSCR
- 1.72
- GRM
- 3.3
CMA / ARV
No comps found within radius.
Projected returns pro-forma
-3.0% appreciation · 3.0% rent growth · sell at horizon
- IRR
- 7.7%
- Equity multiple
- 1.30×
- Total profit
- $7,677
- Equity at exit
- $13,553
- IRR
- 17.3%
- Equity multiple
- 2.46×
- Total profit
- $37,047
- Equity at exit
- $7,859
Cash invested: $25,452 (down + closing). Projections, not guarantees.
Landlord ↔ Tenant lean methodology
- Overall (STATE)
- 28 Tenant-Leaning
- State Oregon
- 28 Tenant-Leaning · D+6
- County
- — inherits STATE
- City
- — inherits STATE
ZIP-level market 97009
- Active inventory
- 38
- Price-to-rent
- 3.3×
Monthly cashflow live
- Estimated rent
- $2,279 medium interval (Pro) →
- Mortgage (P&I)
- −$477
- Tax from tax record
- −$45 /mo · $537/yr
- Insurance
- −$38
- HOA est. from 5 same-building comps
- −$898
- Vacancy / Maint / Mgmt
- −$479
- Net cashflow
- $343
Break-even live
UW: 25.0% down · 7.5% · 30yr · 1.5% tax · 5.0% vac · 8.0% maint · 8.0% mgmt
Financing live
Cash to close
- Down payment
- $22,725
- Closing costs
- $2,727
- Reserves months
- —
- Total cash needed
- —
Loan-product check · same deal, 3 products live
Conventional
25% down · 7.5% · 30yr
- Down + closing
- —
- Monthly P&I
- —
- Monthly cashflow
- —
- DSCR
- —
- Eligible?
- —
Personal DTI + credit; lowest rate.
DSCR
20% down · 8.5% · 30yr
- Down + closing
- —
- Monthly P&I
- —
- Monthly cashflow
- —
- DSCR
- —
- Eligible?
- —
No personal income docs; deal must DSCR.
Hard money
10% down · 12.0% · 12mo
- Down + closing
- —
- Monthly P&I
- —
- Monthly cashflow
- —
- DSCR
- —
- Eligible?
- —
Short-term bridge; refi at stabilization.
HOA detail condo
- Monthly dues
- $0 · $0/yr
- Assessments
- None detected in remarks — confirm with the listing agent.
Listing history 14 events
-
2026-06-18days on market $90,900 Active 45 DOM
-
2026-06-17days on market $90,900 Active 44 DOM
-
2026-06-16days on market $90,900 Active 43 DOM
-
2026-06-15days on market $90,900 Active 42 DOM
-
2026-06-13days on market $90,900 Active 40 DOM
-
2026-06-13days on market $90,900 Active 39 DOM
-
2026-06-09days on market $90,900 Active 36 DOM
-
2026-06-08days on market $90,900 Active 35 DOM
-
2026-06-07days on market $90,900 Active 34 DOM
-
2026-06-03days on market $90,900 Active 30 DOM
-
2026-06-02days on market $90,900 Active 29 DOM
-
2026-06-01days on market $90,900 Active 28 DOM
-
2026-05-31days on market $90,900 Active 27 DOM
-
2026-05-04$90,900 Active
ⓘ Source: listings_history table (triggers on properties + properties_extension) + one-shot
backfill from property_details.listing_events for pre-trigger history.
Tax reassessment forecast OR · Resets to sale price
- Current annual tax
- $537 · $45/mo
- Projected year-2 tax
- $882 · $73/mo
- Expected delta
- +$344/yr (+$29/mo · 64.1%)
ⓘ Screening estimate from a state-policy table — verify with the county assessor before closing.
Climate risk First Street
- Flood 1/10 Low FEMA zone X (unshaded) · 0% chance over 30 yrs
- Wildfire 5/10 Major
- Heat 2/10 Low 7 d/yr ≥90°F today · 15 d/yr by 30 yrs out
- Wind 1/10 Low
- Air quality 9/10 Extreme 11 unhealthy d/yr today · 12 by 30 yrs out
Nearby sold comps map
Loading sold comps map…
Walkable amenities ~0.75 mi
Loading nearby amenities…
Taxation est. · year 1
- Rental income
- $27,351
- − Mortgage interest
- −$5,092
- − Property taxes
- −$537
- − Insurance
- −$454
- − Repairs & maintenance
- −$2,188
- − Management
- −$2,188
- − HOA
- −$10,776
- − Depreciation
- −$2,644
- Taxable income
- $3,471
- Est. tax owed @ 24.0%
- −$833
- After-tax cash flow
- $3,286/yr
For passive investors: Depreciation is non-cash, so a rental often shows a tax loss while cash-flowing — sheltering income. Rental losses are passive: they offset passive income freely, and up to $25,000/yr can offset ordinary (W-2) income if you actively participate and your MAGI is under $100k (phasing out to $0 by $150k); unused losses carry forward. On sale, claimed depreciation is recaptured at up to 25%, and gains may owe capital-gains tax (a 1031 exchange can defer both). Figures are a year-1 estimate at your 24.0% rate — not tax advice; consult a CPA.
Schools (NCES district)
- District
- Oregon Trail SD 46
- NCES district ID
- 4110890
- Math proficiency
- 47% ▬ 0.00%
- Reading proficiency
- 64% ▲ 1.00%
- Median HH income
- $61,406
- Composite
- 50.19/100
- National rank
- #4075
- State rank
- #12 of 183 in OR
Livability — Boring
No livability data for this city. (Only ~50 U.S. cities are tracked.)
Census & demographics
- Population (ZIP)
- 7,877
Population outlook (Clackamas County) Hauer SSP2
- Today (2025)
- 458,456 people
- By 2030
- 485,185 · +5.8%
- By 2040
- 532,932 · +16.2%
- By 2050
- 574,445 · +25.3%
- By 2075
- 665,497 · +45.2%
- By 2100
- 697,488 · +52.1%
Race, ethnicity, and origin ACS 2023
- Neighborhood character
- Predominantly White (73%)
- Race & ethnicity
- White 73% Hispanic / Latino 18% Two or more races 14% Asian 1%
- Hispanic origin (detail)
- Mexican 14%
- Common ancestry
- Portuguese 3% Slovak 3% Iranian 2%
- Foreign-born
- 4% · Canada, China
- Languages at home
- 91% English-only · Spanish 7% Other Indo-European 2%
Political lean MEDSL · Clackamas
- 2024 margin
- Lean D (+9.7) · D 53.4% · R 43.6% · Other 3.0%
- 2008→2024 swing
- -0.6pp no change · 2008: 10.4pp · 2024: 9.7pp
- All cycles
- 2024: D+9.7 2020: D+11.1 2016: D+6.1 2012: D+3.5 2008: D+10.4
Not yet ingested
- Civics
- —
Market trends
- HPI YoY
- ▼ -238.15%
- Current HPI
- 307.0405
- Rent YoY
- —
- Metro
- —
- State GDP YoY
- ▲ 2.05%
- F500 in state
- 2
Industry mix (Fortune 500 HQ in OR)
| Industry | F500 HQs | Revenue |
|---|---|---|
| Consumer Goods | 1 | $51B |
|
||
Price history
1 event — show timeline
- 2026-05-04 Listed $90,900 RMLS
Property tax history
+3.3%/yrLatest (2025): $537 · +4.6% YoY. Source: county tax records.
Cash-flow waterfall
monthlySold comps — $/sqft
last 12 mo · ≤1 miLoading sold comps…