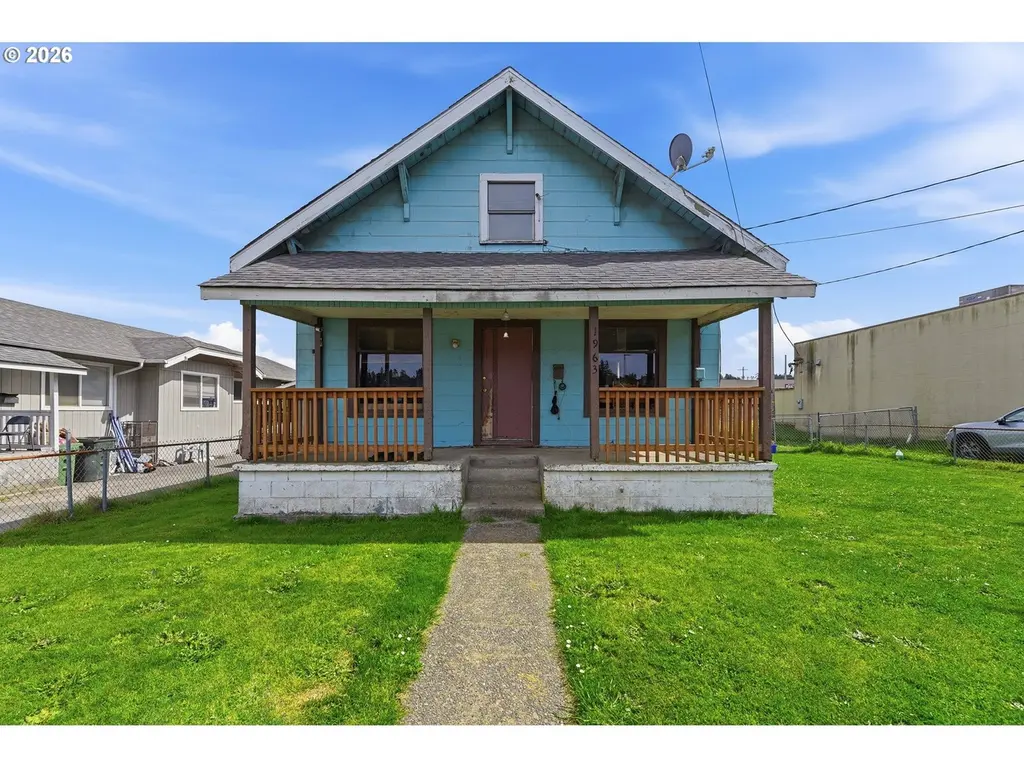
1963 Broadway Ave · North Bend, OR
Flood risk 1/10 · Minimal
- FEMA flood zone
- X (unshaded)
- Chance of flooding over 30 yrs
- 0.0%
- Est. flood insurance / yr
- $507 – $1,088
Fire risk 1/10 · Minimal
- Est. fire insurance / yr
- $498 – $926
Heat risk 1/10 · Minimal
- Hot days now (above 76°F)
- 8 days/yr
- Hot days in 30 yrs
- 22 days/yr
Wind risk 1/10 · Minimal
- Chance of severe wind over 30 yrs
- —
Air-quality risk 6/10 · Moderate
- Unhealthy air days now
- 9 days/yr
- Unhealthy air days in 30 yrs
- 9 days/yr
Risk factors via First Street. Map © Google.
Why this score? — see what drove the C+ grade
The composite is a weighted blend of 9 inputs, each scored 0–100. Each bar is that input's sub-score; the figure is the points it added to the 100-point composite (weight × sub-score).
- Cash flow +15.6/30.0
- ARV discount +15.0/15.0
- Appreciation +10.0/10.0
- DSCR +4.8/10.0
- Livability +3.6/5.0
- 1% rule +3.4/10.0
- Schools +3.3/10.0
- Rent growth +2.5/5.0
- Condition / age +2.5/5.0
$177,000
🖨 Deal sheet 📄 Offer letter ✓ Due diligence
Listing remarks
Step into this charming 3 bedroom, 2 bath home conveniently located in the heart of North Bend. Featuring an updated kitchen and classic old-wood character, this property offers a warm blend of charm and potential. The fully fenced yard provides privacy, while ample parking adds everyday convenience. With commercial zoning, this property offers exciting multi-use possibilities for residential, business, or investment opportunities. Bring your vision and fresh ideas to make this property shine again.
Key facts
- Updated kitchen
- Fully fenced yard
- Commercial zoning
Tags
Property features AI
Finance
- Financial info: Current rent amount listed as $900
Exterior
- Parking: Driveway
- Utilities: Public water; Public sewer; Electricity
- Home design: Single-family residence (detached); Approximately 1,120 total area; Main and upper levels; No view
- Construction: Built in 1916; Composition roof; County-reported building area
- Exterior features: Fenced yard; Porch; Yard
Interior
- Kitchen: Free-standing range; Free-standing refrigerator; Electric hot water
- Bedrooms: Primary bedroom (main level); Second bedroom; Third bedroom
- Flooring: Laminate flooring
- Bathrooms: 2 full bathrooms (1 on main level, 1 on upper level)
- Heating & cooling: Wall heater; No central heating; No cooling
- Interior features: Laminate flooring; Partial basement
Neighborhood map
What this means for you Summary
Snapshot
- This is a 3-bed/1.0-bath single-family listed at $177k.
Deal economics
- At list price, monthly cash flow is $74 ($893/yr) — positive.
- The deal already cash-flows at list — no discount required.
- To meet the 1% rule (rent ≥ 1% of price), the offer needs to be $148k (16.4% below list).
- Recommended offer: $148k (16.4% below list) — sets the bar for 1% rule.
- Cap rate 6.8% vs local median 3.6% in North Bend — top-decile yield for the area; either an underpriced asset or a hidden risk that comps aren't pricing in. Stress-test before assuming the spread holds.
Location & tenants
- Location reads 72/100 on livability (#105 in OR) — a middle-class / working-renter tenant base. Strengths: housing A+, health & safety A+, cost of living B+; Watch: employment C-, amenities F, commute F.
- North Bend SD 13 (town): math 30% / reading 47% proficiency, ranked #21 of 58 in OR (top 36%) — families likely to look elsewhere, expect single-tenant / working-renter base with shorter leases.
- Zoned schools: North Bay Elementary School (math 34% / reading 42%, grade F, #197 of 412 statewide, top 48%, 443 students, 69% FRL); North Bend Middle School (math 24% / reading 45%, grade F, #61 of 128 statewide, top 54%, 494 students, 68% FRL); North Bend Senior High School (math 75% / reading 75%, grade A-, #2 of 143 statewide, top 6%, 731 students, 30% FRL) — zoned schools average 56% FRL vs 40% district-wide (16 pts higher); higher-poverty schools than district average — tighter screening recommended.
- Market conditions: 170 active listings in the ZIP; 122 units permitted in Coos County in 2024 (16 in 5+ unit buildings).
Forward outlook
- In year one you build about $19k of equity ($1k loan paydown + $18k appreciation (10.0% local appreciation)).
- Coos County population projected to shrink 9% by 2050 — rents likely to lag national; underwrite the cash flow, not the appreciation.
- At projected returns (10.0% appreciation + 3.0% rent growth), your $50k cash investment doubles in ~3 years — after that, you're playing with house money.
- By year 2, paydown + projected appreciation supports a ~$30k cash-out refi (75% LTV) — recoverable capital for the next deal without selling this one.
Negotiation context
- Only 9 days on market — expect competitive offers; lowballing is unlikely to land.
Risks & watch-outs
- Watch-outs: built in 1916 — expect roof / HVAC / electrical / plumbing capex.
Questions for the listing agent
- Built in 1916 — when were the roof, HVAC, electrical panel, plumbing, and water heater last replaced?
- Is there a deadline driving the sale (1031 exchange, divorce, estate, relocation)? That informs how much negotiation room exists.
- Schools are B-rated — typically a magnet for longer-tenancy family renters. What's the average tenant stay here, and is there a school-zone premium baked into asking?
- What's the average days-on-market for RENTAL listings here right now (not sales)? A rising rental-DOM trend means longer vacancies and softer asking-rent achievability than the comps imply.
- What's the recent tenant-quality profile in this submarket — average credit score on applications, eviction rate, late-payment / NSF rate, and stable-employment percentage? A property-management company in the area should have these aggregated.
- How much new for-sale + rental construction is in the pipeline within 1–3 miles? Heavy new supply typically softens prices + rents 12–24 months out; constrained supply supports both.
Investment metrics
- 1% rule
- 0.84% ✗
- Cap rate
- 6.80%
- Cash-on-cash
- 1.80%
- DSCR
- 1.08
- GRM
- 10.0
CMA / ARV
- ARV (on-the-fly)
- $225,360
- Comps found
- 8
Show comp detail 8 sales within ~0.75 mi
| Address | Dist | Beds/Ba | Sqft | Sold | Price | $/sf | Match |
|---|---|---|---|---|---|---|---|
| 2320 Everett Ave | 0.35mi | 2/1.0 (-1) | 721 (+0%) | 17mo | $266,500 | $370 | 65 |
| 1737 Garfield St | 0.73mi | 2/1.0 (-1) | 712 (-1%) | 1mo | $150,000 | $211 | 58 |
| 1756 Mcpherson St | 0.65mi | 2/1.0 (-1) | 723 (+0%) | 15mo | $185,000 | $256 | 51 |
| 1772 Mcpherson St | 0.65mi | 2/1.0 (-1) | 816 (+13%) | 0mo | $255,000 | $313 | 42 |
| 2230 Pacific | 0.32mi | 2/1.0 (-1) | 816 (+13%) | 20mo | $329,000 | $403 | 42 |
| 2343 Brussells St | 0.66mi | 2/1.0 (-1) | 808 (+12%) | 13mo | $280,000 | $347 | 33 |
| 1848 Meade St | 0.60mi | 2/1.0 (-1) | 648 (-10%) | 22mo | $135,500 | $209 | 32 |
| 2153 17th St | 0.68mi | 2/1.0 (-1) | 792 (+10%) | 21mo | $215,000 | $271 | 29 |
Match score weights: distance 35% · size 25% · config 20% · recency 20%. Top-matched comps best support the ARV.
Projected returns pro-forma
10.0% appreciation · 3.0% rent growth · sell at horizon
- IRR
- 25.6%
- Equity multiple
- 3.04×
- Total profit
- $101,082
- Equity at exit
- $159,456
- IRR
- 22.5%
- Equity multiple
- 6.93×
- Total profit
- $293,831
- Equity at exit
- $343,872
Cash invested: $49,560 (down + closing). Projections, not guarantees.
Landlord ↔ Tenant lean methodology
- Overall (STATE)
- 28 Tenant-Leaning
- State Oregon
- 28 Tenant-Leaning · D+6
- County
- — inherits STATE
- City
- — inherits STATE
ZIP-level market 97459
- Home prices YoY
- 1.6%
- Active inventory
- 170
- Price-to-rent
- 10.0×
Monthly cashflow live
- Estimated rent
- $1,480 medium interval (Pro) →
- Mortgage (P&I)
- −$928
- Tax from tax record
- −$93 /mo · $1,117/yr
- Insurance
- −$74
- HOA
- −$0
- Vacancy / Maint / Mgmt
- −$311
- Net cashflow
- $74
Break-even live
UW: 25.0% down · 7.5% · 30yr · 1.5% tax · 5.0% vac · 8.0% maint · 8.0% mgmt
Financing live
Cash to close
- Down payment
- $44,250
- Closing costs
- $5,310
- Reserves months
- —
- Total cash needed
- —
Loan-product check · same deal, 3 products live
Conventional
25% down · 7.5% · 30yr
- Down + closing
- —
- Monthly P&I
- —
- Monthly cashflow
- —
- DSCR
- —
- Eligible?
- —
Personal DTI + credit; lowest rate.
DSCR
20% down · 8.5% · 30yr
- Down + closing
- —
- Monthly P&I
- —
- Monthly cashflow
- —
- DSCR
- —
- Eligible?
- —
No personal income docs; deal must DSCR.
Hard money
10% down · 12.0% · 12mo
- Down + closing
- —
- Monthly P&I
- —
- Monthly cashflow
- —
- DSCR
- —
- Eligible?
- —
Short-term bridge; refi at stabilization.
Listing history 2 events
-
2026-04-12status Pending
-
2026-04-03$177,000 Active
ⓘ Source: listings_history table (triggers on properties + properties_extension) + one-shot
backfill from property_details.listing_events for pre-trigger history.
Tax reassessment forecast OR · Resets to sale price
- Current annual tax
- $1,117 · $93/mo
- Projected year-2 tax
- $1,717 · $143/mo
- Expected delta
- +$600/yr (+$50/mo · 53.7%)
ⓘ Screening estimate from a state-policy table — verify with the county assessor before closing.
Climate risk First Street
- Flood 1/10 Low FEMA zone X (unshaded) · 0% chance over 30 yrs
- Wildfire 1/10 Low
- Heat 1/10 Low 8 d/yr ≥76°F today · 22 d/yr by 30 yrs out
- Wind 1/10 Low
- Air quality 6/10 Major 9 unhealthy d/yr today · 9 by 30 yrs out
Nearby sold comps map
Loading sold comps map…
Walkable amenities ~0.75 mi
Loading nearby amenities…
Taxation est. · year 1
- Rental income
- $17,764
- − Mortgage interest
- −$9,915
- − Property taxes
- −$1,117
- − Insurance
- −$885
- − Repairs & maintenance
- −$1,421
- − Management
- −$1,421
- − Depreciation
- −$5,149
- Taxable loss
- −$2,144
- Est. tax savings @ 24.0%
- +$515
- After-tax cash flow
- $1,408/yr
For passive investors: Depreciation is non-cash, so a rental often shows a tax loss while cash-flowing — sheltering income. Rental losses are passive: they offset passive income freely, and up to $25,000/yr can offset ordinary (W-2) income if you actively participate and your MAGI is under $100k (phasing out to $0 by $150k); unused losses carry forward. On sale, claimed depreciation is recaptured at up to 25%, and gains may owe capital-gains tax (a 1031 exchange can defer both). Figures are a year-1 estimate at your 24.0% rate — not tax advice; consult a CPA.
Schools (NCES district)
- District
- North Bend SD 13
- NCES district ID
- 4108820
- Math proficiency
- 30% ▼ -3.00%
- Reading proficiency
- 47% ▼ -6.00%
- Median HH income
- $43,614
- Composite
- 32.57/100
- National rank
- #5681
- State rank
- #21 of 58 in OR
Livability — North Bend
- Score
- 72/100
- State rank
- #105
- US rank
- #5876
Category grades
Schools grade is shown separately in the Schools card above.
Census & demographics
- Census place
- North Bend, OR
- Population (ZIP)
- 15,328
Population outlook (Coos County) Hauer SSP2
- Today (2025)
- 62,222 people
- By 2030
- 61,120 · -1.8%
- By 2040
- 58,478 · -6.0%
- By 2050
- 56,819 · -8.7%
- By 2075
- 54,915 · -11.7%
- By 2100
- 51,403 · -17.4%
Race, ethnicity, and origin ACS 2023
- Neighborhood character
- Predominantly White (82%)
- Race & ethnicity
- White 82% Two or more races 10% Hispanic / Latino 7% Asian 3% Native American 2%
- Hispanic origin (detail)
- Mexican 4%
- Common ancestry
- Italian 7% Portuguese 4% Lithuanian 3%
- Foreign-born
- 5% · Canada, China, Philippines
- Languages at home
- 94% English-only · Spanish 2% Chinese 1% Other Asian/Pacific 1%
Political lean MEDSL · Coos
- 2024 margin
- R (+19.9) · D 38.7% · R 58.5% · Other 2.8%
- 2008→2024 swing
- -16.8pp toward R · 2008: -3.1pp · 2024: -19.9pp
- All cycles
- 2024: R+19.9 2020: R+20.5 2016: R+24.3 2012: R+6.3 2008: R+3.1
Not yet ingested
- Civics
- —
Market trends
- HPI YoY
- ▲ 14.02%
- Current HPI
- 887.7
- Rent YoY
- —
- Metro
- —
- State GDP YoY
- ▲ 2.05%
- F500 in state
- 2
Industry mix (Fortune 500 HQ in OR)
| Industry | F500 HQs | Revenue |
|---|---|---|
| Consumer Goods | 1 | $51B |
|
||
Price history
2 events — show timeline
- 2026-04-12 Pending — RMLS
- 2026-04-03 Listed $177,000 RMLS
Property tax history
+2.3%/yrLatest (2025): $1,117 · -0.9% YoY. Source: county tax records.
Cash-flow waterfall
monthlySold comps — $/sqft
last 12 mo · ≤1 miLoading sold comps…