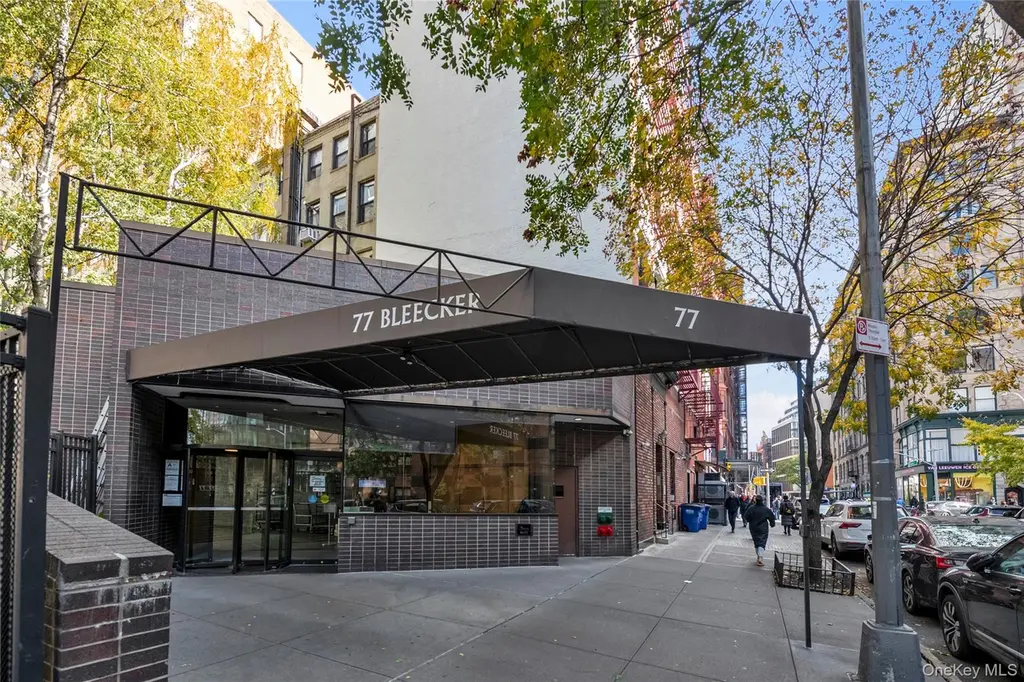
77 Bleecker St #105 · New York, NY
Flood risk 1/10 · Minimal
- FEMA flood zone
- X (unshaded)
- Chance of flooding over 30 yrs
- 0.0%
- Est. flood insurance / yr
- $507 – $1,088
Fire risk 1/10 · Minimal
- Est. fire insurance / yr
- $691 – $1,283
Heat risk 7/10 · Major
- Hot days now (above 99°F)
- 7 days/yr
- Hot days in 30 yrs
- 15 days/yr
Wind risk 6/10 · Moderate
- Chance of severe wind over 30 yrs
- 27.0%
Air-quality risk 4/10 · Minor
- Unhealthy air days now
- 5 days/yr
- Unhealthy air days in 30 yrs
- 7 days/yr
Risk factors via First Street. Map © Google.
Why this score? — see what drove the D- grade
The composite is a weighted blend of 9 inputs, each scored 0–100. Each bar is that input's sub-score; the figure is the points it added to the 100-point composite (weight × sub-score).
- Appreciation +10.0/10.0
- ARV discount +7.5/15.0
- Schools +5.0/10.0
- Rent growth +4.5/5.0
- Livability +3.8/5.0
- Condition / age +2.5/5.0
- 1% rule +2.0/10.0
- Cash flow +0.4/30.0
- DSCR +0.0/10.0
$919,000
🖨 Deal sheet (PDF) 📄 Offer letter ✓ Due diligence
Listing remarks
Welcome to Bleecker Court, a premier full-service co-op perfectly positioned in the heart of NoHo. This expansive duplex one-bedroom with a bonus office space offers 1.5 baths and a warm, inviting layout that blends charm, character, and functionality. Upon entry, you’re greeted with double floor-to-ceiling closets outfitted with custom shelving—ideal for maximizing storage. The sun-filled living room features exposed brick, oversized windows, and dramatic floor-to-ceiling mirrors, amplifying both space and light. High ceilings and rich color flooring create a sophisticated and cozy ambiance. The well-appointed kitchen includes a dedicated dining area, clean modern finishes, and
Key facts
- Bonus office space
- Custom shelving
- Exposed brick
Tags
Property features AI
Finance
- Other: Living area listed as 1218 (source: Other)
- HOA & community: Association: Century; Building amenities include elevator(s) and a park; Association fees cover sewer, snow removal, trash and water
Exterior
- Parking: No designated parking; No carport
- Utilities: Public sewer; Electricity available; Natural gas available; Water available
- Home design: Stock cooperative; Two levels; Entry level: 1; 14-story building
- Construction: Brick construction
- Exterior features: Brick exterior; Near public transit; Close to schools; Near shops
Interior
- Kitchen: Convection oven; Dishwasher; Tankless water heater
- Bedrooms: 4 rooms total (includes bedrooms and living spaces)
- Bathrooms: 1 full bathroom; 1 half bathroom
- Heating & cooling: Electric heating; Central air conditioning
- Interior features: Elevator; Pets allowed
Neighborhood map
What this means for you Summary
Snapshot
- This is a 1-bed/1.5-bath condo listed at $919k.
Deal economics
- At list price, monthly cash flow is $-4k ($-49k/yr) — negative.
- To cash-flow at today's rent, offer at most $740k (19.5% below list).
- To meet the 1% rule (rent ≥ 1% of price), the offer needs to be $648k (29.5% below list).
- Recommended offer: $648k (29.5% below list) — sets the bar for 1% rule.
- Cap rate 1.0% vs local median 2.6% in New York — below-typical yield; the buyer is paying a premium for something (appreciation thesis, condition, location) that the cap rate doesn't capture.
Location & tenants
- Location reads 75/100 on livability (#268 in NY, #4,188 nationally) — a middle-class / working-renter tenant base. Strengths: amenities A+, commute A+, health & safety A; Watch: crime F, cost of living F.
- Zoned schools: Elm Tree Elementary School (math 27% / reading 52%, grade F, #1,444 of 2,108 statewide, top 71%, 806 students, 94% FRL); Mark Twain Is 239 For The Gifted And Talented (math 90% / reading 96%, grade A+, #6 of 729 statewide, top 1%, 1,207 students, 44% FRL); Midwood High School (math 94% / reading 96%, grade A+, #83 of 1,100 statewide, top 8%, 4,062 students, 73% FRL).
- Market conditions: Rents rising fast (+8.0%/yr); 124 active listings in the ZIP; 40 comparable units currently listed for rent nearby; rentals leasing fast (median 10d on market — plan ~1-2 weeks tenant-placement turnaround); high-income renter base; 4,467 units permitted in New York County in 2024 (4,463 in 5+ unit buildings).
- At $6,476/mo this rent would consume 57% of the median local household income ($137k/yr) (locally 1775% of renters already pay >50% of income on rent) — very limited rent-growth headroom before tenants either downsize or default.
Forward outlook
- In year one you build about $98k of equity ($6k loan paydown + $92k appreciation (10.0% local appreciation)).
- New York County population projected at +21% by 2050 — long-run rental-demand tailwind backs the buy-and-hold thesis.
- By year 2, paydown + projected appreciation supports a ~$158k cash-out refi (75% LTV) — recoverable capital for the next deal without selling this one.
Negotiation context
- It's been on market 51 days — a 3% lower offer ($891k) is reasonable based on typical stale-listing flexibility.
- 2 sale attempts with the ask held roughly flat each time — persistent listings suggest the price (not the market) is what's stuck; bring a comps-based counter.
Risks & watch-outs
- Watch-outs: HOA is 44% of rent; built in 1930 — expect roof / HVAC / electrical / plumbing capex.
- Climate carrying-cost: major wind risk, 27% chance of damaging wind over 30y; extreme-heat days projected 7→15/yr by 2055 (HVAC capex compounding) — expect insurance premiums to compound above CPI over the hold.
Questions for the listing agent
- What do current leases actually rent for vs. the listed asking? Can we see a recent rent roll and the last 12 months of T-12 income?
- It's been on market 51 days. Have you received any prior offers? Is the seller open to a 30% concession, seller financing, or rate buy-down credit?
- Built in 1930 — when were the roof, HVAC, electrical panel, plumbing, and water heater last replaced?
- What does the HOA fee cover, when was the last increase, and are there any pending special assessments or reserve-fund shortfalls?
- Any open or pending special assessments — roof, HVAC, plumbing, elevator, façade? What's the per-unit balance and payoff schedule, and is the seller paying it off at close or rolling it to the buyer?
- Is there a deadline driving the sale (1031 exchange, divorce, estate, relocation)? That informs how much negotiation room exists.
- Schools are B-rated — typically a magnet for longer-tenancy family renters. What's the average tenant stay here, and is there a school-zone premium baked into asking?
- Crime grade is F in this area — have there been break-ins, vandalism, or insurance claims at this property in the last 3 years? What carrier currently insures it and at what premium?
- The area grade is low — what's the realistic commute time and amenity access for the typical tenant pool here? Any planned neighborhood developments (good or bad) we should know about?
- What's the average days-on-market for RENTAL listings here right now (not sales)? A rising rental-DOM trend means longer vacancies and softer asking-rent achievability than the comps imply.
- What's the recent tenant-quality profile in this submarket — average credit score on applications, eviction rate, late-payment / NSF rate, and stable-employment percentage? A property-management company in the area should have these aggregated.
- How much new apartment / multifamily construction is in the pipeline within 1–3 miles? Heavy new supply (>2% of stock underway) typically softens rents 12–24 months out; light construction supports rent growth.
Investment metrics
- 1% rule
- 0.70% ✗
- Cap rate
- 0.99%
- Cash-on-cash
- -18.92%
- DSCR
- 0.16
- GRM
- 11.8
CMA / ARV
No comps found within radius.
Projected returns pro-forma
10.0% appreciation · 8.0% rent growth · sell at horizon
- IRR
- 12.8%
- Equity multiple
- 2.08×
- Total profit
- $278,150
- Equity at exit
- $827,908
- IRR
- 14.4%
- Equity multiple
- 5.32×
- Total profit
- $1,110,743
- Equity at exit
- $1,785,415
Cash invested: $257,320 (down + closing). Projections, not guarantees.
Landlord ↔ Tenant lean methodology
- Overall (CITY)
- 0 Strongly Tenant-Friendly
- State New York
- 15 Strongly Tenant-Friendly · D+10
- County
- — inherits STATE
- City New York
- 0 Strongly Tenant-Friendly · D+34
ZIP-level market 10012
- Home prices YoY
- 4.3%
- Rents YoY
- 8.0%
- Active inventory
- 124
- Price-to-rent
- 11.8×
Monthly cashflow live
- Estimated rent
- $6,476 medium interval (Pro) →
- Mortgage (P&I)
- −$4,819
- Tax est. 1.5%
- −$1,149 /mo · $13,785/yr
- Insurance
- −$383
- HOA est. from 2 same-building comps
- −$2,822
- Vacancy / Maint / Mgmt
- −$1,360
- Net cashflow
- $-4,057
Break-even live
Sensitivity live
| Price | -10% $-3,422 | -5% $-3,740 | +0% $-4,057 | +5% $-4,375 | +10% $-4,692 |
|---|---|---|---|---|---|
| Rent | -10% $-4,569 | -5% $-4,313 | +0% $-4,057 | +5% $-3,802 | +10% $-3,546 |
| Rate | -1.0pp $-3,595 | -0.5pp $-3,824 | base $-4,057 | +0.5pp $-4,295 | +1.0pp $-4,538 |
UW: 25.0% down · 7.5% · 30yr · 1.5% tax · 5.0% vac · 8.0% maint · 8.0% mgmt
Financing live
Cash to close
- Down payment
- $229,750
- Closing costs
- $27,570
- Reserves months
- —
- Total cash needed
- —
Loan-product check · same deal, 3 products live
Conventional
25% down · 7.5% · 30yr
- Down + closing
- —
- Monthly P&I
- —
- Monthly cashflow
- —
- DSCR
- —
- Eligible?
- —
Personal DTI + credit; lowest rate.
DSCR
20% down · 8.5% · 30yr
- Down + closing
- —
- Monthly P&I
- —
- Monthly cashflow
- —
- DSCR
- —
- Eligible?
- —
No personal income docs; deal must DSCR.
Hard money
10% down · 12.0% · 12mo
- Down + closing
- —
- Monthly P&I
- —
- Monthly cashflow
- —
- DSCR
- —
- Eligible?
- —
Short-term bridge; refi at stabilization.
Rent comps 40 comps
| Address | Beds | Baths | Sqft | Rent | $/sqft | DOM | Units | Dist |
|---|---|---|---|---|---|---|---|---|
| 354 Bowery Unit 1035006P New York, NY | 1.0–2.0 | 2.0 | 1296 | $11,588 | $8.94 | 0d | 2 | 0.21mi |
| 179 Sullivan St Unit 1257494P New York, NY | 1.0 | 1.0 | 1248 | $21,900 | $17.55 | 26d | 1 | 0.25mi |
| 179 Sullivan St Unit 1255362P New York, NY | 1.0–2.0 | 1.0 | 1221 | $14,430 | $11.82 | 3d | 2 | 0.25mi |
| 108 Wooster St Unit 3A New York, NY | 1.0 | 2.0 | 1200 | $9,999 | $8.33 | 26d | 1 | 0.28mi |
| 11 E 1st St New York, NY | 2.0 | 1.0–2.0 | 1060 | $8,052 | $7.60 | 0d | 1 | 0.29mi |
| 131 MacDougal St Unit 1503012P New York, NY | 1.0 | 1.0 | 1270 | $16,761 | $13.20 | 26d | 1 | 0.34mi |
| 229 Chrystie St New York, NY | 1.0–2.0 | 1.0–2.0 | 810 | $6,120 | $7.56 | 6d | 3 | 0.34mi |
| 10 5th Ave Unit 1255906P New York, NY | 2.0 | 1.0 | 990 | $12,196 | $12.32 | 7d | 2 | 0.38mi |
| 10 Downing St #131 New York, NY | 1.0 | 1.0 | 731 | $9,050 | $12.38 | 6d | 2 | 0.39mi |
| 28 E 10th St Unit 10B New York, NY | 2.0 | 2.0 | 1375 | $16,000 | $11.64 | 6d | 1 | 0.40mi |
| 16 Spring St Unit GROUND New York, NY | — | 1.0 | 850 | $20,000 | $23.53 | 26d | 1 | 0.40mi |
| 3 E 9th St Unit 1541442P New York, NY | 1.0–2.0 | 1.0 | 1119 | $11,796 | $10.54 | 7d | 2 | 0.40mi |
| 112 E 10th St Unit 1021937P New York, NY | 1.0–3.0 | 1.0–2.5 | 1296 | $5,772 | $4.45 | 5d | 2 | 0.46mi |
| 10 Sheridan Sq #949 New York, NY | 2.0 | 2.0 | 1000 | $12,050 | $12.05 | 22d | 1 | 0.54mi |
| 166 2nd Ave Unit 9KK New York, NY | 2.0 | 1.5 | 950 | $8,100 | $8.53 | 9d | 1 | 0.55mi |
| 1 Union Sq S #1174 New York, NY | 2.0 | 1.0–2.0 | 775 | $10,120 | $13.06 | 12d | 3 | 0.58mi |
| 171 Suffolk St #1265 New York, NY | 1.0–2.0 | 1.0 | 650 | $6,950 | $10.69 | 9d | 2 | 0.69mi |
| 139 Christopher St Unit 1021914P New York, NY | 1.0–2.0 | 1.0 | 667 | $5,340 | $8.01 | 9d | 2 | 0.72mi |
| 540 6th Ave Unit 6A New York, NY | 1.0 | 1.0 | 793 | $8,450 | $10.66 | 9d | 1 | 0.74mi |
| 125 Delancey St #1523 New York, NY | 1.0–2.0 | 1.0–2.0 | 850 | $7,860 | $9.25 | 3d | 2 | 0.74mi |
| 87 Perry St New York, NY | 2.0 | 2.0 | 748 | $18,500 | $24.73 | 26d | 1 | 0.74mi |
| 535 Hudson St #1032 New York, NY | 1.0–2.0 | 1.0 | 550 | $6,030 | $10.96 | 9d | 2 | 0.76mi |
| 108 W 15th St #205 New York, NY | 1.0–2.0 | 1.0 | 697 | $6,050 | $8.67 | 5d | 2 | 0.77mi |
| 130 W 15th St #1383 New York, NY | 1.0–2.0 | 1.0–2.0 | 844 | $8,990 | $10.65 | 1d | 2 | 0.79mi |
| 302 W 11th St #990 New York, NY | 2.0–3.0 | 1.0–2.0 | 1050 | $8,360 | $7.96 | 5d | 2 | 0.81mi |
| 69 Leonard St Unit 1255361P New York, NY | 2.0 | 1.0 | 1248 | $14,017 | $11.23 | 24d | 1 | 0.81mi |
| 88 Leonard St New York, NY | 1.0 | 1.0 | 598 | $7,966 | $13.32 | 9d | 13 | 0.83mi |
| 111 Worth St New York, NY | 1.0–2.0 | 1.0–2.0 | 747 | $6,077 | $8.14 | 9d | 7 | 0.85mi |
| 180 Broome St #1521 New York, NY | 1.0–2.0 | 1.0–2.0 | 850 | $7,970 | $9.38 | 3d | 2 | 0.85mi |
| 401 West St Unit 5B New York, NY | 1.0 | 2.0 | 1211 | $52,500 | $43.35 | 24d | 1 | 0.86mi |
| 401 West St Unit 5A New York, NY | 1.0 | 2.0 | 811 | $39,500 | $48.71 | 24d | 1 | 0.86mi |
| 105 Duane St #183 New York, NY | 2.0 | 1.0–2.0 | 821 | $8,935 | $10.88 | 1d | 3 | 0.94mi |
| 290 3rd Ave #279 New York, NY | 1.0 | 1.0 | 607 | $9,740 | $16.03 | 5d | 2 | 1.03mi |
| 120 W 21st St New York, NY | 2.0 | 1.0–2.0 | 676 | $7,070 | $10.46 | 6d | 14 | 1.03mi |
| 180 W 20th St #1202 New York, NY | 2.0 | 1.0–2.0 | 791 | $9,465 | $11.96 | 1d | 3 | 1.03mi |
| 120 W 23rd St #693 New York, NY | 2.0 | 2.0 | 900 | $10,140 | $11.27 | 22d | 1 | 1.11mi |
| 252 South St Unit 74B New York, NY | 2.0 | 2.0 | 1034 | $8,995 | $8.70 | 19d | 1 | 1.14mi |
| 225 Cherry St Apt 76F New York, NY | 2.0 | 2.0 | 1163 | $9,995 | $8.59 | 18d | 1 | 1.17mi |
| 252 South St Unit 16H New York, NY | 2.0 | 2.0 | 1156 | $8,650 | $7.48 | 9d | 1 | 1.17mi |
| 400 Chambers St #587 New York, NY | 2.0 | 1.0–1.5 | 675 | $7,370 | $10.91 | 9d | 3 | 1.19mi |
HOA detail condo
- Monthly dues
- $0 · $0/yr
- Assessments
- None detected in remarks — confirm with the listing agent.
Listing history 16 events
-
2026-06-21days on market $919,000 Active 51 DOM
-
2026-06-18days on market $919,000 Active 48 DOM
-
2026-06-17days on market $919,000 Active 47 DOM
-
2026-06-16days on market $919,000 Active 46 DOM
-
2026-06-15days on market $919,000 Active 45 DOM
-
2026-06-13days on market $919,000 Active 43 DOM
-
2026-06-10days on market $919,000 Active 39 DOM
-
2026-06-08days on market $919,000 Active 38 DOM
-
2026-06-08days on market $919,000 Active 37 DOM
-
2026-06-04days on market $919,000 Active 34 DOM
-
2026-06-03days on market $919,000 Active 33 DOM
-
2026-06-01days on market $919,000 Active 31 DOM
-
2026-05-31days on market $919,000 Active 30 DOM
-
2026-05-01$919,000 Active
-
2026-02-03historical
-
2025-11-07$1,075,000 Active
ⓘ Source: listings_history table (triggers on properties + properties_extension) + one-shot
backfill from property_details.listing_events for pre-trigger history.
Climate risk First Street
- Flood 1/10 Low FEMA zone X (unshaded) · 0% chance over 30 yrs
- Wildfire 1/10 Low
- Heat 7/10 Severe 7 d/yr ≥99°F today · 15 d/yr by 30 yrs out
- Wind 6/10 Major 27% chance of damaging wind over 30 yrs
- Air quality 4/10 Moderate 5 unhealthy d/yr today · 7 by 30 yrs out
Nearby sold comps map
Loading sold comps map…
Walkable amenities ~0.75 mi
Loading nearby amenities…
Taxation est. · year 1
- Rental income
- $77,706
- − Mortgage interest
- −$51,478
- − Property taxes
- −$13,785
- − Insurance
- −$4,595
- − Repairs & maintenance
- −$6,216
- − Management
- −$6,216
- − HOA
- −$33,864
- − Depreciation
- −$26,735
- Taxable loss
- −$65,184
- Est. tax savings @ 24.0%
- +$15,644
- After-tax cash flow
- $-33,044/yr
For passive investors: Depreciation is non-cash, so a rental often shows a tax loss while cash-flowing — sheltering income. Rental losses are passive: they offset passive income freely, and up to $25,000/yr can offset ordinary (W-2) income if you actively participate and your MAGI is under $100k (phasing out to $0 by $150k); unused losses carry forward. On sale, claimed depreciation is recaptured at up to 25%, and gains may owe capital-gains tax (a 1031 exchange can defer both). Figures are a year-1 estimate at your 24.0% rate — not tax advice; consult a CPA.
Schools (NCES district)
No district data.
Livability — New York
- Score
- 75/100
- State rank
- #268
- US rank
- #4188
Category grades
Schools grade is shown separately in the Schools card above.
Census & demographics
- Census place
- New York, NY
- County
- New York County · 1,599,927 people
- City population
- 7,731,280
- Metro
- New York-Newark-Jersey City, NY-NJ-PA
- Population (ZIP)
- 21,426
- Household income
- $137,106
- Rent vs Own
- Severe rent burden
- 1775.0
Population outlook (New York County) Hauer SSP2
- Today (2025)
- 1,825,725 people
- By 2030
- 1,904,611 · +4.3%
- By 2040
- 2,052,719 · +12.4%
- By 2050
- 2,206,601 · +20.9%
- By 2075
- 2,509,427 · +37.4%
- By 2100
- 2,702,933 · +48.0%
Race, ethnicity, and origin ACS 2023
- Neighborhood character
- Predominantly White (66%)
- Race & ethnicity
- White 66% Asian 17% Hispanic / Latino 11% Two or more races 7% Black 3%
- Hispanic origin (detail)
- Mexican 1% Puerto Rican 2% Dominican 1%
- Common ancestry
- Romanian 4% Italian 4% Scotch-Irish 3%
- Foreign-born
- 28% · China, Canada, Jamaica
- Languages at home
- 76% English-only · Spanish 7% Chinese 5% Other Indo-European 4%
Political lean MEDSL · New York
- 2024 margin
- Solid D (+64.8) · D 82.4% · R 17.6%
- 2008→2024 swing
- -7.4pp toward R · 2008: 72.2pp · 2024: 64.8pp
- All cycles
- 2024: D+64.8 2020: D+74.5 2016: D+77.2 2012: D+69.6 2008: D+72.2
Not yet ingested
- Civics
- —
Market trends
- HPI YoY
- ▲ 11.13%
- Current HPI
- 268.4394
- Rent YoY
- ▲ 8.02%
- Metro
- New York-Newark-Jersey City, NY-NJ-PA
- State GDP YoY
- ▲ 2.60%
- F500 in state
- 92
Industry mix (Fortune 500 HQ in NY)
| Industry | F500 HQs | Revenue |
|---|---|---|
| Financial Services | 10 | $950B |
|
||
| Consumer Goods | 9 | $162B |
|
||
| Insurance | 4 | $225B |
|
||
| Telecommunications | 2 | $144B |
|
||
| Pharmaceuticals | 2 | $112B |
|
||
| Media / Entertainment | 2 | $69B |
|
||
Price history
-14.5% since first listed3 events — show timeline
- 2026-05-01 Listed $919,000 OneKey® MLS as Distributed by MLS Grid
- 2026-02-03 Listing Removed — OneKey® MLS as Distributed by MLS Grid
- 2025-11-07 Listed $1,075,000 OneKey® MLS as Distributed by MLS Grid
Cash-flow waterfall
monthlySold comps — $/sqft
last 12 mo · ≤1 miLoading sold comps…