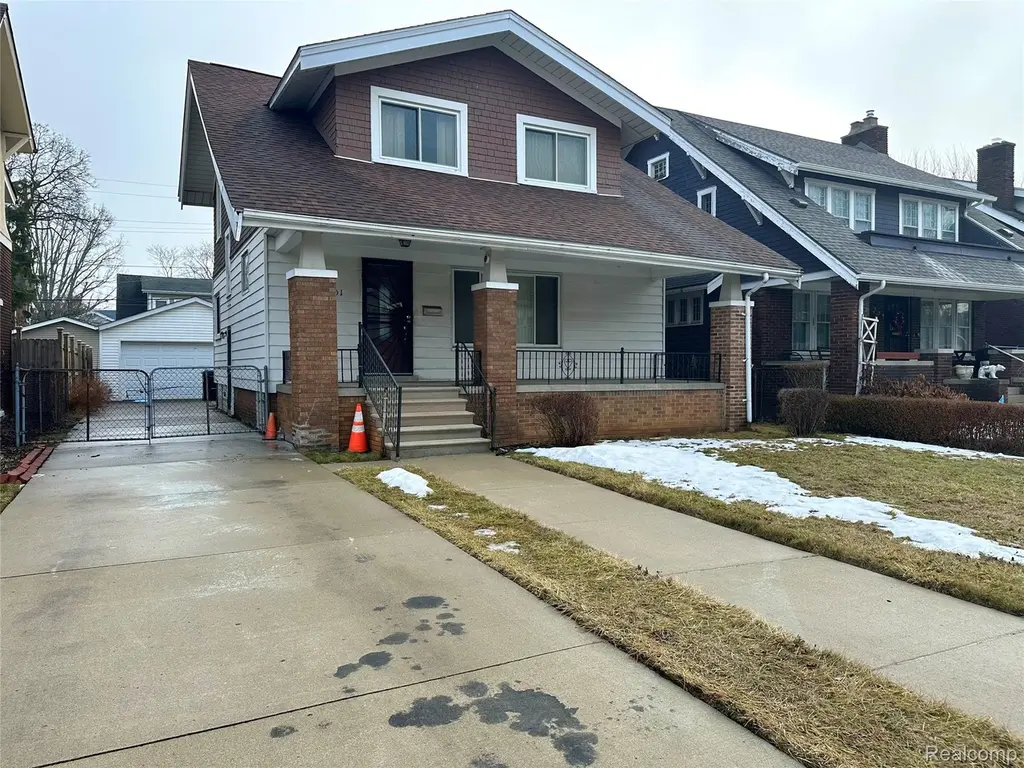
201 Moss St · Highland Park, MI
Flood risk 1/10 · Minimal
- FEMA flood zone
- X (unshaded)
- Chance of flooding over 30 yrs
- 0.0%
- Est. flood insurance / yr
- $507 – $1,088
Fire risk 1/10 · Minimal
- Est. fire insurance / yr
- $784 – $1,456
Heat risk 3/10 · Minor
- Hot days now (above 97°F)
- 7 days/yr
- Hot days in 30 yrs
- 15 days/yr
Wind risk 2/10 · Minimal
- Chance of severe wind over 30 yrs
- —
Air-quality risk 4/10 · Minor
- Unhealthy air days now
- 4 days/yr
- Unhealthy air days in 30 yrs
- 6 days/yr
Risk factors via First Street. Map © Google.
Why this score? — see what drove the B- grade
The composite is a weighted blend of 9 inputs, each scored 0–100. Each bar is that input's sub-score; the figure is the points it added to the 100-point composite (weight × sub-score).
- Cash flow +28.7/30.0
- ARV discount +10.3/15.0
- DSCR +10.0/10.0
- 1% rule +6.9/10.0
- Schools +5.0/10.0
- Livability +3.7/5.0
- Rent growth +2.5/5.0
- Condition / age +2.5/5.0
- Appreciation +0.0/10.0
$119,900
🖨 Deal sheet 📄 Offer letter ✓ Due diligence
Listing remarks MLS
GEM IN THE HEART OF HIGHLAND PARK! This spacious colonial with SUPERB curb appeal is ready for an investor or homebuyer with a vision! With a little TLC, this is an opportunity to invest in one of the most prominent neighborhoods in Highland Park. With a 2-car garage, 3 bedrooms, and 1700+ sqft, a true visionary can turn this house into a masterpiece! Priced for as-is sale, subject to probate court approval.
Key facts
- 5,227 sq ft lot
- 2 garage spots
- Built 1917
Neighborhood map
What this means for you Summary
Snapshot
- This is a 3-bed/2.0-bath single-family listed at $120k.
Deal economics
- At list price, monthly cash flow is $401 ($5k/yr) — positive.
- The deal already cash-flows at list — no discount required.
- Meets the 1% rule at list price ($1k rent vs $120k).
- Recommended offer: $109k (9.0% below list) — sets the bar for market timing.
- Cap rate 10.3% vs local median 14.2% in Highland Park — below-typical yield; the buyer is paying a premium for something (appreciation thesis, condition, location) that the cap rate doesn't capture.
Location & tenants
- Location reads 73/100 on livability (#214 in MI) — a middle-class / working-renter tenant base. Strengths: commute A+, cost of living A+, housing A+; Watch: schools F, crime F, employment F.
- Market conditions: 216 active listings in the ZIP; 10 comparable units currently listed for rent nearby; rentals at typical pace (median 25d on market — plan ~3-4 weeks tenant-placement turnaround); lower-income renter base — watch delinquency; 2,639 units permitted in Wayne County in 2024 (1,216 in 5+ unit buildings).
- This rent runs 45% of the median local income ($38k/yr) — at the standard rent-burdened threshold; future hikes will face affordability resistance.
Forward outlook
- Local home prices are declining (-3.0%/yr); year-one equity from $829 of loan paydown is wiped out by about $4k of value loss. Plan a longer hold.
- Wayne County population projected at -17% by 2050 — secular population decline; favor cash flow + early exit over multi-decade hold.
- At projected returns (-3.0% appreciation + 3.0% rent growth), your $34k cash investment doubles in ~9 years — after that, you're playing with house money.
Negotiation context
- It's been on market 118 days — a 9% lower offer ($109k) is reasonable based on typical stale-listing flexibility.
- 4 sale attempts since 14y ago with the ask held roughly flat each time — persistent listings suggest the price (not the market) is what's stuck; bring a comps-based counter.
- Current owner paid $6k; list at $120k implies a 2004% gain — meaningful room to come down on a strong offer.
Risks & watch-outs
- Watch-outs: built in 1917 — expect roof / HVAC / electrical / plumbing capex.
Questions for the listing agent
- It's been on market 118 days. Have you received any prior offers? Is the seller open to a 9% concession, seller financing, or rate buy-down credit?
- Built in 1917 — when were the roof, HVAC, electrical panel, plumbing, and water heater last replaced?
- Why hasn't it sold? Are there any deal-killer items the seller is aware of (foundation, flood, title, zoning, code violations)?
- Is there a deadline driving the sale (1031 exchange, divorce, estate, relocation)? That informs how much negotiation room exists.
- Schools are F-rated, which usually means shorter tenancies and higher turnover. Who's the typical renter profile here, and what's been the actual vacancy rate?
- Crime grade is F in this area — have there been break-ins, vandalism, or insurance claims at this property in the last 3 years? What carrier currently insures it and at what premium?
- What's the average days-on-market for RENTAL listings here right now (not sales)? A rising rental-DOM trend means longer vacancies and softer asking-rent achievability than the comps imply.
- What's the recent tenant-quality profile in this submarket — average credit score on applications, eviction rate, late-payment / NSF rate, and stable-employment percentage? A property-management company in the area should have these aggregated.
- How much new for-sale + rental construction is in the pipeline within 1–3 miles? Heavy new supply typically softens prices + rents 12–24 months out; constrained supply supports both.
Investment metrics
- 1% rule
- 1.19% ✓
- Cap rate
- 10.31%
- Cash-on-cash
- 14.33%
- DSCR
- 1.64
- GRM
- 7.0
CMA / ARV
- ARV (median comp)
- $127,895
- List price
- $119,900
- Delta
- -6.25%
- Verdict
- FAIR
- Comps
- 20 within 1.0 mi
Show comp detail 12 sales within ~0.75 mi
| Address | Dist | Beds/Ba | Sqft | Sold | Price | $/sf | Match |
|---|---|---|---|---|---|---|---|
| 161 Eason St | 0.10mi | 3/2.0 | 1,848 (+4%) | 8mo | $138,000 | $75 | 82 |
| 163 Moss St | 0.07mi | 3/1.0 | 1,678 (-6%) | 4mo | $191,000 | $114 | 80 |
| 83 Midland St | 0.28mi | 3/1.5 | 1,664 (-6%) | 1mo | $150,000 | $90 | 73 |
| 225 Moss St | 0.04mi | 3/1.5 | 1,654 (-7%) | 14mo | $65,000 | $39 | 73 |
| 214 Moss St | 0.04mi | 3/3.5 | 1,864 (+5%) | 15mo | $235,000 | $126 | 72 |
| 123 Florence St | 0.25mi | 3/1.5 | 1,900 (+7%) | 14mo | $92,500 | $49 | 64 |
| 44 Grove St | 0.39mi | 3/1.0 | 1,646 (-7%) | 10mo | $8,000 | $5 | 57 |
| 156 Hill St | 0.61mi | 3/1.5 | 1,639 (-8%) | 11mo | $154,000 | $94 | 48 |
| 127 Cedarhurst St | 0.71mi | 3/2.5 | 1,752 (-2%) | 20mo | $55,000 | $31 | 46 |
| 15398 Wabash St | 0.67mi | 3/2.0 | 1,836 (+3%) | 21mo | $30,000 | $16 | 46 |
| 41 Ferris St | 0.48mi | 4/1.5 (+1) | 1,855 (+4%) | 22mo | $169,900 | $92 | 45 |
| 16189 Inverness St | 0.69mi | 3/1.5 | 1,578 (-11%) | 18mo | $160,000 | $101 | 32 |
Match score weights: distance 35% · size 25% · config 20% · recency 20%. Top-matched comps best support the ARV.
Projected returns pro-forma
-3.0% appreciation · 3.0% rent growth · sell at horizon
- IRR
- 4.7%
- Equity multiple
- 1.18×
- Total profit
- $6,070
- Equity at exit
- $17,877
- IRR
- 14.1%
- Equity multiple
- 2.13×
- Total profit
- $38,012
- Equity at exit
- $10,367
Cash invested: $33,572 (down + closing). Projections, not guarantees.
Landlord ↔ Tenant lean methodology
- Overall (STATE)
- 62 Landlord-Friendly
- State Michigan
- 62 Landlord-Friendly · EVEN
- County
- — inherits STATE
- City
- — inherits STATE
ZIP-level market 48203
- Home prices YoY
- -23.3%
- Active inventory
- 216
- Price-to-rent
- 7.0×
Monthly cashflow live
- Estimated rent
- $1,432 high interval (Pro) →
- Mortgage (P&I)
- −$629
- Tax from tax record
- −$51 /mo · $616/yr
- Insurance
- −$50
- HOA
- −$0
- Vacancy / Maint / Mgmt
- −$301
- Net cashflow
- $401
Break-even live
UW: 25.0% down · 7.5% · 30yr · 1.5% tax · 5.0% vac · 8.0% maint · 8.0% mgmt
Financing live
Cash to close
- Down payment
- $29,975
- Closing costs
- $3,597
- Reserves months
- —
- Total cash needed
- —
Loan-product check · same deal, 3 products live
Conventional
25% down · 7.5% · 30yr
- Down + closing
- —
- Monthly P&I
- —
- Monthly cashflow
- —
- DSCR
- —
- Eligible?
- —
Personal DTI + credit; lowest rate.
DSCR
20% down · 8.5% · 30yr
- Down + closing
- —
- Monthly P&I
- —
- Monthly cashflow
- —
- DSCR
- —
- Eligible?
- —
No personal income docs; deal must DSCR.
Hard money
10% down · 12.0% · 12mo
- Down + closing
- —
- Monthly P&I
- —
- Monthly cashflow
- —
- DSCR
- —
- Eligible?
- —
Short-term bridge; refi at stabilization.
Rent comps 10 comps
| Address | Beds | Baths | Sqft | Rent | $/sqft | DOM | Units | Dist |
|---|---|---|---|---|---|---|---|---|
| 326 Eason St Highland Park, MI | 3.0 | 1.0 | 1256 | $1,300 | $1.04 | 17d | 1 | 0.25mi |
| 17550 2nd Ave Detroit, MI | 2.0 | 1.0 | 1350 | $1,150 | $0.85 | 18d | 1 | 0.55mi |
| 885 Covington Dr Unit 201 Highland Park, MI | 2.0 | 2.0 | 1350 | $1,695 | $1.26 | 43d | 1 | 0.66mi |
| 2521 W McNichols Rd Unit B2 Detroit, MI | 2.0 | 1.0 | 1300 | $1,250 | $0.96 | 43d | 1 | 0.91mi |
| 16503 Linwood St Detroit, MI | 4.0 | 2.0 | 2415 | $1,800 | $0.75 | 3d | 1 | 0.93mi |
| 64 Glendale St Highland Park, MI | 4.0 | 1.0 | 1464 | $1,500 | $1.02 | 10d | 1 | 1.18mi |
| 574 W Golden Gate Highland Park, MI | 3.0 | 1.0 | 1315 | $1,300 | $0.99 | 43d | 1 | 1.18mi |
| 168 Beresford St Highland Park, MI | 4.0 | 1.0 | 1541 | $1,475 | $0.96 | 17d | 1 | 1.19mi |
| 16834 Fairfield St Detroit, MI | 2.0 | 1.0 | 1516 | $1,363 | $0.90 | 24d | 1 | 1.30mi |
| 101 Colorado St Unit NA Highland Park, MI | 4.0 | 1.5 | 1695 | $1,500 | $0.88 | 24d | 1 | 1.38mi |
Listing history 20 events
-
2026-06-18days on market $119,900 Active 118 DOM
-
2026-06-17days on market $119,900 Active 117 DOM
-
2026-06-16days on market $119,900 Active 116 DOM
-
2026-06-15days on market $119,900 Active 115 DOM
-
2026-06-13days on market $119,900 Active 113 DOM
-
2026-06-09days on market $119,900 Active 109 DOM
-
2026-06-08days on market $119,900 Active 108 DOM
-
2026-06-07days on market $119,900 Active 107 DOM
-
2026-06-04days on market $119,900 Active 104 DOM
-
2026-06-03days on market $119,900 Active 103 DOM
-
2026-06-02days on market $119,900 Active 102 DOM
-
2026-06-01days on market $119,900 Active 101 DOM
-
2026-05-31days on market $119,900 Active 100 DOM
-
2026-02-19$119,900 Active 411-char remark
Show marketing remark (411 chars)
GEM IN THE HEART OF HIGHLAND PARK! This spacious colonial with SUPERB curb appeal is ready for an investor or homebuyer with a vision! With a little TLC, this is an opportunity to invest in one of the most prominent neighborhoods in Highland Park. With a 2-car garage, 3 bedrooms, and 1700+ sqft, a true visionary can turn this house into a masterpiece! Priced for as-is sale, subject to probate court approval.
-
2012-10-05soldstatus $5,700
-
2012-10-05soldstatus $5,700
-
2012-09-17historical
-
2012-08-07$10,000
-
2012-08-07$10,000
ⓘ Source: listings_history table (triggers on properties + properties_extension) + one-shot
backfill from property_details.listing_events for pre-trigger history.
Tax reassessment forecast MI · Partial reset (capped growth)
- Current annual tax
- $616 · $51/mo
- Projected year-2 tax
- $1,231 · $103/mo
- Expected delta
- +$615/yr (+$51/mo · 99.9%)
ⓘ Screening estimate from a state-policy table — verify with the county assessor before closing.
Climate risk First Street
- Flood 1/10 Low FEMA zone X (unshaded) · 0% chance over 30 yrs
- Wildfire 1/10 Low
- Heat 3/10 Moderate 7 d/yr ≥97°F today · 15 d/yr by 30 yrs out
- Wind 2/10 Low
- Air quality 4/10 Moderate 4 unhealthy d/yr today · 6 by 30 yrs out
Nearby sold comps map
Loading sold comps map…
Walkable amenities ~0.75 mi
Loading nearby amenities…
Taxation est. · year 1
- Rental income
- $17,180
- − Mortgage interest
- −$6,716
- − Property taxes
- −$616
- − Insurance
- −$600
- − Repairs & maintenance
- −$1,374
- − Management
- −$1,374
- − Depreciation
- −$3,488
- Taxable income
- $3,012
- Est. tax owed @ 24.0%
- −$723
- After-tax cash flow
- $4,089/yr
For passive investors: Depreciation is non-cash, so a rental often shows a tax loss while cash-flowing — sheltering income. Rental losses are passive: they offset passive income freely, and up to $25,000/yr can offset ordinary (W-2) income if you actively participate and your MAGI is under $100k (phasing out to $0 by $150k); unused losses carry forward. On sale, claimed depreciation is recaptured at up to 25%, and gains may owe capital-gains tax (a 1031 exchange can defer both). Figures are a year-1 estimate at your 24.0% rate — not tax advice; consult a CPA.
Schools (NCES district)
No district data.
Livability — Highland Park
- Score
- 73/100
- State rank
- #214
- US rank
- #5271
Category grades
Schools grade is shown separately in the Schools card above.
Census & demographics
- Census place
- Highland Park, MI
- County
- Wayne County · 1,562,939 people
- City population
- 572,865
- Metro
- Detroit-Warren-Dearborn, MI
- Population (ZIP)
- 20,049
- Household income
- $38,404
- Rent vs Own
- Severe rent burden
- 1192.0
Population outlook (Wayne County) Hauer SSP2
- Today (2025)
- 1,675,273 people
- By 2030
- 1,620,300 · -3.3%
- By 2040
- 1,502,341 · -10.3%
- By 2050
- 1,384,039 · -17.4%
- By 2075
- 1,124,592 · -32.9%
- By 2100
- 881,193 · -47.4%
Race, ethnicity, and origin ACS 2023
- Neighborhood character
- Predominantly Black (85%)
- Race & ethnicity
- Black 85% White 8% Two or more races 5% Hispanic / Latino 2%
- Common ancestry
- Lithuanian 1%
- Foreign-born
- 2% · Canada
- Languages at home
- 95% English-only · Spanish 3% French/Haitian/Cajun 1%
Political lean MEDSL · Wayne
- 2024 margin
- Strong D (+29.0) · D 62.7% · R 33.7% · Other 3.6%
- 2008→2024 swing
- -20.5pp toward R · 2008: 49.5pp · 2024: 29.0pp
- All cycles
- 2024: D+29.0 2020: D+38.1 2016: D+37.3 2012: D+46.9 2008: D+49.5
Not yet ingested
- Civics
- —
Market trends
- HPI YoY
- ▼ -90.13%
- Current HPI
- 297.0176
- Rent YoY
- —
- Metro
- Detroit-Warren-Dearborn, MI
- State GDP YoY
- ▲ 1.37%
- F500 in state
- 28
Industry mix (Fortune 500 HQ in MI)
| Industry | F500 HQs | Revenue |
|---|---|---|
| Automotive Parts | 3 | $48B |
|
||
| Automotive | 2 | $372B |
|
||
| Chemicals | 1 | $45B |
|
||
| Automotive Retail | 1 | $29B |
|
||
| Healthcare / Medical Devices | 1 | $23B |
|
||
| Automotive Technology | 1 | $20B |
|
||
Price history
+1099.0% since first listed7 events — show timeline
- 2026-02-19 Listed $119,900 MiRealSource-MiMLS
- 2026-02-19 Listed $119,900 REALCOMP
- 2012-10-05 Sold (MLS) $5,700 REALCOMP
- 2012-10-05 Sold (MLS) $5,700 MiRealSource-MiMLS
- 2012-09-17 Listing Removed — MiRealSource-MiMLS
- 2012-08-07 Listed $10,000 REALCOMP
- 2012-08-07 Listed $10,000 MiRealSource-MiMLS
Property tax history
-7.0%/yrLatest (2025): $616 · -21.7% YoY. Source: county tax records.
Cash-flow waterfall
monthlySold comps — $/sqft
last 12 mo · ≤1 miLoading sold comps…