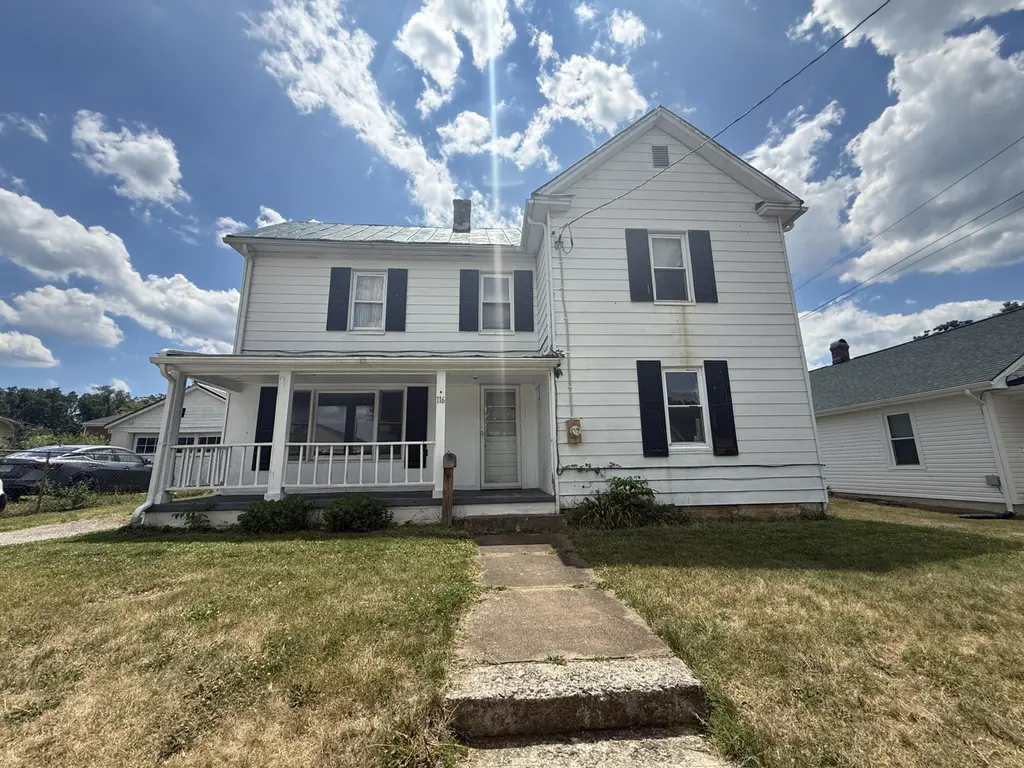
116 Front Ave · Salem, VA
Flood risk 1/10 · Minimal
- FEMA flood zone
- X
- Chance of flooding over 30 yrs
- 0.0%
- Est. flood insurance / yr
- $473 – $860
Fire risk 3/10 · Minor
- Est. fire insurance / yr
- $666 – $1,236
Heat risk 5/10 · Moderate
- Hot days now (above 101°F)
- 7 days/yr
- Hot days in 30 yrs
- 21 days/yr
Wind risk 2/10 · Minimal
- Chance of severe wind over 30 yrs
- 1.0%
Air-quality risk 1/10 · Minimal
- Unhealthy air days now
- 0 days/yr
- Unhealthy air days in 30 yrs
- 0 days/yr
Risk factors via First Street. Map © Google.
Why this score? — see what drove the B grade
The composite is a weighted blend of 9 inputs, each scored 0–100. Each bar is that input's sub-score; the figure is the points it added to the 100-point composite (weight × sub-score).
- Cash flow +30.0/30.0
- DSCR +10.0/10.0
- 1% rule +8.2/10.0
- ARV discount +7.5/15.0
- Schools +5.7/10.0
- Rent growth +4.0/5.0
- Livability +3.9/5.0
- Condition / age +2.5/5.0
- Appreciation +0.0/10.0
$150,000
🖨 Deal sheet 📄 Offer letter ✓ Due diligence
Listing remarks MLS
DO NOT GO OUT ON UPSTAIRS PORCH-UNSTEADY/AGE OF HOUSE IS ESTIMATED/ REPLACEMENT WINDOWS/ENCLOSED BACK PORCH/PREVIOUSLY RENTED FOR 699 MONTH/NO UTILITIES INCLUD/REQUIRES FLOOD INSURANCE/NICE LEVEL FENCED BACKYARD/
Key facts
- Covered front porch
- Two lots
- Covered back balcony
Tags
Property features AI
Exterior
- Home design: Residential property; Built in 1930
- Construction: Crawl space basement
- Exterior features: 0.15-acre lot
Interior
- Bedrooms: 4 bedrooms total; 1 bedroom on the main level
- Flooring: Vinyl flooring; Wood flooring
- Bathrooms: 2 full bathrooms; 1 bathroom on the main level
- Heating & cooling: Forced air gas heating
- Interior features: Storage
Neighborhood map
What this means for you Summary
Snapshot
- This is a 3-bed/1.0-bath single-family listed at $150k.
Deal economics
- At list price, monthly cash flow is $587 ($7k/yr) — positive.
- The deal already cash-flows at list — no discount required.
- Meets the 1% rule at list price ($2k rent vs $150k).
- Cap rate 11.0% vs local median 2.9% in Salem — top-decile yield for the area; either an underpriced asset or a hidden risk that comps aren't pricing in. Stress-test before assuming the spread holds.
Location & tenants
- Location reads 77/100 on livability (#104 in VA, #3,257 nationally) — a middle-class / working-renter tenant base. Strengths: housing A+, health & safety A+, cost of living A; Watch: amenities F, commute F.
- Salem City Public School District (suburban): math 61% / reading 74% proficiency, ranked #35 of 131 in VA (top 27%) — acceptable for families but not a draw, mixed tenant base, ~2y average lease.
- Zoned schools: South Salem Elementary (math 72% / reading 77%, grade A, #220 of 1,108 statewide, top 22%, 388 students, 42% FRL); Andrew Lewis Middle (math 57% / reading 72%, grade A-, #123 of 342 statewide, top 37%, 895 students, 44% FRL); Salem High (math 64% / reading 91%, grade A-, #83 of 319 statewide, top 28%, 1,227 students, 39% FRL).
- Market conditions: Rents rising fast (+6.0%/yr); 271 active listings in the ZIP; 1 comparable units currently listed for rent nearby; 268 units permitted in Salem city in 2024 (248 in 5+ unit buildings).
- This rent runs 32% of the median local income ($74k/yr) — at the standard rent-burdened threshold; future hikes will face affordability resistance.
Forward outlook
- Local home prices are declining (-3.0%/yr); year-one equity from $1k of loan paydown is wiped out by about $4k of value loss. Plan a longer hold.
- Salem County population projected at +16% by 2050 — long-run rental-demand tailwind backs the buy-and-hold thesis.
- At projected returns (-3.0% appreciation + 6.0% rent growth), your $42k cash investment doubles in ~6 years — after that, you're playing with house money.
Negotiation context
- Only 1 days on market — expect competitive offers; lowballing is unlikely to land.
- 4 sale attempts since 24y ago with the ask held roughly flat each time — persistent listings suggest the price (not the market) is what's stuck; bring a comps-based counter.
- Current owner paid $78k; list at $150k implies a 93% gain — meaningful room to come down on a strong offer.
Risks & watch-outs
- Watch-outs: built in 1930 — expect roof / HVAC / electrical / plumbing capex.
- Climate carrying-cost: extreme-heat days projected 7→21/yr by 2055 (HVAC capex compounding) — expect insurance premiums to compound above CPI over the hold.
Questions for the listing agent
- Built in 1930 — when were the roof, HVAC, electrical panel, plumbing, and water heater last replaced?
- Is there a deadline driving the sale (1031 exchange, divorce, estate, relocation)? That informs how much negotiation room exists.
- Schools are A-rated — typically a magnet for longer-tenancy family renters. What's the average tenant stay here, and is there a school-zone premium baked into asking?
- What's the average days-on-market for RENTAL listings here right now (not sales)? A rising rental-DOM trend means longer vacancies and softer asking-rent achievability than the comps imply.
- What's the recent tenant-quality profile in this submarket — average credit score on applications, eviction rate, late-payment / NSF rate, and stable-employment percentage? A property-management company in the area should have these aggregated.
- How much new for-sale + rental construction is in the pipeline within 1–3 miles? Heavy new supply typically softens prices + rents 12–24 months out; constrained supply supports both.
Investment metrics
- 1% rule
- 1.32% ✓
- Cap rate
- 10.99%
- Cash-on-cash
- 16.76%
- DSCR
- 1.75
- GRM
- 6.3
CMA / ARV
- ARV (on-the-fly)
- $369,148
- Comps found
- 12
Show comp detail 12 sales within ~0.75 mi
| Address | Dist | Beds/Ba | Sqft | Sold | Price | $/sf | Match |
|---|---|---|---|---|---|---|---|
| 400 Kimball Ave | 0.22mi | 2/2.0 (-1) | 1,525 (-5%) | 10mo | $368,000 | $241 | 63 |
| 402 7th St | 0.61mi | 3/2.5 | 1,640 (+2%) | 3mo | $268,000 | $163 | 60 |
| 305 Bowman Ave | 0.15mi | 3/1.0 | 1,842 (+14%) | 13mo | $265,000 | $144 | 58 |
| 401 Decatur Cir | 0.24mi | 3/2.0 | 1,768 (+10%) | 13mo | $429,950 | $243 | 58 |
| 208 Kimball Ave | 0.14mi | 3/3.0 | 1,788 (+11%) | 15mo | $315,000 | $176 | 55 |
| 812 Kimball Ave | 0.61mi | 3/2.0 | 1,729 (+7%) | 1mo | $327,000 | $189 | 54 |
| 118 Parker Ln | 0.75mi | 3/2.0 | 1,650 (+2%) | 6mo | $377,950 | $229 | 52 |
| 619 Moran Ave | 0.45mi | 3/2.0 | 1,435 (-11%) | 9mo | $359,000 | $250 | 49 |
| 113 Parker Ln | 0.72mi | 3/2.0 | 1,648 (+2%) | 12mo | $384,950 | $234 | 49 |
| 114 Parker Ln | 0.75mi | 3/2.0 | 1,648 (+2%) | 13mo | $389,950 | $237 | 46 |
| 610 Central Ave | 0.45mi | 3/2.5 | 1,828 (+13%) | 8mo | $310,000 | $170 | 44 |
| 719 Delaware St | 0.75mi | 2/1.0 (-1) | 1,696 (+5%) | 12mo | $245,000 | $144 | 41 |
Match score weights: distance 35% · size 25% · config 20% · recency 20%. Top-matched comps best support the ARV.
Projected returns pro-forma
-3.0% appreciation · 5.98% rent growth · sell at horizon
- IRR
- 11.1%
- Equity multiple
- 1.46×
- Total profit
- $19,175
- Equity at exit
- $22,365
- IRR
- 22.4%
- Equity multiple
- 3.18×
- Total profit
- $91,478
- Equity at exit
- $12,969
Cash invested: $42,000 (down + closing). Projections, not guarantees.
Landlord ↔ Tenant lean methodology
- Overall (STATE)
- 55 Moderately Landlord-Leaning
- State Virginia
- 55 Moderately Landlord-Leaning · D+2
- County
- — inherits STATE
- City
- — inherits STATE
ZIP-level market 24153
- Rents YoY
- 6.0%
- Active inventory
- 271
- Price-to-rent
- 6.3×
Monthly cashflow live
- Estimated rent
- $1,981 medium interval (Pro) →
- Mortgage (P&I)
- −$787
- Tax from tax record
- −$129 /mo · $1,549/yr
- Insurance
- −$62
- HOA
- −$0
- Vacancy / Maint / Mgmt
- −$416
- Net cashflow
- $587
Break-even live
UW: 25.0% down · 7.5% · 30yr · 1.5% tax · 5.0% vac · 8.0% maint · 8.0% mgmt
Financing live
Cash to close
- Down payment
- $37,500
- Closing costs
- $4,500
- Reserves months
- —
- Total cash needed
- —
Loan-product check · same deal, 3 products live
Conventional
25% down · 7.5% · 30yr
- Down + closing
- —
- Monthly P&I
- —
- Monthly cashflow
- —
- DSCR
- —
- Eligible?
- —
Personal DTI + credit; lowest rate.
DSCR
20% down · 8.5% · 30yr
- Down + closing
- —
- Monthly P&I
- —
- Monthly cashflow
- —
- DSCR
- —
- Eligible?
- —
No personal income docs; deal must DSCR.
Hard money
10% down · 12.0% · 12mo
- Down + closing
- —
- Monthly P&I
- —
- Monthly cashflow
- —
- DSCR
- —
- Eligible?
- —
Short-term bridge; refi at stabilization.
Rent comps 1 comps
| Address | Beds | Baths | Sqft | Rent | $/sqft | DOM | Units | Dist |
|---|---|---|---|---|---|---|---|---|
| 928 Ohio Ave Salem, VA | 3.0 | 1.0–2.0 | 992 | $2,622 | $2.64 | 13d | 1 | 0.75mi |
Listing history 2 events
-
2026-06-18remarks 699-char remark
-
2026-06-18$150,000 Active 1 DOM
ⓘ Source: listings_history table (triggers on properties + properties_extension) + one-shot
backfill from property_details.listing_events for pre-trigger history.
Tax reassessment forecast VA · Resets to sale price
- Current annual tax
- $1,549 · $129/mo
- Projected year-2 tax
- $1,549 · $129/mo
- Expected delta
- $0/yr ($0/mo · 0.0%)
ⓘ Screening estimate from a state-policy table — verify with the county assessor before closing.
Climate risk First Street
- Flood 1/10 Low FEMA zone X · 0% chance over 30 yrs
- Wildfire 3/10 Moderate
- Heat 5/10 Major 7 d/yr ≥101°F today · 21 d/yr by 30 yrs out
- Wind 2/10 Low 100% chance of damaging wind over 30 yrs
- Air quality 1/10 Low 0 unhealthy d/yr today · 0 by 30 yrs out
Nearby sold comps map
Loading sold comps map…
Walkable amenities ~0.75 mi
Loading nearby amenities…
Taxation est. · year 1
- Rental income
- $23,772
- − Mortgage interest
- −$8,402
- − Property taxes
- −$1,549
- − Insurance
- −$750
- − Repairs & maintenance
- −$1,902
- − Management
- −$1,902
- − Depreciation
- −$4,364
- Taxable income
- $4,903
- Est. tax owed @ 24.0%
- −$1,177
- After-tax cash flow
- $5,864/yr
For passive investors: Depreciation is non-cash, so a rental often shows a tax loss while cash-flowing — sheltering income. Rental losses are passive: they offset passive income freely, and up to $25,000/yr can offset ordinary (W-2) income if you actively participate and your MAGI is under $100k (phasing out to $0 by $150k); unused losses carry forward. On sale, claimed depreciation is recaptured at up to 25%, and gains may owe capital-gains tax (a 1031 exchange can defer both). Figures are a year-1 estimate at your 24.0% rate — not tax advice; consult a CPA.
Schools (NCES district)
- District
- Salem City Public School District
- NCES district ID
- 5103460
- Math proficiency
- 61% ▼ -21.00%
- Reading proficiency
- 74% ▼ -7.00%
- Median HH income
- $49,976
- Composite
- 57.25/100
- National rank
- #1092
- State rank
- #35 of 131 in VA
Livability — Salem
- Score
- 77/100
- State rank
- #104
- US rank
- #3257
Category grades
Schools grade is shown separately in the Schools card above.
Census & demographics
- Census place
- Salem, VA
- County
- Salem City · 38,914 people
- City population
- 38,914
- Metro
- Roanoke, VA
- Population (ZIP)
- 38,914
- Household income
- $74,260
- Rent vs Own
- Severe rent burden
- 1115.0
Population outlook (Salem County) Hauer SSP2
- Today (2025)
- 26,761 people
- By 2030
- 27,543 · +2.9%
- By 2040
- 29,174 · +9.0%
- By 2050
- 30,902 · +15.5%
- By 2075
- 35,530 · +32.8%
- By 2100
- 39,381 · +47.2%
Race, ethnicity, and origin ACS 2023
- Neighborhood character
- Predominantly White (84%)
- Race & ethnicity
- White 84% Black 6% Hispanic / Latino 4% Two or more races 4% Asian 2%
- Common ancestry
- Serbian 2% Slovak 2% Romanian 1%
- Foreign-born
- 4% · Canada, China
- Languages at home
- 96% English-only · Spanish 2% Other Indo-European 1%
Political lean MEDSL · Salem
- 2024 margin
- R (+19.3) · D 39.8% · R 59.1% · Other 1.1%
- 2008→2024 swing
- -3.8pp toward R · 2008: -15.5pp · 2024: -19.3pp
- All cycles
- 2024: R+19.3 2020: R+19.4 2016: R+24.8 2012: R+20.6 2008: R+15.5
Not yet ingested
- Civics
- —
Market trends
- HPI YoY
- ▼ -259.46%
- Current HPI
- 170.8986
- Rent YoY
- ▲ 5.98%
- Metro
- Roanoke, VA
- State GDP YoY
- ▲ 2.40%
- F500 in state
- 50
Industry mix (Fortune 500 HQ in VA)
| Industry | F500 HQs | Revenue |
|---|---|---|
| Aerospace / Defense | 4 | $236B |
|
||
| Technology / Defense | 3 | $32B |
|
||
| Financial Services | 2 | $176B |
|
||
| Utilities | 2 | $27B |
|
||
| Insurance | 2 | $25B |
|
||
| Technology | 2 | $15B |
|
||
Price history
+76.6% since first listed11 events — show timeline
- 2026-06-18 Listed $150,000 MLSRV
- 2004-12-09 Sold (MLS) $77,750 MLSRV
- 2004-12-08 Sold (Public Records) $78,000 Public Records
- 2004-12-08 Sold (Public Records) $78,000 Public Records
- 2004-08-24 Listed $79,500 MLSRV
- 2004-06-11 Sold (Public Records) $82,500 Public Records
- 2004-06-11 Sold (Public Records) $82,500 Public Records
- 2004-03-05 Listing Removed — MLSRV
- 2003-11-05 Listed $84,950 MLSRV
- 2002-10-28 Listing Removed — MLSRV
- 2002-05-01 Listed $84,950 MLSRV
Property tax history
+3.4%/yrLatest (2025): $1,549 · +8.9% YoY. Source: county tax records.
Cash-flow waterfall
monthlySold comps — $/sqft
last 12 mo · ≤1 miLoading sold comps…