1190 Yesica Ann Cir Unit B205 · Naples Park, FL
Flood risk 7/10 · Major
- FEMA flood zone
- X (shaded)
- Chance of flooding over 30 yrs
- 0.96%
- Est. flood insurance / yr
- $507 – $1,088
Fire risk 3/10 · Minor
- Est. fire insurance / yr
- $947 – $1,759
Heat risk 10/10 · Severe
- Hot days now (above 107°F)
- 8 days/yr
- Hot days in 30 yrs
- 34 days/yr
Wind risk 10/10 · Severe
- Chance of severe wind over 30 yrs
- 99.0%
Air-quality risk 2/10 · Minimal
- Unhealthy air days now
- 1 days/yr
- Unhealthy air days in 30 yrs
- 1 days/yr
Risk factors via First Street. Map © Google.
Why this score? — see what drove the B grade
The composite is a weighted blend of 9 inputs, each scored 0–100. Each bar is that input's sub-score; the figure is the points it added to the 100-point composite (weight × sub-score).
- Cash flow +30.0/30.0
- 1% rule +10.0/10.0
- DSCR +10.0/10.0
- ARV discount +7.5/15.0
- Schools +5.0/10.0
- Condition / age +3.8/5.0
- Livability +3.2/5.0
- Rent growth +2.2/5.0
- Appreciation +0.0/10.0
$249,000
🖨 Deal sheet 📄 Offer letter ✓ Due diligence
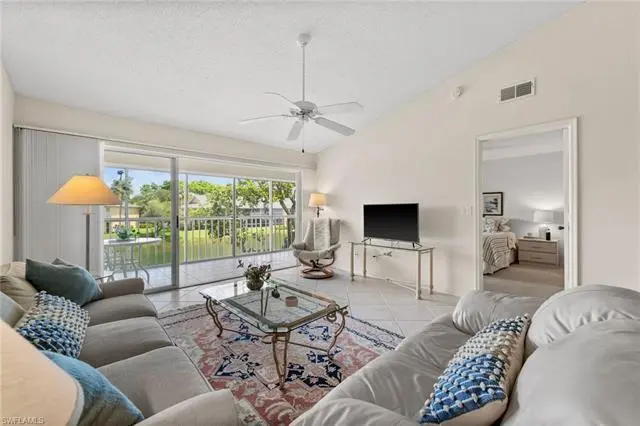
Listing remarks
Welcome home to this light and bright condo, with amazing lake views. This well-maintained unit is offered fully furnished, allowing you to move right in. The open floor plan features an eat-in kitchen, and open feel that is perfect for hosting gatherings. The split bedroom design ensures both privacy and convenience for you and your guests. The large lanai offers additional living space with peaceful water views, and the ideal location of the condo allows you to take advantage of being just steps away from the community pool. Nestled within a nicely landscaped and well-cared-for community, this condo boasts low fees and is ideally located near pristine beaches, world-class dining, entertai
Key facts
- Split bedroom design
- Nicely landscaped
- Community pool
Tags
Property features AI
Finance
- Other: Property is one of 112 units in the complex and 8 units in the building; Two units per floor; building has 1 floor (unit-level info); Restrictions include architectural controls, deeded rules, no commercial use, and no motorcycles
- HOA & community: Mandatory HOA with professional management; Quarterly condo fee; Condo fee $1,900 quarterly (total annual recurring fees $7,600); One-time fees $100; HOA maintenance covers cable, insurance, irrigation water, lawn/land maintenance, legal/accounting, manager, and exterior pest control; Community amenities include pool, golf course, private membership options, streetlights, and underground utilities; Community type: gated, golf course (golf equity)
Exterior
- Parking: 1 assigned parking space; Guest parking; Paved parking
- Security: Gated community; Guard at gate
- Utilities: Central water; Central sewer; Cable available
- Home design: Residential property in a low-rise (1–3) building; 2-story building; Zero lot line unit; Rear exposure faces north; Located in Imperial Golf Estates / Abbey on the Lake
- Construction: Concrete block construction; Stucco exterior; Shingle roof; Year built 1991
- Exterior features: Lake view; Water display; Paved road access
Interior
- Kitchen: Pantry; Dishwasher; Disposal; Microwave; Range; Refrigerator/Freezer; Breakfast bar; Breakfast room; Eat-in kitchen / dining area; Dining area open to living
- Bedrooms: 2 bedrooms (split bedroom layout)
- Flooring: Carpet; Tile
- Bathrooms: 2 full bathrooms; Master bathroom with shower (no tub)
- Heating & cooling: Central electric heat; Central electric air conditioning; Ceiling fans
- Interior features: High-speed internet available; Pantry; Smoke detectors; Walk-in closet; Window coverings; Turnkey furnished; Great room floor plan; Split bedroom layout; Screened lanai/porch; Laundry in residence; 4 ceiling fans
- Laundry & utility: Washer and dryer in unit
Neighborhood map
What this means for you Summary
Snapshot
- This is a 2-bed/2.0-bath condo listed at $249k. Condition is rated good.
Deal economics
- At list price, monthly cash flow is $1k ($14k/yr) — positive.
- The deal already cash-flows at list — no discount required.
- Meets the 1% rule at list price ($5k rent vs $249k).
- Recommended offer: $219k (12.0% below list) — sets the bar for market timing.
Location & tenants
- Location reads 64/100 on livability (#696 in FL) — a middle-class / working-renter tenant base. Strengths: crime A+, housing A-, employment B+; Watch: health & safety D, amenities F, commute F.
- Collier (suburban): math 60% / reading 56% proficiency, ranked #16 of 73 in FL (top 22%) — acceptable for families but not a draw, mixed tenant base, ~2y average lease.
- Zoned schools: Veterans Memorial Elementary School (math 78% / reading 79%, grade A, #141 of 2,144 statewide, top 7%, 743 students, 22% FRL) — zoned schools average 22% FRL vs 55% district-wide (33 pts lower); this property's tenant base skews higher-income than the district average.
- Zoned-school proficiency averages 78% at this address vs 58% district-wide (+20 pts) — the actual schools serving this property are materially stronger than the Collier average implies; a family-tenant draw the district grade alone would hide.
- Market conditions: Rents soft (-1.1%/yr); 595 active listings in the ZIP; 35 comparable units currently listed for rent nearby; rentals at typical pace (median 24d on market — plan ~3-4 weeks tenant-placement turnaround); solid renter incomes; 3,520 units permitted in Collier County in 2024 (959 in 5+ unit buildings).
- At $4,555/mo this rent would consume 56% of the median local household income ($98k/yr) (locally 1006% of renters already pay >50% of income on rent) — very limited rent-growth headroom before tenants either downsize or default.
Forward outlook
- Local home prices are declining (-3.0%/yr); year-one equity from $2k of loan paydown is wiped out by about $7k of value loss. Plan a longer hold.
- Collier County population projected at +30% by 2050 — long-run rental-demand tailwind backs the buy-and-hold thesis.
- At projected returns (-3.0% appreciation + 0.0% rent growth), your $70k cash investment doubles in ~9 years — after that, you're playing with house money.
Negotiation context
- It's been on market 325 days — a 12% lower offer ($219k) is reasonable based on typical stale-listing flexibility.
Risks & watch-outs
- Watch-outs: flood insurance adds $66/mo.
- Climate carrying-cost: major flood risk; severe wind risk, 99% chance of damaging wind over 30y; extreme-heat days projected 8→34/yr by 2055 (HVAC capex compounding) — expect insurance premiums to compound above CPI over the hold.
Questions for the listing agent
- It's been on market 325 days. Have you received any prior offers? Is the seller open to a 12% concession, seller financing, or rate buy-down credit?
- What's the actual annual flood-insurance premium (NFIP or private), and is the property in a SFHA with mandatory coverage?
- What does the HOA fee cover, when was the last increase, and are there any pending special assessments or reserve-fund shortfalls?
- Any open or pending special assessments — roof, HVAC, plumbing, elevator, façade? What's the per-unit balance and payoff schedule, and is the seller paying it off at close or rolling it to the buyer?
- Why hasn't it sold? Are there any deal-killer items the seller is aware of (foundation, flood, title, zoning, code violations)?
- Is there a deadline driving the sale (1031 exchange, divorce, estate, relocation)? That informs how much negotiation room exists.
- Schools are F-rated, which usually means shorter tenancies and higher turnover. Who's the typical renter profile here, and what's been the actual vacancy rate?
- What's the average days-on-market for RENTAL listings here right now (not sales)? A rising rental-DOM trend means longer vacancies and softer asking-rent achievability than the comps imply.
- What's the recent tenant-quality profile in this submarket — average credit score on applications, eviction rate, late-payment / NSF rate, and stable-employment percentage? A property-management company in the area should have these aggregated.
- How much new apartment / multifamily construction is in the pipeline within 1–3 miles? Heavy new supply (>2% of stock underway) typically softens rents 12–24 months out; light construction supports rent growth.
Investment metrics
- 1% rule
- 1.83% ✓
- Cap rate
- 12.29%
- Cash-on-cash
- 21.43%
- DSCR
- 1.95
- GRM
- 4.6
CMA / ARV
No comps found within radius.
Projected returns pro-forma
-3.0% appreciation · 0.0% rent growth · sell at horizon
- IRR
- 8.3%
- Equity multiple
- 1.31×
- Total profit
- $21,850
- Equity at exit
- $37,127
- IRR
- 14.2%
- Equity multiple
- 1.95×
- Total profit
- $66,100
- Equity at exit
- $21,529
Cash invested: $69,720 (down + closing). Projections, not guarantees.
Landlord ↔ Tenant lean methodology
- Overall (STATE)
- 87 Strongly Landlord-Friendly
- State Florida
- 87 Strongly Landlord-Friendly · R+3
- County
- — inherits STATE
- City
- — inherits STATE
ZIP-level market 34110
- Rents YoY
- -1.1%
- Active inventory
- 595
- Price-to-rent
- 4.6×
Monthly cashflow live
- Estimated rent
- $4,555 high interval (Pro) →
- Mortgage (P&I)
- −$1,306
- Tax est. 1.5%
- −$311 /mo · $3,735/yr
- Insurance
- −$104
- Flood insurance flood zone
- −$66 /mo · $798/yr
- HOA
- −$633
- Vacancy / Maint / Mgmt
- −$957
- Net cashflow
- $1,178
Break-even live
UW: 25.0% down · 7.5% · 30yr · 1.5% tax · 5.0% vac · 8.0% maint · 8.0% mgmt
Financing live
Cash to close
- Down payment
- $62,250
- Closing costs
- $7,470
- Reserves months
- —
- Total cash needed
- —
Loan-product check · same deal, 3 products live
Conventional
25% down · 7.5% · 30yr
- Down + closing
- —
- Monthly P&I
- —
- Monthly cashflow
- —
- DSCR
- —
- Eligible?
- —
Personal DTI + credit; lowest rate.
DSCR
20% down · 8.5% · 30yr
- Down + closing
- —
- Monthly P&I
- —
- Monthly cashflow
- —
- DSCR
- —
- Eligible?
- —
No personal income docs; deal must DSCR.
Hard money
10% down · 12.0% · 12mo
- Down + closing
- —
- Monthly P&I
- —
- Monthly cashflow
- —
- DSCR
- —
- Eligible?
- —
Short-term bridge; refi at stabilization.
Rent comps 35 comps
| Address | Beds | Baths | Sqft | Rent | $/sqft | DOM | Units | Dist |
|---|---|---|---|---|---|---|---|---|
| 1190 Yesica Ann Cir Unit B101 Naples, FL | 2.0 | 2.0 | 1245 | $2,500 | $2.01 | 13d | 1 | 0.02mi |
| 1150 Yesica Ann Cir Unit A205 Naples, FL | 2.0 | 2.0 | 1300 | $6,000 | $4.62 | 13d | 1 | 0.05mi |
| 1290 Yesica Ann Cir Unit G-105 Naples, FL | 2.0 | 2.0 | 1168 | $5,500 | $4.71 | 13d | 1 | 0.06mi |
| 1290 Yesica Ann Cir Unit G203 Naples, FL | 2.0 | 2.0 | 1245 | $6,000 | $4.82 | 13d | 1 | 0.06mi |
| 1120 Sarah Jean Cir Unit B205 Naples, FL | 3.0 | 2.0 | 1370 | $2,300 | $1.68 | 13d | 1 | 0.14mi |
| 1351 Park Lake Dr Unit 14R Naples, FL | 2.0 | 2.0 | 1400 | $2,200 | $1.57 | 13d | 1 | 0.32mi |
| 953 Bunker Hill Dr Naples, FL | 2.0 | 2.0 | 1100 | $3,200 | $2.91 | 13d | 1 | 0.49mi |
| 1530 Imperial Golf Course Blvd #321 Naples, FL | 2.0 | 2.0 | 1400 | $2,100 | $1.50 | 23d | 1 | 0.51mi |
| 1337 Center Ln Naples, FL | 3.0 | 2.0 | 1500 | $4,300 | $2.87 | 23d | 1 | 0.56mi |
| 1520 Imperial Golf Course Blvd #211 Naples, FL | 2.0 | 2.0 | 1357 | $5,000 | $3.68 | 23d | 1 | 0.56mi |
| 830 Wiggins Pass Rd #10 Naples, FL | 1.0 | 1.0 | 800 | $1,350 | $1.69 | 23d | 1 | 0.58mi |
| 975 Tarpon Cove Dr #204 Naples, FL | 3.0 | 2.0 | 1340 | $5,500 | $4.10 | 13d | 1 | 0.70mi |
| 752 Wiggins Lake Dr #102 Naples, FL | 2.0 | 2.0 | 1402 | $2,375 | $1.69 | 21d | 1 | 0.71mi |
| 757 Wiggins Lake Dr #106 Naples, FL | 3.0 | 2.0 | 1374 | $6,000 | $4.37 | 13d | 1 | 0.72mi |
| 757 Wiggins Lake Dr #106 Naples, FL | 3.0 | 2.0 | 1374 | $6,000 | $4.37 | 23d | 1 | 0.72mi |
| 1790 Imperial Golf Course Blvd Unit A205 Naples, FL | 2.0 | 2.0 | 1183 | $2,300 | $1.94 | 13d | 1 | 0.73mi |
| 760 Wiggins Lake Dr #205 Naples, FL | 2.0 | 2.0 | 1179 | $5,500 | $4.66 | 23d | 1 | 0.73mi |
| 1282 Belaire Ct Naples, FL | 3.0 | 3.5 | 1495 | $9,500 | $6.35 | 23d | 1 | 0.79mi |
| 437 Wiggins Lake Ct #201 Naples, FL | 2.0 | 2.0 | 1283 | $4,500 | $3.51 | 23d | 1 | 0.81mi |
| 13140 Hamilton Harbour Dr Unit F4 Naples, FL | 2.0 | 2.0 | 1340 | $5,500 | $4.10 | 23d | 1 | 0.83mi |
| 1025 Tarpon Cove Dr #203 Naples, FL | 2.0 | 2.0 | 1225 | $5,500 | $4.49 | 13d | 1 | 0.83mi |
| 774 Wiggins Lake Dr #106 Naples, FL | 3.0 | 2.0 | 1374 | $6,500 | $4.73 | 23d | 1 | 0.84mi |
| 651 Wiggins Lake Dr #102 Naples, FL | 2.0 | 2.0 | 1487 | $6,500 | $4.37 | 23d | 1 | 0.88mi |
| 1130 Turtle Creek Blvd Naples, FL | 1.0–2.0 | 1.0–2.0 | 800 | $2,145 | $2.68 | 13d | 22 | 0.93mi |
| 480 Bermuda Cove Way Unit 1-104 Naples, FL | 2.0 | 2.0 | 1372 | $4,250 | $3.10 | 23d | 1 | 1.09mi |
| 360 Horse Creek Dr Naples, FL | 2.0 | 2.0 | 1589 | $5,250 | $3.30 | 13d | 4 | 1.22mi |
| 340 Horse Creek Dr #304 Naples, FL | 2.0 | 2.0 | 1326 | $2,950 | $2.22 | 23d | 1 | 1.26mi |
| 320 Horse Creek Dr #105 Naples, FL | 2.0 | 2.0 | 1326 | $5,600 | $4.22 | 23d | 1 | 1.29mi |
| 300 Horse Creek Dr #408 Naples, FL | 2.0 | 2.0 | 1434 | $5,500 | $3.84 | 23d | 1 | 1.32mi |
| 241 Palm River Blvd Unit C202 Naples, FL | 2.0 | 2.0 | 1430 | $3,500 | $2.45 | 23d | 1 | 1.33mi |
| 240 Palm River Blvd Unit C102 Naples, FL | 2.0 | 2.0 | 1440 | $2,995 | $2.08 | 23d | 1 | 1.38mi |
| 12945 Vanderbilt Dr Naples, FL | 2.0 | 2.0 | 1301 | $5,250 | $4.04 | 23d | 2 | 1.44mi |
| 13105 Vanderbilt Dr #808 Naples, FL | 2.0 | 2.0 | 1390 | $5,500 | $3.96 | 13d | 1 | 1.47mi |
| 13105 Vanderbilt Dr #808 Naples, FL | 2.0 | 2.0 | 1390 | $5,500 | $3.96 | 21d | 1 | 1.47mi |
| 13105 Vanderbilt Dr Naples, FL | 2.0 | 2.0 | 1390 | $5,450 | $3.92 | 23d | 2 | 1.47mi |
HOA detail condo
- Monthly dues
- $633 · $7,596/yr
- Likely covers
- waterpool
- Assessments
- None detected in remarks — confirm with the listing agent.
Listing history 2 events
-
2026-06-03remarks 699-char remark
-
2026-06-03$249,000 Pending 325 DOM
ⓘ Source: listings_history table (triggers on properties + properties_extension) + one-shot
backfill from property_details.listing_events for pre-trigger history.
Climate risk First Street
- Flood 7/10 Severe FEMA zone X (shaded) · 96% chance over 30 yrs
- Wildfire 3/10 Moderate
- Heat 10/10 Extreme 8 d/yr ≥107°F today · 34 d/yr by 30 yrs out
- Wind 10/10 Extreme 99% chance of damaging wind over 30 yrs
- Air quality 2/10 Low 1 unhealthy d/yr today · 1 by 30 yrs out
Nearby sold comps map
Loading sold comps map…
Walkable amenities ~0.75 mi
Loading nearby amenities…
Taxation est. · year 1
- Rental income
- $54,662
- − Mortgage interest
- −$13,948
- − Property taxes
- −$3,735
- − Insurance
- −$2,042
- − Repairs & maintenance
- −$4,373
- − Management
- −$4,373
- − HOA
- −$7,596
- − Depreciation
- −$7,244
- Taxable income
- $11,351
- Est. tax owed @ 24.0%
- −$2,724
- After-tax cash flow
- $11,416/yr
For passive investors: Depreciation is non-cash, so a rental often shows a tax loss while cash-flowing — sheltering income. Rental losses are passive: they offset passive income freely, and up to $25,000/yr can offset ordinary (W-2) income if you actively participate and your MAGI is under $100k (phasing out to $0 by $150k); unused losses carry forward. On sale, claimed depreciation is recaptured at up to 25%, and gains may owe capital-gains tax (a 1031 exchange can defer both). Figures are a year-1 estimate at your 24.0% rate — not tax advice; consult a CPA.
Condition & rehab AI · 13 photos
This well-maintained and move-in-ready condo offers a good condition with a good condition score of 75. The home has a good roof, exterior, flooring, interior walls/paint, windows, foundation/structure, HVAC/mechanicals, and landscaping/curb appeal. The home is in good condition and ready for a new owner.
Value-add opportunities
- Resale Painting the exterior walls — Fresh paint can enhance the curb appeal and make the home more attractive to potential buyers
- Both Landscaping improvements — Enhanced landscaping can improve the curb appeal and increase the home's rental value
Renovation cost estimate screening
Value-add ROI direction
- Resale Painting the exterior walls — Fresh paint can enhance the curb appeal and make the home more attractive to potential buyers ↑
- Both Landscaping improvements — Enhanced landscaping can improve the curb appeal and increase the home's rental value ↑
ⓘ Cost ranges are severity-bucket heuristics (US national rule-of-thumb). Get contractor quotes + a written scope before underwriting a rehab budget.
Schools (NCES district)
- District
- Collier
- NCES district ID
- 1200330
- Math proficiency
- 60% ▼ -4.00%
- Reading proficiency
- 56% ▼ -2.00%
- Median HH income
- $58,275
- Composite
- 50.23/100
- National rank
- #1892
- State rank
- #16 of 73 in FL
Livability — Naples Park
- Score
- 64/100
- State rank
- #696
- US rank
- #14564
Category grades
Schools grade is shown separately in the Schools card above.
Census & demographics
- County
- Collier County · 396,295 people
- Metro
- Naples-Marco Island, FL
- Population (ZIP)
- 25,630
- Household income
- $97,564
- Rent vs Own
- Severe rent burden
- 1006.0
Population outlook (Collier County) Hauer SSP2
- Today (2025)
- 420,858 people
- By 2030
- 450,054 · +6.9%
- By 2040
- 502,232 · +19.3%
- By 2050
- 544,932 · +29.5%
- By 2075
- 627,203 · +49.0%
- By 2100
- 659,015 · +56.6%
Race, ethnicity, and origin ACS 2023
- Neighborhood character
- Predominantly White (84%)
- Race & ethnicity
- White 84% Hispanic / Latino 10% Two or more races 9% Asian 2% Black 1%
- Hispanic origin (detail)
- Mexican 2% Puerto Rican 1% Cuban 3%
- Common ancestry
- Romanian 4% Lithuanian 3% Slovak 2%
- Foreign-born
- 11% · Canada, South Korea
- Languages at home
- 87% English-only · Spanish 7% Other Indo-European 3% French/Haitian/Cajun 1%
Political lean MEDSL · Collier
- 2024 margin
- Solid R (+33.1) · D 33.1% · R 66.2%
- 2008→2024 swing
- -10.6pp toward R · 2008: -22.5pp · 2024: -33.1pp
- All cycles
- 2024: R+33.1 2020: R+24.7 2016: R+26.0 2012: R+30.1 2008: R+22.5
Not yet ingested
- Civics
- —
Market trends
- HPI YoY
- ▼ -172.68%
- Current HPI
- 267.4644
- Rent YoY
- ▼ -1.06%
- Metro
- Naples-Marco Island, FL
- State GDP YoY
- ▲ 3.28%
- F500 in state
- 36
Industry mix (Fortune 500 HQ in FL)
| Industry | F500 HQs | Revenue |
|---|---|---|
| Industrial Technology | 2 | $29B |
|
||
| Insurance | 2 | $17B |
|
||
| Retail | 1 | $60B |
|
||
| Technology Distribution | 1 | $58B |
|
||
| Homebuilding | 1 | $35B |
|
||
| Technology Manufacturing | 1 | $35B |
|
||
Price history
-15.6% since first listed6 events — show timeline
- 2026-05-08 Pending — NAPLESMLS
- 2026-05-07 Pending — NAPLESMLS
- 2026-04-23 Price Changed $249,000 NAPLESMLS
- 2026-03-03 Price Changed $259,900 NAPLESMLS
- 2025-11-21 Price Changed $274,900 NAPLESMLS
- 2025-06-16 Listed $295,000 NAPLESMLS
Cash-flow waterfall
monthlySold comps — $/sqft
last 12 mo · ≤1 miLoading sold comps…