7610 159th St E #150 · South Hill, WA
Flood risk 4/10 · Minor
- FEMA flood zone
- X (unshaded)
- Chance of flooding over 30 yrs
- 0.22%
- Est. flood insurance / yr
- $507 – $1,088
Fire risk 1/10 · Minimal
- Est. fire insurance / yr
- $604 – $1,122
Heat risk 3/10 · Minor
- Hot days now (above 87°F)
- 7 days/yr
- Hot days in 30 yrs
- 15 days/yr
Wind risk 1/10 · Minimal
- Chance of severe wind over 30 yrs
- —
Air-quality risk 7/10 · Major
- Unhealthy air days now
- 10 days/yr
- Unhealthy air days in 30 yrs
- 10 days/yr
Risk factors via First Street. Map © Google.
Why this score? — see what drove the A- grade
The composite is a weighted blend of 9 inputs, each scored 0–100. Each bar is that input's sub-score; the figure is the points it added to the 100-point composite (weight × sub-score).
- Cash flow +30.0/30.0
- ARV discount +15.0/15.0
- 1% rule +10.0/10.0
- DSCR +10.0/10.0
- Schools +5.4/10.0
- Livability +4.0/5.0
- Rent growth +3.2/5.0
- Condition / age +2.5/5.0
- Appreciation +0.0/10.0
$169,950
🖨 Deal sheet (PDF) 📄 Offer letter ✓ Due diligence
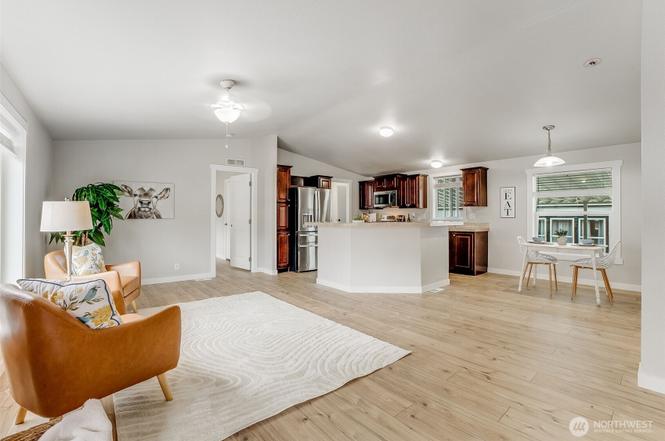
Listing remarks
Beautifully updated and move-in ready home located in this all-ages community of Well Care Manufactured Home Park in Puyallup! This refreshed home features brand new vinyl plank flooring, new carpet, fresh interior paint, and updated baseboards, creating a bright and welcoming feel throughout. Residents of the community enjoy secured mailboxes, a playground, and a clubhouse available for private parties, gatherings, and special events — adding to the welcoming neighborhood atmosphere. The monthly park fee also includes the septic fee for added convenience and value. Conveniently located near shopping, dining, parks, and commuter routes, this home offers the perfect balance of peaceful
Key facts
- New carpet
- Updated home
- Fresh interior paint
Tags
Property features AI
Finance
- Other: Buyer to verify schools
- Financial info: Land lease: $1,150; Listing terms: Cash or Conventional
- HOA & community: Located in a manufactured home park (Hidden Glenn) with approximately 193 homes; Park amenities include clubhouse, common area, exercise room, playground, and recreational area; Park approved for sale
Exterior
- Parking: Carport
- Utilities: Electric energy source; Community water (billed through park); Power by Elmhurst; Sewer: (not specified)
- Home design: Manufactured double-wide home (Fleetwood ORE 527185); One level; Good condition
- Construction: Cement construction materials; Composition roof
- Exterior features: Cement/concrete exterior; Cul-de-sac lot; Paved access; Has a view
Interior
- Kitchen: Dishwasher; Microwave; Refrigerator; Stove/Range
- Bedrooms: 3 bedrooms
- Flooring: Vinyl plank; Carpet
- Bathrooms: 2 full bathrooms (2 bathtubs, 2 showers)
- Heating & cooling: Forced air heating; No cooling
- Interior features: Water heater; Bath off primary; Patio/porch/deck
- Laundry & utility: Utility room; Electric water heater located in the laundry room; Storage behind home
Neighborhood map
What this means for you Summary
Snapshot
- This is a 3-bed/2.0-bath manufactured listed at $170k.
Deal economics
- At list price, monthly cash flow is $1k ($13k/yr) — positive.
- The deal already cash-flows at list — no discount required.
- Meets the 1% rule at list price ($3k rent vs $170k).
- Cap rate 13.7% vs local median 3.0% in South Hill — top-decile yield for the area; either an underpriced asset or a hidden risk that comps aren't pricing in. Stress-test before assuming the spread holds.
Location & tenants
- Location reads 80/100 on livability (#84 in WA, #1,620 nationally) — a professional / high-income tenant draw. Strengths: employment A+, housing A+, health & safety A+; Watch: crime C-, schools D+, cost of living F.
- Puyallup School District (suburban): math 53% / reading 66% proficiency, ranked #52 of 291 in WA (top 18%) — acceptable for families but not a draw, mixed tenant base, ~2y average lease.
- Market conditions: Rents rising (+2.8%/yr); 283 active listings in the ZIP; 16 comparable units currently listed for rent nearby; rentals at typical pace (median 16d on market — plan ~3-4 weeks tenant-placement turnaround); high-income renter base; 3,209 units permitted in Pierce County in 2024 (1,269 in 5+ unit buildings).
Forward outlook
- Local home prices are declining (-3.0%/yr); year-one equity from $1k of loan paydown is wiped out by about $5k of value loss. Plan a longer hold.
- Pierce County population projected at +26% by 2050 — long-run rental-demand tailwind backs the buy-and-hold thesis.
- At projected returns (-3.0% appreciation + 2.8% rent growth), your $48k cash investment doubles in ~5 years — after that, you're playing with house money.
Negotiation context
- Only 7 days on market — expect competitive offers; lowballing is unlikely to land.
- 2 sale attempts since 20y ago with the ask held roughly flat each time — persistent listings suggest the price (not the market) is what's stuck; bring a comps-based counter.
- Current owner paid $20k; list at $170k implies a 737% gain — meaningful room to come down on a strong offer.
Questions for the listing agent
- Is there a deadline driving the sale (1031 exchange, divorce, estate, relocation)? That informs how much negotiation room exists.
- Schools are D-rated, which usually means shorter tenancies and higher turnover. Who's the typical renter profile here, and what's been the actual vacancy rate?
- What's the average days-on-market for RENTAL listings here right now (not sales)? A rising rental-DOM trend means longer vacancies and softer asking-rent achievability than the comps imply.
- What's the recent tenant-quality profile in this submarket — average credit score on applications, eviction rate, late-payment / NSF rate, and stable-employment percentage? A property-management company in the area should have these aggregated.
- How much new for-sale + rental construction is in the pipeline within 1–3 miles? Heavy new supply typically softens prices + rents 12–24 months out; constrained supply supports both.
Investment metrics
- 1% rule
- 1.61% ✓
- Cap rate
- 13.72%
- Cash-on-cash
- 26.54%
- DSCR
- 2.18
- GRM
- 5.2
CMA / ARV
- ARV (on-the-fly)
- $270,936
- Comps found
- 9
Show comp detail 9 sales within ~0.75 mi
| Address | Dist | Beds/Ba | Sqft | Sold | Price | $/sf | Match |
|---|---|---|---|---|---|---|---|
| 15807 78th Avenue Ct E | 0.20mi | 3/2.0 | 1,296 (+2%) | 11mo | $425,000 | $328 | 78 |
| 7706 158th Ct Ct E #132 | 0.12mi | 3/2.0 | 1,294 (+2%) | 16mo | $136,000 | $105 | 78 |
| 15605 79th Ave E | 0.31mi | 3/2.0 | 1,200 (-6%) | 7mo | $350,000 | $292 | 70 |
| 15801 85th Ave E | 0.61mi | 3/2.0 | 1,280 (+1%) | 0mo | $449,500 | $351 | 70 |
| 7409 156th Street Ct E Unit E-2 | 0.22mi | 3/1.0 | 1,224 (-4%) | 24mo | $75,000 | $61 | 60 |
| 7309 155th St E #2 | 0.32mi | 3/2.0 | 1,456 (+14%) | 2mo | $75,000 | $52 | 59 |
| 8417 166th Street Ct E | 0.71mi | 3/2.0 | 1,296 (+2%) | 9mo | $385,000 | $297 | 56 |
| 7313 155th St E #1 | 0.32mi | 3/2.0 | 1,104 (-13%) | 12mo | $149,950 | $136 | 53 |
| 15801 81st Ave Ct E #71 | 0.38mi | 2/2.0 (-1) | 1,432 (+13%) | 16mo | $305,000 | $213 | 42 |
Match score weights: distance 35% · size 25% · config 20% · recency 20%. Top-matched comps best support the ARV.
Projected returns pro-forma
-3.0% appreciation · 2.79% rent growth · sell at horizon
- IRR
- 20.1%
- Equity multiple
- 1.82×
- Total profit
- $38,920
- Equity at exit
- $25,340
- IRR
- 28.2%
- Equity multiple
- 3.48×
- Total profit
- $117,854
- Equity at exit
- $14,694
Cash invested: $47,586 (down + closing). Projections, not guarantees.
Landlord ↔ Tenant lean methodology
- Overall (STATE)
- 28 Tenant-Leaning
- State Washington
- 28 Tenant-Leaning · D+8
- County
- — inherits STATE
- City
- — inherits STATE
ZIP-level market 98375
- Rents YoY
- 2.8%
- Active inventory
- 283
- Price-to-rent
- 5.2×
Monthly cashflow live
- Estimated rent
- $2,733 high interval (Pro) →
- Mortgage (P&I)
- −$891
- Tax from tax record
- −$145 /mo · $1,738/yr
- Insurance
- −$71
- HOA
- −$0
- Vacancy / Maint / Mgmt
- −$574
- Net cashflow
- $1,053
Break-even live
Sensitivity live
| Price | -10% $1,149 | -5% $1,101 | +0% $1,053 | +5% $1,004 | +10% $956 |
|---|---|---|---|---|---|
| Rent | -10% $837 | -5% $945 | +0% $1,053 | +5% $1,160 | +10% $1,268 |
| Rate | -1.0pp $1,138 | -0.5pp $1,096 | base $1,053 | +0.5pp $1,008 | +1.0pp $964 |
UW: 25.0% down · 7.5% · 30yr · 1.5% tax · 5.0% vac · 8.0% maint · 8.0% mgmt
Financing live
Cash to close
- Down payment
- $42,488
- Closing costs
- $5,098
- Reserves months
- —
- Total cash needed
- —
Loan-product check · same deal, 3 products live
Conventional
25% down · 7.5% · 30yr
- Down + closing
- —
- Monthly P&I
- —
- Monthly cashflow
- —
- DSCR
- —
- Eligible?
- —
Personal DTI + credit; lowest rate.
DSCR
20% down · 8.5% · 30yr
- Down + closing
- —
- Monthly P&I
- —
- Monthly cashflow
- —
- DSCR
- —
- Eligible?
- —
No personal income docs; deal must DSCR.
Hard money
10% down · 12.0% · 12mo
- Down + closing
- —
- Monthly P&I
- —
- Monthly cashflow
- —
- DSCR
- —
- Eligible?
- —
Short-term bridge; refi at stabilization.
Rent comps 16 comps
| Address | Beds | Baths | Sqft | Rent | $/sqft | DOM | Units | Dist |
|---|---|---|---|---|---|---|---|---|
| 16216 and16218 72nd Avenue Ct E Puyallup, WA | 3.0 | 2.5 | 1500 | $2,480 | $1.65 | 24d | 1 | 0.28mi |
| 7104 163rd St E Puyallup, WA | 3.0 | 2.0 | 1260 | $2,800 | $2.22 | 24d | 1 | 0.36mi |
| 15012 71st Ave E South Hill, WA | 3.0 | 1.5 | 1200 | $2,300 | $1.92 | 2d | 1 | 0.67mi |
| 15010 71st Ave E Unit S168-12 Puyallup, WA | 3.0 | 1.5 | 1200 | $2,300 | $1.92 | 2d | 1 | 0.67mi |
| 15502 87th Ave E Unit 15502 South Hill, WA | 3.0 | 2.0 | 1300 | $2,495 | $1.92 | 24d | 1 | 0.75mi |
| 15623 90th Avenue Ct E Puyallup, WA | 3.0 | 2.0 | 1286 | $3,065 | $2.38 | 12d | 1 | 0.93mi |
| 15623 90th Avenue Ct E Puyallup, WA | 4.0 | 2.0 | 1286 | $3,065 | $2.38 | 13d | 1 | 0.93mi |
| 7513 177th Street Ct E Puyallup, WA | 1.0–4.0 | 1.0–2.5 | 1243 | $2,940 | $2.37 | 10d | 7 | 1.06mi |
| 8345 175th Street Ct E Puyallup, WA | 2.0 | 2.5 | 1588 | $2,300 | $1.45 | 13d | 1 | 1.08mi |
| 17814 75th Ave E Puyallup, WA | 2.0 | 1.5 | 1064 | $2,295 | $2.16 | 21d | 1 | 1.19mi |
| 17908 72nd Ave E Puyallup, WA | 3.0 | 2.5 | 1719 | $1,400 | $0.81 | 24d | 1 | 1.23mi |
| 17718 85th Avenue Ct E Unit 17718-C Puyallup, WA | 2.0 | 1.5 | 916 | $1,525 | $1.66 | 22d | 1 | 1.25mi |
| 9530 160th Street Ct E Puyallup, WA | 2.0–3.0 | 2.5 | 1284 | $2,550 | $1.99 | 13d | 1 | 1.26mi |
| 9611 161st St E Puyallup, WA | 2.0 | 2.5 | 1150 | $2,200 | $1.91 | 15d | 1 | 1.27mi |
| 97th Ave E Puyallup, WA | 3.0 | 2.5 | 1452 | $2,495 | $1.72 | 24d | 1 | 1.41mi |
| 9921 158th St E Puyallup, WA | 2.0 | 1.0 | 1100 | $2,400 | $2.18 | 13d | 1 | 1.48mi |
Listing history 7 events
-
2026-06-18days on market $169,950 Active 7 DOM
-
2026-06-17days on market $169,950 Active 6 DOM
-
2026-06-16days on market $169,950 Active 5 DOM
-
2026-06-15days on market $169,950 Active 4 DOM
-
2026-06-13days on market $169,950 Active 2 DOM
-
2026-06-13remarks 693-char remark
-
2026-06-13$169,950 Active 1 DOM
ⓘ Source: listings_history table (triggers on properties + properties_extension) + one-shot
backfill from property_details.listing_events for pre-trigger history.
Tax reassessment forecast WA · Resets to sale price
- Current annual tax
- $1,738 · $145/mo
- Projected year-2 tax
- $1,738 · $145/mo
- Expected delta
- $0/yr ($0/mo · 0.0%)
ⓘ Screening estimate from a state-policy table — verify with the county assessor before closing.
Climate risk First Street
- Flood 4/10 Moderate FEMA zone X (unshaded) · 22% chance over 30 yrs
- Wildfire 1/10 Low
- Heat 3/10 Moderate 7 d/yr ≥87°F today · 15 d/yr by 30 yrs out
- Wind 1/10 Low
- Air quality 7/10 Severe 10 unhealthy d/yr today · 10 by 30 yrs out
Nearby sold comps map
Loading sold comps map…
Walkable amenities ~0.75 mi
Loading nearby amenities…
Taxation est. · year 1
- Rental income
- $32,802
- − Mortgage interest
- −$9,520
- − Property taxes
- −$1,738
- − Insurance
- −$850
- − Repairs & maintenance
- −$2,624
- − Management
- −$2,624
- − Depreciation
- −$4,944
- Taxable income
- $10,501
- Est. tax owed @ 24.0%
- −$2,520
- After-tax cash flow
- $10,110/yr
For passive investors: Depreciation is non-cash, so a rental often shows a tax loss while cash-flowing — sheltering income. Rental losses are passive: they offset passive income freely, and up to $25,000/yr can offset ordinary (W-2) income if you actively participate and your MAGI is under $100k (phasing out to $0 by $150k); unused losses carry forward. On sale, claimed depreciation is recaptured at up to 25%, and gains may owe capital-gains tax (a 1031 exchange can defer both). Figures are a year-1 estimate at your 24.0% rate — not tax advice; consult a CPA.
Schools (NCES district)
- District
- Puyallup School District
- NCES district ID
- 5306960
- Math proficiency
- 53% ▬ 0.00%
- Reading proficiency
- 66% ▬ 0.00%
- Median HH income
- $68,291
- Composite
- 54.01/100
- National rank
- #3006
- State rank
- #52 of 291 in WA
Livability — South Hill
- Score
- 80/100
- State rank
- #84
- US rank
- #1620
Category grades
Schools grade is shown separately in the Schools card above.
Census & demographics
- Census place
- South Hill, WA
- County
- Pierce County · 788,257 people
- City population
- 76,707
- Metro
- Seattle-Tacoma-Bellevue, WA
- Population (ZIP)
- 31,187
- Household income
- $117,074
- Rent vs Own
- Severe rent burden
- 541.0
Population outlook (Pierce County) Hauer SSP2
- Today (2025)
- 956,648 people
- By 2030
- 1,010,862 · +5.7%
- By 2040
- 1,113,170 · +16.4%
- By 2050
- 1,206,524 · +26.1%
- By 2075
- 1,436,425 · +50.2%
- By 2100
- 1,563,654 · +63.5%
Race, ethnicity, and origin ACS 2023
- Neighborhood character
- Diverse neighborhood (Simpson 0.64)
- Race & ethnicity
- White 57% Two or more races 22% Hispanic / Latino 13% Black 8% Asian 6% Pacific Islander 1%
- Hispanic origin (detail)
- Mexican 10% Puerto Rican 1%
- Common ancestry
- Portuguese 3% Lithuanian 3% Italian 3%
- Foreign-born
- 11% · Canada, China, South Korea
- Languages at home
- 82% English-only · Spanish 8% Other Indo-European 2% Other Asian/Pacific 2%
Political lean MEDSL · Pierce
- 2024 margin
- D (+10.8) · D 53.9% · R 43.1% · Other 3.0%
- 2008→2024 swing
- -1.4pp toward R · 2008: 12.2pp · 2024: 10.8pp
- All cycles
- 2024: D+10.8 2020: D+11.2 2016: D+7.5 2012: D+11.0 2008: D+12.2
Not yet ingested
- Civics
- —
Market trends
- HPI YoY
- ▼ -189.98%
- Current HPI
- 285.0074
- Rent YoY
- ▲ 2.79%
- Metro
- Seattle-Tacoma-Bellevue, WA
- State GDP YoY
- ▲ 4.65%
- F500 in state
- 22
Industry mix (Fortune 500 HQ in WA)
| Industry | F500 HQs | Revenue |
|---|---|---|
| Retail | 2 | $269B |
|
||
| Technology / Retail | 1 | $638B |
|
||
| Technology | 1 | $245B |
|
||
| Telecommunications | 1 | $38B |
|
||
| Food / Beverage | 1 | $36B |
|
||
| Automotive / Trucks | 1 | $34B |
|
||
Price history
+750.0% since first listed3 events — show timeline
- 2026-06-04 Listed $169,950 NWMLS as Distributed by MLS Grid
- 2006-12-20 Sold (MLS) $20,295 NWMLS as Distributed by MLS Grid
- 2006-08-29 Listed $19,995 NWMLS as Distributed by MLS Grid
Property tax history
+7.8%/yrLatest (2026): $1,738 · +4.4% YoY. Source: county tax records.
Cash-flow waterfall
monthlySold comps — $/sqft
last 12 mo · ≤1 miLoading sold comps…