 Multi-family
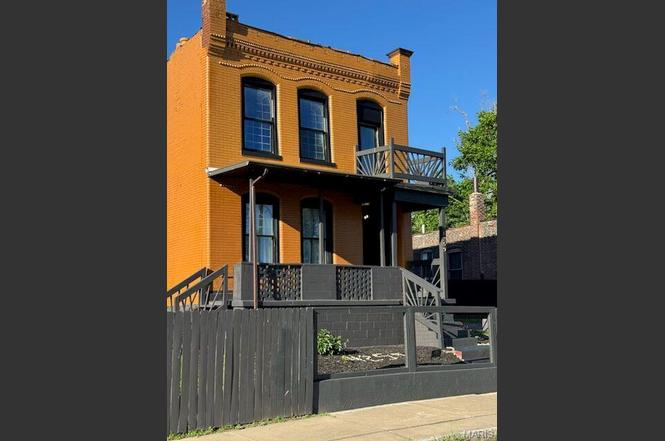
4259 W Cote Brilliante Ave · St. Louis, MO
Flood risk 1/10 · Minimal
- FEMA flood zone
- X (unshaded)
- Chance of flooding over 30 yrs
- 0.0%
- Est. flood insurance / yr
- $473 – $860
Fire risk 1/10 · Minimal
- Est. fire insurance / yr
- $1,054 – $1,958
Heat risk 5/10 · Moderate
- Hot days now (above 107°F)
- 7 days/yr
- Hot days in 30 yrs
- 20 days/yr
Wind risk 2/10 · Minimal
- Chance of severe wind over 30 yrs
- 1.0%
Air-quality risk 4/10 · Minor
- Unhealthy air days now
- 5 days/yr
- Unhealthy air days in 30 yrs
- 6 days/yr
Risk factors via First Street. Map © Google.
Why this score? — see what drove the B grade
The composite is a weighted blend of 9 inputs, each scored 0–100. Each bar is that input's sub-score; the figure is the points it added to the 100-point composite (weight × sub-score).
- Cash flow +30.0/30.0
- 1% rule +10.0/10.0
- DSCR +10.0/10.0
- ARV discount +7.5/15.0
- Appreciation +3.9/10.0
- Rent growth +2.5/5.0
- Livability +2.5/5.0
- Condition / age +2.5/5.0
- Schools +1.2/10.0
$235,000
🖨 Deal sheet (PDF) 📄 Offer letter ✓ Due diligence
Multi-family units
County records classify this as Multi-Family (2-4 Unit). Listing-text estimate: 1 unit. estimate disagrees with records
Listing remarks MLS
ATTENTION LANDLORDS AND INVESTORS!!! This Home Will Not Last Long!!! Potential Investment Opportunity!!! Check out this duplex that has been converted to a single family residence. This property boast over 2,600 square feet, with 4 bedrooms, and 2 full baths at a great low price!! This asset is LOADED with Potential! Bring your Great Ideas and Call It Yours! SCHEDULE YOUR SHOWING TODAY!!! Seller's Disclosure statement is not available. Special Sale Contract (form #2043) required. Must have a pre-qualification letter or proof of funds prior to considering the potential buyer' s offer. The following verbiage must be added to all offers, Pursuant to paragraph 28 of the Real Estate Purchase Addendum, this document is subject to all terms and conditions set forth in the Real Estate Purchase Addendum. Buyer is responsible for all title company fees. Property is subject to HUD Guidelines 24 CFR 206.125.
Key facts
- Fenced yard
- Private balcony
- Finished basement
Tags
Property features AI
Finance
- Financial info: Lease not considered
Exterior
- Utilities: Public water; Public sewer; Electric service by Ameren; Cable available
- Home design: Single-family residence; Residential property; Two levels
- Construction: Brick construction
- Exterior features: Covered front porch; Balcony; Private yard; Back yard and front yard; Level lot with some trees
Interior
- Kitchen: Stainless steel appliances
- Bedrooms: 5 bedrooms total; 1 bedroom on the main level; 4 bedrooms on the upper level
- Flooring: Laminate
- Bathrooms: 2 full bathrooms; 1 half bathroom; 1 full bathroom on the main level; 1 full bathroom on the upper level; 1 half bathroom on the lower level
- Heating & cooling: Forced air heating (natural gas); Central air conditioning
- Interior features: Updated/remodeled condition; Stainless steel appliances; Laminate flooring; Full basement
- Laundry & utility: Basement provides utility/storage space
Neighborhood map
What this means for you Summary
Snapshot
- This is a 5-bed/2.0-bath multifamily listed at $235k.
Deal economics
- At list price, monthly cash flow is $3k ($37k/yr) — positive.
- The deal already cash-flows at list — no discount required.
- Meets the 1% rule at list price ($6k rent vs $235k).
- Cap rate 22.0% vs local median 5.0% in St. Louis — top-decile yield for the area; either an underpriced asset or a hidden risk that comps aren't pricing in. Stress-test before assuming the spread holds.
Location & tenants
- Location reads: area grade B — affects rentability + tenant quality, not the cash-flow math above.
- St. Louis City (urban): math 10% / reading 18% proficiency, ranked #312 of 324 in MO (top 96%) — low school quality limits family demand, transient renter base, plan for 1-2y turnover; 80% free/reduced lunch — lower-income household profile, screen leases tightly.
- Zoned schools: Sumner High (math 2% / reading 2%, grade F, #520 of 521 statewide, top 100%, 264 students, 99% FRL) — zoned schools average 99% FRL vs 80% district-wide (18 pts higher); higher-poverty schools than district average — tighter screening recommended.
- Market conditions: 58 active listings in the ZIP; 1 comparable units currently listed for rent nearby; 294 units permitted in St. Louis city in 2024 (227 in 5+ unit buildings).
Forward outlook
- Local home prices are declining (-2.1%/yr); year-one equity from $2k of loan paydown is wiped out by about $5k of value loss. Plan a longer hold.
- St. Louis County population projected to shrink 6% by 2050 — rents likely to lag national; underwrite the cash flow, not the appreciation.
- At projected returns (-2.1% appreciation + 3.0% rent growth), your $66k cash investment doubles in ~2 years — after that, you're playing with house money.
Negotiation context
- Only 6 days on market — expect competitive offers; lowballing is unlikely to land.
- 2 sale attempts since 12y ago with the ask held roughly flat each time — persistent listings suggest the price (not the market) is what's stuck; bring a comps-based counter.
Risks & watch-outs
- Watch-outs: built in 1904 — expect roof / HVAC / electrical / plumbing capex.
- Climate carrying-cost: extreme-heat days projected 7→20/yr by 2055 (HVAC capex compounding) — expect insurance premiums to compound above CPI over the hold.
Questions for the listing agent
- Built in 1904 — when were the roof, HVAC, electrical panel, plumbing, and water heater last replaced?
- Is there a deadline driving the sale (1031 exchange, divorce, estate, relocation)? That informs how much negotiation room exists.
- What's the average days-on-market for RENTAL listings here right now (not sales)? A rising rental-DOM trend means longer vacancies and softer asking-rent achievability than the comps imply.
- What's the recent tenant-quality profile in this submarket — average credit score on applications, eviction rate, late-payment / NSF rate, and stable-employment percentage? A property-management company in the area should have these aggregated.
- How much new apartment / multifamily construction is in the pipeline within 1–3 miles? Heavy new supply (>2% of stock underway) typically softens rents 12–24 months out; light construction supports rent growth.
Investment metrics
- 1% rule
- 2.53% ✓
- Cap rate
- 22.00%
- Cash-on-cash
- 56.11%
- DSCR
- 3.50
- GRM
- 3.3
CMA / ARV
- ARV (on-the-fly)
- $68,380
- Comps found
- 5
Show comp detail 5 sales within ~0.75 mi
| Address | Dist | Beds/Ba | Sqft | Sold | Price | $/sf | Match |
|---|---|---|---|---|---|---|---|
| 4258 East St Louis Ave | 0.44mi | 4/2.0 (-1) | 2,850 (+8%) | 1mo | $55,000 | $19 | 60 |
| 3932 Cook Ave | 0.69mi | 4/— (-1) | 2,736 (+4%) | 4mo | $70,000 | $26 | 53 |
| 3843 Saint Ferdinand Ave | 0.72mi | 6/2.0 (+1) | 2,788 (+6%) | 1mo | $325,000 | $117 | 51 |
| 3860 Evans Ave | 0.72mi | 5/2.0 | 2,596 (-1%) | 22mo | $39,900 | $15 | 46 |
| 4123 Labadie Ave | 0.61mi | 4/2.0 (-1) | 2,460 (-6%) | 11mo | $125,000 | $51 | 46 |
Match score weights: distance 35% · size 25% · config 20% · recency 20%. Top-matched comps best support the ARV.
Projected returns pro-forma
-2.14% appreciation · 3.0% rent growth · sell at horizon
- IRR
- 55.4%
- Equity multiple
- 3.53×
- Total profit
- $166,466
- Equity at exit
- $44,097
- IRR
- 59.7%
- Equity multiple
- 7.16×
- Total profit
- $405,163
- Equity at exit
- $36,223
Cash invested: $65,800 (down + closing). Projections, not guarantees.
Landlord ↔ Tenant lean methodology
- Overall (STATE)
- 81 Strongly Landlord-Friendly
- State Missouri
- 81 Strongly Landlord-Friendly · R+10
- County
- — inherits STATE
- City
- — inherits STATE
ZIP-level market 63113
- Home prices YoY
- -2.0%
- Active inventory
- 58
- Price-to-rent
- 3.3×
Monthly cashflow live
- Estimated rent
- $5,950 medium interval (Pro) →
- Mortgage (P&I)
- −$1,232
- Tax est. 1.5%
- −$294 /mo · $3,525/yr
- Insurance
- −$98
- HOA
- −$0
- Vacancy / Maint / Mgmt
- −$1,250
- Net cashflow
- $3,076
Break-even live
Sensitivity live
| Price | -10% $3,239 | -5% $3,158 | +0% $3,076 | +5% $2,995 | +10% $2,914 |
|---|---|---|---|---|---|
| Rent | -10% $2,606 | -5% $2,841 | +0% $3,076 | +5% $3,311 | +10% $3,547 |
| Rate | -1.0pp $3,195 | -0.5pp $3,136 | base $3,076 | +0.5pp $3,016 | +1.0pp $2,954 |
UW: 25.0% down · 7.5% · 30yr · 1.5% tax · 5.0% vac · 8.0% maint · 8.0% mgmt
Financing live
Cash to close
- Down payment
- $58,750
- Closing costs
- $7,050
- Reserves months
- —
- Total cash needed
- —
Loan-product check · same deal, 3 products live
Conventional
25% down · 7.5% · 30yr
- Down + closing
- —
- Monthly P&I
- —
- Monthly cashflow
- —
- DSCR
- —
- Eligible?
- —
Personal DTI + credit; lowest rate.
DSCR
20% down · 8.5% · 30yr
- Down + closing
- —
- Monthly P&I
- —
- Monthly cashflow
- —
- DSCR
- —
- Eligible?
- —
No personal income docs; deal must DSCR.
Hard money
10% down · 12.0% · 12mo
- Down + closing
- —
- Monthly P&I
- —
- Monthly cashflow
- —
- DSCR
- —
- Eligible?
- —
Short-term bridge; refi at stabilization.
Rent comps 1 comps
| Address | Beds | Baths | Sqft | Rent | $/sqft | DOM | Units | Dist |
|---|---|---|---|---|---|---|---|---|
| 4388 McPherson Ave Saint Louis, MO | 6.0 | 2.5 | 2698 | $5,950 | $2.21 | 44d | 1 | 1.07mi |
Listing history 6 events
-
2026-06-18days on market $235,000 Active 6 DOM
-
2026-06-17days on market $235,000 Active 5 DOM
-
2026-06-16days on market $235,000 Active 4 DOM
-
2026-06-15days on market $235,000 Active 3 DOM
-
2026-06-13remarks 693-char remark
-
2026-06-13$235,000 Active 1 DOM
ⓘ Source: listings_history table (triggers on properties + properties_extension) + one-shot
backfill from property_details.listing_events for pre-trigger history.
Climate risk First Street
- Flood 1/10 Low FEMA zone X (unshaded) · 0% chance over 30 yrs
- Wildfire 1/10 Low
- Heat 5/10 Major 7 d/yr ≥107°F today · 20 d/yr by 30 yrs out
- Wind 2/10 Low 100% chance of damaging wind over 30 yrs
- Air quality 4/10 Moderate 5 unhealthy d/yr today · 6 by 30 yrs out
Nearby sold comps map
Loading sold comps map…
Walkable amenities ~0.75 mi
Loading nearby amenities…
Taxation est. · year 1
- Rental income
- $71,400
- − Mortgage interest
- −$13,164
- − Property taxes
- −$3,525
- − Insurance
- −$1,175
- − Repairs & maintenance
- −$5,712
- − Management
- −$5,712
- − Depreciation
- −$6,836
- Taxable income
- $35,276
- Est. tax owed @ 24.0%
- −$8,466
- After-tax cash flow
- $28,451/yr
For passive investors: Depreciation is non-cash, so a rental often shows a tax loss while cash-flowing — sheltering income. Rental losses are passive: they offset passive income freely, and up to $25,000/yr can offset ordinary (W-2) income if you actively participate and your MAGI is under $100k (phasing out to $0 by $150k); unused losses carry forward. On sale, claimed depreciation is recaptured at up to 25%, and gains may owe capital-gains tax (a 1031 exchange can defer both). Figures are a year-1 estimate at your 24.0% rate — not tax advice; consult a CPA.
Schools (NCES district)
- District
- St. Louis City
- NCES district ID
- 2929280
- Math proficiency
- 10% ▼ -6.00%
- Reading proficiency
- 18% ▼ -3.00%
- Median HH income
- $35,685
- Composite
- 11.54/100
- National rank
- #9699
- State rank
- #312 of 324 in MO
Livability — St. Louis
No livability data for this city. (Only ~50 U.S. cities are tracked.)
Census & demographics
- Census place
- St. Louis, MO
- City population
- 283,259
- Population (ZIP)
- 11,610
Population outlook (St. Louis County) Hauer SSP2
- Today (2025)
- 315,737 people
- By 2030
- 313,865 · -0.6%
- By 2040
- 305,439 · -3.3%
- By 2050
- 296,529 · -6.1%
- By 2075
- 271,028 · -14.2%
- By 2100
- 255,359 · -19.1%
Race, ethnicity, and origin ACS 2023
- Neighborhood character
- Predominantly Black (91%)
- Race & ethnicity
- Black 91% White 6% Two or more races 2% Hispanic / Latino 1%
- Foreign-born
- 2% · Canada
Political lean MEDSL · St. Louis
- 2024 margin
- Solid D (+64.7) · D 81.4% · R 16.7% · Other 2.0%
- 2008→2024 swing
- -3.5pp toward R · 2008: 68.2pp · 2024: 64.7pp
- All cycles
- 2024: D+64.7 2020: D+66.2 2016: D+63.7 2012: D+66.6 2008: D+68.2
Not yet ingested
- Civics
- —
Market trends
- HPI YoY
- ▼ -2.14%
- Current HPI
- 107.1335
- Rent YoY
- —
- Metro
- —
- State GDP YoY
- ▲ 1.84%
- F500 in state
- 20
Industry mix (Fortune 500 HQ in MO)
| Industry | F500 HQs | Revenue |
|---|---|---|
| Healthcare | 1 | $163B |
|
||
| Insurance | 1 | $21B |
|
||
| Industrial Technology | 1 | $17B |
|
||
| Retail | 1 | $16B |
|
||
| Industrial Distribution | 1 | $10B |
|
||
| Utilities | 1 | $9B |
|
||
Price history
+6614.3% since first listed5 events — show timeline
- 2026-06-12 Listed $235,000 MARIS as Distributed by MLS Grid
- 2014-07-31 Sold (MLS) — MARIS as Distributed by MLS Grid
- 2014-06-27 Listed $3,500 MARIS as Distributed by MLS Grid
- 2014-06-23 Sold (Public Records) — Public Records
- 1990-07-25 Sold (Public Records) — Public Records
Property tax history
-0.4%/yrLatest (2024): $229 · +4.5% YoY. Source: county tax records.
Cash-flow waterfall
monthlySold comps — $/sqft
last 12 mo · ≤1 miLoading sold comps…