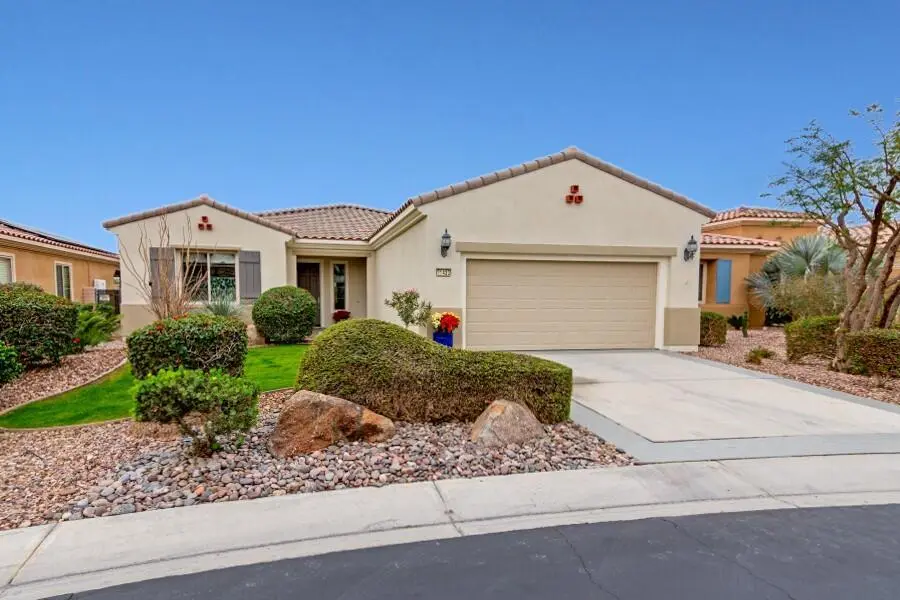
81433 Camino Los Milagros · Indio, CA
Flood risk 1/10 · Minimal
- FEMA flood zone
- D
- Chance of flooding over 30 yrs
- 0.0%
- Est. flood insurance / yr
- $544 – $1,084
Fire risk 6/10 · Moderate
- Est. fire insurance / yr
- $659 – $1,223
Heat risk 10/10 · Severe
- Hot days now (above 114°F)
- 7 days/yr
- Hot days in 30 yrs
- 17 days/yr
Wind risk 1/10 · Minimal
- Chance of severe wind over 30 yrs
- —
Air-quality risk 4/10 · Minor
- Unhealthy air days now
- 6 days/yr
- Unhealthy air days in 30 yrs
- 7 days/yr
Risk factors via First Street. Map © Google.
Why this score? — see what drove the D grade
The composite is a weighted blend of 9 inputs, each scored 0–100. Each bar is that input's sub-score; the figure is the points it added to the 100-point composite (weight × sub-score).
- ARV discount +14.4/15.0
- Cash flow +7.5/30.0
- Rent growth +5.0/5.0
- Schools +3.8/10.0
- 1% rule +3.6/10.0
- Livability +2.7/5.0
- Condition / age +2.5/5.0
- DSCR +1.6/10.0
- Appreciation +0.0/10.0
$429,900
🖨 Deal sheet (PDF) 📄 Offer letter ✓ Due diligence
Listing remarks
Back on Market, Buyer unable to perform, Subject to cancelation of Escrow. Lovely Avalino Model with Santa Rosa Mountain Peek View! Highly Sought after Del Webb Sun City Shadow Hills for Active Adult Living at its Best! Enjoy Resort Style amenities, Clubs, Vibrant Social Life including Performing Arts, Concerts, Movies in the Park, & So Much More. Two Clubhouses, Two Fitness Centers, Pools, Spas, 8 Pickleball courts, Plus Tennis! Two Golf Courses, Putting Greens & Driving Range, miles of Walking Trails! Move in Ready. .. New Interior Paint in Soft soothing Neutral color tones! You'll appreciate this Open & Inviting floor plan which is Great for Entertaining & Relaxat
Key facts
- Covered patio
- Large walk in pantry
- 6,534 sq ft lot
Tags
Property features AI
Finance
- Other: Senior community; Directions: Enter at Jefferson main gate, follow Sun City Blvd to right on Camino Los Milagros
- HOA & community: Monthly HOA fee of $398; HOA includes clubhouse; Community amenities: clubhouse, fitness center, card room, billiard room, banquet facilities, recreation room, tennis courts, paddle tennis, bocce ball court, other courts, pickle ball courts, lake/pond, par-3 golf course, golf course within development, greenbelt/park, dog park, community mailbox
Exterior
- Parking: Driveway; Attached garage
- Security: Gated community; Community security system (owned)
- Utilities: Water supplied by Indio Water (water district); Sewer connected and paid; Cable TV available; PUD: Yes
- Home design: Spanish-style single family home; One story; Front door faces north; leisure areas face south; Detached
- Construction: Stucco exterior; Concrete roof; Slab foundation (and other); Built by Del Webb (model: Avalino)
- Exterior features: Backyard with private, landscaped, level yard; Covered concrete patio; Block fencing; Sprinkler system with timer; No interior steps (disability access); Community and gated with security system owned
Interior
- Kitchen: Granite counters; Island; Pantry / Walk-in pantry; Gas cooktop; Convection oven; Range hood; Dishwasher; Refrigerator; Exhaust fan; Water line to refrigerator; Breakfast counter/bar; Dining area
- Bedrooms: Master suite with walk-in closet
- Flooring: Carpet; Ceramic tile
- Bathrooms: 2 full bathrooms; Shower and tub
- Heating & cooling: Central heating (forced air); Natural gas heating; Central air conditioning; Ceiling fans
- Interior features: High ceilings (9 ft+); Recessed lighting; Open floorplan; Sliding doors; Blinds; Ground-level entry with no steps; Unfurnished
- Laundry & utility: Washer and dryer; Laundry in an individual room; Hot water circulator; Gas
Neighborhood map
What this means for you Summary
Snapshot
- This is a 2-bed/2.0-bath single-family listed at $430k.
Deal economics
- At list price, monthly cash flow is $-538 ($-6k/yr) — negative.
- To cash-flow at today's rent, offer at most $335k (22.1% below list).
- To meet the 1% rule (rent ≥ 1% of price), the offer needs to be $368k (14.4% below list).
- Recommended offer: $335k (22.1% below list) — sets the bar for cash-flow.
Location & tenants
- Location reads 53/100 on livability (#927 in CA) — a working-class tenant base; expect higher turnover. Strengths: housing B+; Watch: employment D, crime F, amenities F.
- Desert Sands Unified (suburban): math 31% / reading 56% proficiency, ranked #199 of 517 in CA (top 38%) — families likely to look elsewhere, expect single-tenant / working-renter base with shorter leases.
- Zoned schools: Ronald Reagan Elementary (834 students, 53% FRL); Desert Ridge Academy (math 24% / reading 75%, grade C, #98 of 498 statewide, top 21%, 1,030 students, 81% FRL); Shadow Hills High (math 30% / reading 53%, grade F, #498 of 1,170 statewide, top 43%, 1,751 students, 77% FRL).
- Market conditions: Rents rising fast (+11.6%/yr); 447 active listings in the ZIP; 40 comparable units currently listed for rent nearby; rentals lingering (median 46d on market — plan ~5-8 weeks vacancy on turnover, expect pricing pressure); 65% of comp listings sitting > 30 days — soft ceiling on asking rent; solid renter incomes; 9,195 units permitted in Riverside County in 2024 (1,512 in 5+ unit buildings).
- At $3,680/mo this rent would consume 45% of the median local household income ($97k/yr) (locally 565% of renters already pay >50% of income on rent) — very limited rent-growth headroom before tenants either downsize or default.
Forward outlook
- Local home prices are declining (-3.0%/yr); year-one equity from $3k of loan paydown is wiped out by about $13k of value loss. Plan a longer hold.
- Riverside County population projected at +22% by 2050 — long-run rental-demand tailwind backs the buy-and-hold thesis.
Negotiation context
- Only 11 days on market — expect competitive offers; lowballing is unlikely to land.
- 4 sale attempts with the ask held roughly flat each time — persistent listings suggest the price (not the market) is what's stuck; bring a comps-based counter.
Risks & watch-outs
- Climate carrying-cost: major wildfire risk; extreme-heat days projected 7→17/yr by 2055 (HVAC capex compounding) — expect insurance premiums to compound above CPI over the hold.
Questions for the listing agent
- What do current leases actually rent for vs. the listed asking? Can we see a recent rent roll and the last 12 months of T-12 income?
- What does the HOA fee cover, when was the last increase, and are there any pending special assessments or reserve-fund shortfalls?
- Is there a deadline driving the sale (1031 exchange, divorce, estate, relocation)? That informs how much negotiation room exists.
- Schools are F-rated, which usually means shorter tenancies and higher turnover. Who's the typical renter profile here, and what's been the actual vacancy rate?
- Crime grade is F in this area — have there been break-ins, vandalism, or insurance claims at this property in the last 3 years? What carrier currently insures it and at what premium?
- The area grade is low — what's the realistic commute time and amenity access for the typical tenant pool here? Any planned neighborhood developments (good or bad) we should know about?
- What's the average days-on-market for RENTAL listings here right now (not sales)? A rising rental-DOM trend means longer vacancies and softer asking-rent achievability than the comps imply.
- What's the recent tenant-quality profile in this submarket — average credit score on applications, eviction rate, late-payment / NSF rate, and stable-employment percentage? A property-management company in the area should have these aggregated.
- How much new for-sale + rental construction is in the pipeline within 1–3 miles? Heavy new supply typically softens prices + rents 12–24 months out; constrained supply supports both.
Investment metrics
- 1% rule
- 0.86% ✗
- Cap rate
- 4.79%
- Cash-on-cash
- -5.36%
- DSCR
- 0.76
- GRM
- 9.7
CMA / ARV
- ARV (median comp)
- $507,858
- List price
- $429,900
- Delta
- -15.35%
- Verdict
- UNDERPRICED
- Comps
- 20 within 1.0 mi
Show comp detail 12 sales within ~0.75 mi
| Address | Dist | Beds/Ba | Sqft | Sold | Price | $/sf | Match |
|---|---|---|---|---|---|---|---|
| 81411 Camino Los Milagros | 0.02mi | 2/2.0 | 1,763 (0%) | 2mo | $484,500 | $275 | 97 |
| 81521 Camino Los Milagros | 0.09mi | 2/2.0 | 1,763 (0%) | 4mo | $524,900 | $298 | 93 |
| 81406 Camino Los Milagros | 0.04mi | 2/2.0 | 1,854 (+5%) | 1mo | $525,000 | $283 | 88 |
| 40554 Calle Balderas | 0.21mi | 2/2.0 | 1,763 (0%) | 3mo | $489,000 | $277 | 88 |
| 81624 Camino Fuerte | 0.24mi | 2/2.0 | 1,763 (0%) | 1mo | $525,000 | $298 | 88 |
| 81750 camino fuerte | 0.37mi | 2/2.0 | 1,763 (0%) | 2mo | $425,000 | $241 | 81 |
| 40147 Calle Ebano | 0.42mi | 2/2.0 | 1,763 (0%) | 1mo | $440,000 | $250 | 80 |
| 40155 Calle Loma Entrada | 0.42mi | 2/2.0 | 1,763 (0%) | 3mo | $538,000 | $305 | 78 |
| 81450 Avenida Altamira | 0.46mi | 2/2.0 | 1,763 (0%) | 1mo | $450,000 | $255 | 77 |
| 81591 Camino Los Milagros | 0.17mi | 3/2.0 (+1) | 1,900 (+8%) | 3mo | $579,000 | $305 | 71 |
| 81025 Avenida Lorena | 0.43mi | 2/2.0 | 1,854 (+5%) | 2mo | $475,000 | $256 | 70 |
| 81193 Avenida Tres Lagunas | 0.48mi | 2/2.0 | 1,854 (+5%) | 1mo | $495,000 | $267 | 68 |
Match score weights: distance 35% · size 25% · config 20% · recency 20%. Top-matched comps best support the ARV.
Projected returns pro-forma
-3.0% appreciation · 8.0% rent growth · sell at horizon
- IRR
- -19.0%
- Equity multiple
- 0.30×
- Total profit
- $-84,124
- Equity at exit
- $64,099
- IRR
- -2.7%
- Equity multiple
- 0.77×
- Total profit
- $-27,442
- Equity at exit
- $37,170
Cash invested: $120,372 (down + closing). Projections, not guarantees.
Landlord ↔ Tenant lean methodology
- Overall (STATE)
- 18 Strongly Tenant-Friendly
- State California
- 18 Strongly Tenant-Friendly · D+13
- County
- — inherits STATE
- City
- — inherits STATE
ZIP-level market 92203
- Home prices YoY
- -25.0%
- Rents YoY
- 11.6%
- Active inventory
- 447
- Price-to-rent
- 9.7×
Monthly cashflow live
- Estimated rent
- $3,680 high interval (Pro) →
- Mortgage (P&I)
- −$2,254
- Tax from tax record
- −$613 /mo · $7,361/yr
- Insurance
- −$179
- HOA
- −$398
- Vacancy / Maint / Mgmt
- −$773
- Net cashflow
- $-538
Break-even live
Sensitivity live
| Price | -10% $-295 | -5% $-416 | +0% $-538 | +5% $-660 | +10% $-781 |
|---|---|---|---|---|---|
| Rent | -10% $-829 | -5% $-683 | +0% $-538 | +5% $-393 | +10% $-247 |
| Rate | -1.0pp $-321 | -0.5pp $-429 | base $-538 | +0.5pp $-649 | +1.0pp $-763 |
UW: 25.0% down · 7.5% · 30yr · 1.5% tax · 5.0% vac · 8.0% maint · 8.0% mgmt
Financing live
Cash to close
- Down payment
- $107,475
- Closing costs
- $12,897
- Reserves months
- —
- Total cash needed
- —
Loan-product check · same deal, 3 products live
Conventional
25% down · 7.5% · 30yr
- Down + closing
- —
- Monthly P&I
- —
- Monthly cashflow
- —
- DSCR
- —
- Eligible?
- —
Personal DTI + credit; lowest rate.
DSCR
20% down · 8.5% · 30yr
- Down + closing
- —
- Monthly P&I
- —
- Monthly cashflow
- —
- DSCR
- —
- Eligible?
- —
No personal income docs; deal must DSCR.
Hard money
10% down · 12.0% · 12mo
- Down + closing
- —
- Monthly P&I
- —
- Monthly cashflow
- —
- DSCR
- —
- Eligible?
- —
Short-term bridge; refi at stabilization.
Rent comps 40 comps
| Address | Beds | Baths | Sqft | Rent | $/sqft | DOM | Units | Dist |
|---|---|---|---|---|---|---|---|---|
| 41085 Calle Pampas Indio, CA | 2.0 | 2.0 | 1488 | $2,700 | $1.81 | 45d | 1 | 0.08mi |
| 81520 Camino Los Milagros Indio, CA | 3.0 | 3.0 | 2010 | $5,700 | $2.84 | 45d | 1 | 0.10mi |
| 81562 Camino Los Milagros Indio, CA | 3.0 | 3.0 | 2112 | $6,000 | $2.84 | 45d | 1 | 0.14mi |
| 79-131 Sangria Ct Indio, CA | 3.0 | 2.0 | 2018 | $3,500 | $1.73 | 45d | 1 | 0.15mi |
| 81579 Avenida Contento Indio, CA | 2.0 | 2.0 | 1257 | $4,600 | $3.66 | 45d | 1 | 0.15mi |
| 81566 Avenida Sombra Indio, CA | 2.0 | 2.0 | 1763 | $2,245 | $1.27 | 7d | 1 | 0.24mi |
| 81710 Avenida Parito Indio, CA | 2.0 | 2.0 | 1488 | $2,700 | $1.81 | 16d | 1 | 0.30mi |
| 81720 Avenida Parito Indio, CA | 2.0 | 2.0 | 1257 | $2,600 | $2.07 | 45d | 1 | 0.31mi |
| 81673 Avenida Alturas Indio, CA | 2.0 | 2.0 | 1432 | $2,700 | $1.89 | 45d | 1 | 0.31mi |
| 81126 Avenida Lorena Indio, CA | 3.0 | 3.0 | 2112 | $6,000 | $2.84 | 26d | 1 | 0.35mi |
| 81656 Avenida de Baile Indio, CA | 2.0 | 2.0 | 1488 | $4,300 | $2.89 | 45d | 1 | 0.35mi |
| 81543 Avenida Celaya Indio, CA | 3.0 | 3.0 | 1700 | $3,500 | $2.06 | 45d | 1 | 0.37mi |
| 40856 Calle Desierto Indio, CA | 3.0 | 3.0 | 2112 | $2,500 | $1.18 | 25d | 1 | 0.41mi |
| 81876 Camino Los Milagros Indio, CA | 3.0 | 3.0 | 2014 | $7,500 | $3.72 | 45d | 1 | 0.47mi |
| 81916 Avenida del Toro Indio, CA | 2.0 | 2.0 | 1257 | $2,600 | $2.07 | 45d | 1 | 0.49mi |
| 40759 Calle Guapo Indio, CA | 2.0 | 2.0 | 1488 | $4,500 | $3.02 | 45d | 1 | 0.49mi |
| 40087 Corte Azul Indio, CA | 2.0 | 2.0 | 1763 | $2,800 | $1.59 | 18d | 1 | 0.53mi |
| 81919 Avenida Bienvenida Indio, CA | 2.0 | 1.5 | 1488 | $2,500 | $1.68 | 45d | 1 | 0.53mi |
| 40799 Calle Los Osos Indio, CA | 2.0 | 2.0 | 1257 | $3,900 | $3.10 | 45d | 1 | 0.54mi |
| 40751 Calle Los Osos Indio, CA | 2.0 | 2.0 | 1257 | $2,500 | $1.99 | 45d | 1 | 0.54mi |
| 81083 Avenida Tres Lagunas Indio, CA | 2.0 | 2.5 | 2230 | $3,600 | $1.61 | 45d | 1 | 0.58mi |
| 81968 Avenida Bienvenida Indio, CA | 2.0 | 2.0 | 1488 | $2,750 | $1.85 | 45d | 1 | 0.59mi |
| 81968 Avenida Dulce Indio, CA | 2.0 | 2.0 | 1257 | $4,500 | $3.58 | 45d | 1 | 0.68mi |
| 81968 Avenida Dulce Indio, CA | 2.0 | 2.0 | 1257 | $5,000 | $3.98 | 7d | 1 | 0.68mi |
| 81098 Avenida Vidrio Indio, CA | 2.0 | 2.0 | 1295 | $4,000 | $3.09 | 45d | 1 | 0.68mi |
| 80741 Avenida Santa Carmen Indio, CA | 3.0 | 2.0 | 2147 | $5,000 | $2.33 | 45d | 1 | 0.71mi |
| 41444 Via Arleta Indio, CA | 2.0 | 2.0 | 1374 | $2,500 | $1.82 | 26d | 1 | 0.71mi |
| 41544 Via Arleta Indio, CA | 2.0 | 2.0 | 1374 | $2,500 | $1.82 | 26d | 1 | 0.73mi |
| 80818 Avenida San Ignacio Indio, CA | 3.0 | 3.0 | 2376 | $5,500 | $2.31 | 7d | 1 | 0.73mi |
| 80818 Avenida San Ignacio Indio, CA | 3.0 | 2.5 | 2376 | $5,500 | $2.31 | 45d | 1 | 0.73mi |
| 41562 Via Arleta Indio, CA | 2.0 | 2.0 | 1276 | $2,800 | $2.19 | 26d | 1 | 0.73mi |
| 41424 Trumble Ct Indio, CA | 3.0 | 2.0 | 1886 | $3,950 | $2.09 | 0d | 1 | 0.76mi |
| 80635 Camino Santa Elise Indio, CA | 3.0 | 2.5 | 2376 | $5,450 | $2.29 | 45d | 1 | 0.80mi |
| 80592 Avenida Santa Carmen Indio, CA | 2.0 | 2.5 | 1753 | $2,700 | $1.54 | 45d | 1 | 0.85mi |
| 80598 Camino Santa Juliana Indio, CA | 3.0 | 2.0 | 1920 | $2,888 | $1.50 | 26d | 1 | 0.85mi |
| 81363 Corte Compras Indio, CA | 2.0 | 2.0 | 1512 | $4,300 | $2.84 | 45d | 1 | 0.86mi |
| 80586 Camino Santa Juliana Indio, CA | 2.0 | 2.0 | 2147 | $4,500 | $2.10 | 45d | 1 | 0.86mi |
| 39310 Calle Popoca Indio, CA | 2.0 | 2.0 | 1321 | $2,950 | $2.23 | 26d | 1 | 0.86mi |
| 80646 Avenida San Ignacio Indio, CA | 3.0 | 2.5 | 2376 | $6,600 | $2.78 | 45d | 1 | 0.87mi |
| 81778 Avenida Estuco Indio, CA | 2.0 | 3.0 | 1952 | $3,200 | $1.64 | 16d | 1 | 0.88mi |
HOA detail
- Monthly dues
- $398 · $4,776/yr
- Likely covers
- poolgym
Listing history 23 events
-
2026-06-21days on market $429,900 Active 11 DOM
-
2026-06-18days on market $429,900 Active 8 DOM
-
2026-06-17days on market $429,900 Active 7 DOM
-
2026-06-16days on market $429,900 Active 6 DOM
-
2026-06-15days on market $429,900 Active 5 DOM
-
2026-06-13days on market $429,900 Active 3 DOM
-
2026-06-09days on market $429,900 Active 172 DOM
-
2026-06-08days on market $429,900 Active 171 DOM
-
2026-06-07days on market $429,900 Active 170 DOM
-
2026-06-04days on market $429,900 Active 167 DOM
-
2026-06-03days on market $429,900 Active 166 DOM
-
2026-06-02days on market $429,900 Active 165 DOM
-
2026-06-01days on market $429,900 Active 164 DOM
-
2026-05-31days on market $429,900 Active 163 DOM
-
2026-05-19historical Active Under Contract 1186-char remark
-
2026-04-29price $424,900 1186-char remark
-
2026-04-29status Active 1186-char remark
-
2026-04-28historical Active Under Contract 1186-char remark
-
2026-04-27price $427,000 1186-char remark
-
2026-04-21price $424,900 1186-char remark
-
2026-02-07price $429,000 1186-char remark
-
2025-12-19$449,000 Active 1186-char remark
-
2025-12-10historical $449,000 1186-char remark
ⓘ Source: listings_history table (triggers on properties + properties_extension) + one-shot
backfill from property_details.listing_events for pre-trigger history.
Tax reassessment forecast CA · Resets to sale price
- Current annual tax
- $7,361 · $613/mo
- Projected year-2 tax
- $7,361 · $613/mo
- Expected delta
- $0/yr ($0/mo · 0.0%)
ⓘ Screening estimate from a state-policy table — verify with the county assessor before closing.
Climate risk First Street
- Flood 1/10 Low FEMA zone D · 0% chance over 30 yrs
- Wildfire 6/10 Major
- Heat 10/10 Extreme 7 d/yr ≥114°F today · 17 d/yr by 30 yrs out
- Wind 1/10 Low
- Air quality 4/10 Moderate 6 unhealthy d/yr today · 7 by 30 yrs out
Nearby sold comps map
Loading sold comps map…
Walkable amenities ~0.75 mi
Loading nearby amenities…
Taxation est. · year 1
- Rental income
- $44,159
- − Mortgage interest
- −$24,081
- − Property taxes
- −$7,361
- − Insurance
- −$2,150
- − Repairs & maintenance
- −$3,533
- − Management
- −$3,533
- − HOA
- −$4,776
- − Depreciation
- −$12,506
- Taxable loss
- −$13,780
- Est. tax savings @ 24.0%
- +$3,307
- After-tax cash flow
- $-3,147/yr
For passive investors: Depreciation is non-cash, so a rental often shows a tax loss while cash-flowing — sheltering income. Rental losses are passive: they offset passive income freely, and up to $25,000/yr can offset ordinary (W-2) income if you actively participate and your MAGI is under $100k (phasing out to $0 by $150k); unused losses carry forward. On sale, claimed depreciation is recaptured at up to 25%, and gains may owe capital-gains tax (a 1031 exchange can defer both). Figures are a year-1 estimate at your 24.0% rate — not tax advice; consult a CPA.
Schools (NCES district)
- District
- Desert Sands Unified
- NCES district ID
- 0611110
- Math proficiency
- 31% ▼ -4.00%
- Reading proficiency
- 56% ▲ 7.00%
- Median HH income
- $54,957
- Composite
- 37.77/100
- National rank
- #4346
- State rank
- #199 of 517 in CA
Livability — Indio
- Score
- 53/100
- State rank
- #927
- US rank
- #24244
Category grades
Schools grade is shown separately in the Schools card above.
Census & demographics
- Census place
- Indio, CA
- County
- Riverside County · 2,287,001 people
- City population
- 100,560
- Metro
- Riverside-San Bernardino-Ontario, CA
- Population (ZIP)
- 34,735
- Household income
- $97,311
- Rent vs Own
- Severe rent burden
- 565.0
Population outlook (Riverside County) Hauer SSP2
- Today (2025)
- 2,664,475 people
- By 2030
- 2,802,692 · +5.2%
- By 2040
- 3,050,904 · +14.5%
- By 2050
- 3,256,783 · +22.2%
- By 2075
- 3,655,058 · +37.2%
- By 2100
- 3,766,594 · +41.4%
Race, ethnicity, and origin ACS 2023
- Neighborhood character
- Diverse neighborhood (Simpson 0.57)
- Race & ethnicity
- Hispanic / Latino 51% White 41% Two or more races 29% Asian 3% Black 2%
- Hispanic origin (detail)
- Mexican 48%
- Common ancestry
- Italian 3% Lithuanian 2% Romanian 2%
- Foreign-born
- 14% · Canada
- Languages at home
- 64% English-only · Spanish 33% Tagalog/Filipino 1% Other Indo-European 1%
Political lean MEDSL · Riverside
- 2024 margin
- Toss-up / Even · D 48.0% · R 49.3% · Other 2.6%
- 2008→2024 swing
- -3.6pp toward R · 2008: 2.3pp · 2024: -1.3pp
- All cycles
- 2024: R+1.3 2020: D+8.0 2016: D+4.3 2012: R+0.4 2008: D+2.3
Not yet ingested
- Civics
- —
Market trends
- HPI YoY
- ▼ -98.51%
- Current HPI
- 295.6456
- Rent YoY
- ▲ 11.64%
- Metro
- Riverside-San Bernardino-Ontario, CA
- State GDP YoY
- ▲ 3.21%
- F500 in state
- 116
Industry mix (Fortune 500 HQ in CA)
| Industry | F500 HQs | Revenue |
|---|---|---|
| Technology | 27 | $1,492B |
|
||
| Financial Services | 3 | $174B |
|
||
| Retail | 3 | $44B |
|
||
| Insurance | 3 | $26B |
|
||
| Media / Entertainment | 2 | $115B |
|
||
| Pharmaceuticals / Biotech | 2 | $62B |
|
||
Price history
-4.3% since first listed13 events — show timeline
- 2026-06-10 Listing Removed — GPSMLS
- 2026-06-10 Listed $429,900 GPSMLS
- 2026-05-29 Price Changed $429,900 GPSMLS
- 2026-05-29 Relisted — GPSMLS
- 2026-05-19 Contingent — GPSMLS
- 2026-04-29 Price Changed $424,900 GPSMLS
- 2026-04-29 Relisted — GPSMLS
- 2026-04-28 Contingent — GPSMLS
- 2026-04-27 Price Changed $427,000 GPSMLS
- 2026-04-21 Price Changed $424,900 GPSMLS
- 2026-02-07 Price Changed $429,000 GPSMLS
- 2025-12-19 Listed $449,000 GPSMLS
- 2025-12-10 Coming Soon — GPSMLS
Property tax history
+3.2%/yrLatest (2025): $7,361 · +2.8% YoY. Source: county tax records.
Cash-flow waterfall
monthlySold comps — $/sqft
last 12 mo · ≤1 miLoading sold comps…