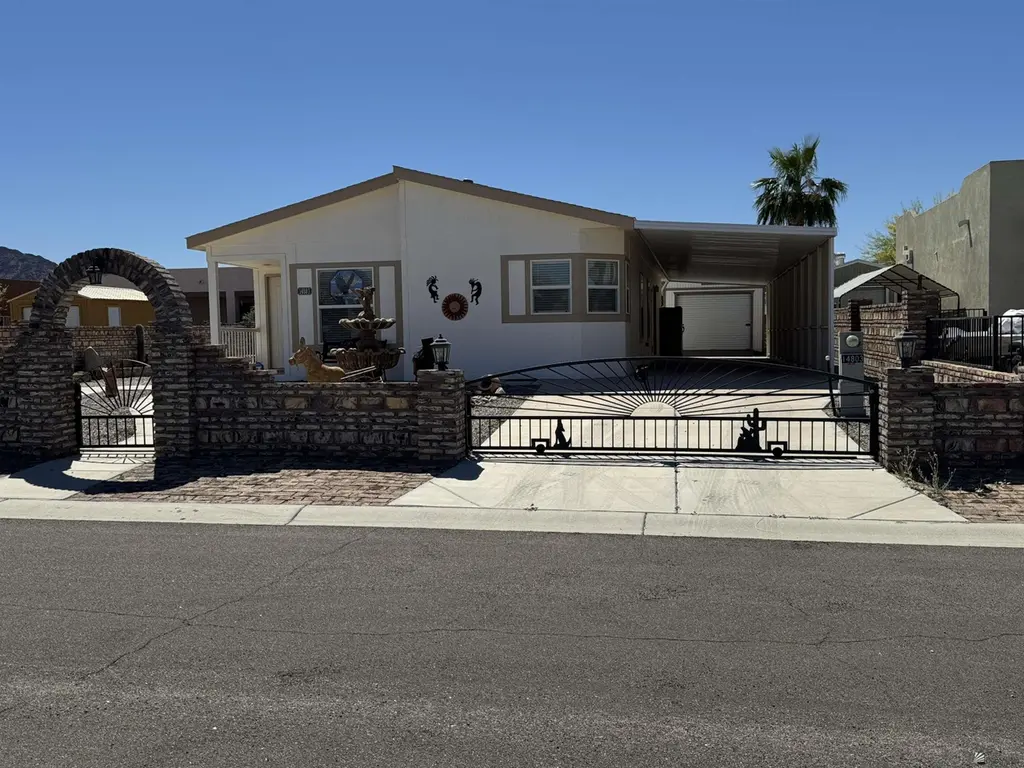
14803 E 50 Dr · Fortuna Foothills, AZ
Flood risk 1/10 · Minimal
- FEMA flood zone
- X (unshaded)
- Chance of flooding over 30 yrs
- 0.0%
- Est. flood insurance / yr
- $507 – $1,088
Fire risk 4/10 · Minor
- Est. fire insurance / yr
- $610 – $1,132
Heat risk 9/10 · Severe
- Hot days now (above 111°F)
- 6 days/yr
- Hot days in 30 yrs
- 17 days/yr
Wind risk 1/10 · Minimal
- Chance of severe wind over 30 yrs
- —
Air-quality risk 2/10 · Minimal
- Unhealthy air days now
- 1 days/yr
- Unhealthy air days in 30 yrs
- 2 days/yr
Risk factors via First Street. Map © Google.
Why this score? — see what drove the D+ grade
The composite is a weighted blend of 9 inputs, each scored 0–100. Each bar is that input's sub-score; the figure is the points it added to the 100-point composite (weight × sub-score).
- Cash flow +16.1/30.0
- ARV discount +13.7/15.0
- DSCR +5.0/10.0
- Rent growth +3.6/5.0
- 1% rule +3.4/10.0
- Livability +3.0/5.0
- Condition / age +2.5/5.0
- Schools +1.3/10.0
- Appreciation +0.0/10.0
$279,900
🖨 Deal sheet (PDF) 📄 Offer letter ✓ Due diligence
Listing remarks
Back on the market through no fault of the owner!!! Buyers contingency fell through!!!!Welcome to this well maintained, one owner home located on a quiet street just one block from the desert in one of the most desirable foothills neighborhoods. Offering plenty of space for RV parking, recreational vehicles, and additional toys, this property is ideal for those who value both comfort and outdoor living. The open floor plan is perfect for entertaining, while each bedroom features a walk in closet. The home is being sold furnished, making it a truly turn key opportunity and ready for its new owners.
Key facts
- Quiet street
- Open floor plan
- Rv parking
Tags
Property features AI
Finance
- HOA & community: Curbs (community feature)
Exterior
- Parking: 3 parking spaces total; 2 covered spaces; 1 attached garage space; Attached carport with 2 carport spaces; Detached parking; RV access/parking
- Security: Smoke detector(s)
- Utilities: Public water; Private sewer
- Home design: Manufactured home; Residential property
- Construction: Mobile home / manufactured construction
- Exterior features: RV hookup; Shed(s); Paved road access; Has view; Curbs
Interior
- Kitchen: Disposal; Refrigerator; Microwave; Dishwasher; Gas range
- Flooring: Carpet; Other
- Bathrooms: 2 full bathrooms
- Heating & cooling: Heating; Cooling
- Interior features: Blinds, window treatments and drapes; Smoke detector(s); Basement
- Laundry & utility: Washer; Dryer
Neighborhood map
What this means for you Summary
Snapshot
- This is a 3-bed/2.0-bath manufactured listed at $280k.
Deal economics
- At list price, monthly cash flow is $144 ($2k/yr) — positive.
- The deal already cash-flows at list — no discount required.
- To meet the 1% rule (rent ≥ 1% of price), the offer needs to be $234k (16.2% below list).
- Recommended offer: $234k (16.2% below list) — sets the bar for 1% rule.
- Cap rate 6.9% vs local median 4.2% in Fortuna Foothills — top-decile yield for the area; either an underpriced asset or a hidden risk that comps aren't pricing in. Stress-test before assuming the spread holds.
Location & tenants
- Location reads 60/100 on livability (#174 in AZ) — a middle-class / working-renter tenant base. Strengths: cost of living A+, housing A+; Watch: employment C-, crime F, amenities F.
- Yuma Union High School District (4507) (urban): math 14% / reading 16% proficiency, ranked #212 of 249 in AZ (top 85%) — low school quality limits family demand, transient renter base, plan for 1-2y turnover.
- Zoned schools: Gila Ridge High School (math 13% / reading 17%, grade F, #263 of 381 statewide, top 70%, 2,309 students, 55% FRL).
- Market conditions: Rents rising fast (+4.5%/yr); 415 active listings in the ZIP; 4 comparable units currently listed for rent nearby; rentals at typical pace (median 15d on market — plan ~3-4 weeks tenant-placement turnaround); 1,399 units permitted in Yuma County in 2024 (180 in 5+ unit buildings).
- At $2,345/mo this rent would consume 48% of the median local household income ($58k/yr) (locally 408% of renters already pay >50% of income on rent) — very limited rent-growth headroom before tenants either downsize or default.
Forward outlook
- Local home prices are declining (-3.0%/yr); year-one equity from $2k of loan paydown is wiped out by about $8k of value loss. Plan a longer hold.
- Yuma County population projected at +4% by 2050 — modest demand growth; plan on rents tracking national, not racing it.
Negotiation context
- It's been on market 85 days — a 6% lower offer ($263k) is reasonable based on typical stale-listing flexibility.
- Current owner paid $54k; list at $280k implies a 418% gain — meaningful room to come down on a strong offer.
Risks & watch-outs
- Climate carrying-cost: extreme-heat days projected 6→17/yr by 2055 (HVAC capex compounding) — expect insurance premiums to compound above CPI over the hold.
Questions for the listing agent
- It's been on market 85 days. Have you received any prior offers? Is the seller open to a 16% concession, seller financing, or rate buy-down credit?
- Why hasn't it sold? Are there any deal-killer items the seller is aware of (foundation, flood, title, zoning, code violations)?
- Is there a deadline driving the sale (1031 exchange, divorce, estate, relocation)? That informs how much negotiation room exists.
- Schools are F-rated, which usually means shorter tenancies and higher turnover. Who's the typical renter profile here, and what's been the actual vacancy rate?
- Crime grade is F in this area — have there been break-ins, vandalism, or insurance claims at this property in the last 3 years? What carrier currently insures it and at what premium?
- The area grade is low — what's the realistic commute time and amenity access for the typical tenant pool here? Any planned neighborhood developments (good or bad) we should know about?
- What's the average days-on-market for RENTAL listings here right now (not sales)? A rising rental-DOM trend means longer vacancies and softer asking-rent achievability than the comps imply.
- What's the recent tenant-quality profile in this submarket — average credit score on applications, eviction rate, late-payment / NSF rate, and stable-employment percentage? A property-management company in the area should have these aggregated.
- How much new for-sale + rental construction is in the pipeline within 1–3 miles? Heavy new supply typically softens prices + rents 12–24 months out; constrained supply supports both.
Investment metrics
- 1% rule
- 0.84% ✗
- Cap rate
- 6.91%
- Cash-on-cash
- 2.21%
- DSCR
- 1.10
- GRM
- 9.9
CMA / ARV
- ARV (on-the-fly)
- $324,220
- Comps found
- 8
Show comp detail 8 sales within ~0.75 mi
| Address | Dist | Beds/Ba | Sqft | Sold | Price | $/sf | Match |
|---|---|---|---|---|---|---|---|
| 13414 S Chisolm Way | 0.29mi | 3/2.0 | 1,505 (-0%) | 1mo | $265,000 | $176 | 85 |
| 14615 E 50 St | 0.25mi | 3/2.0 | 1,456 (-3%) | 5mo | $320,000 | $220 | 79 |
| 14463 E 53 Ln | 0.57mi | 3/2.0 | 1,456 (-3%) | 9mo | $350,000 | $240 | 60 |
| 14538 E 50 St | 0.32mi | 3/2.0 | 1,377 (-9%) | 13mo | $260,000 | $189 | 59 |
| 14553 E 50 St | 0.33mi | 3/2.5 | 1,357 (-10%) | 13mo | $291,500 | $215 | 56 |
| 14502 E 50 St | 0.37mi | 2/2.0 (-1) | 1,322 (-12%) | 9mo | $285,000 | $216 | 50 |
| 14313 E 49 St | 0.63mi | 3/2.0 | 1,642 (+9%) | 13mo | $305,000 | $186 | 45 |
| 14348 E 49 Dr | 0.57mi | 2/2.5 (-1) | 1,560 (+3%) | 24mo | $305,000 | $196 | 41 |
Match score weights: distance 35% · size 25% · config 20% · recency 20%. Top-matched comps best support the ARV.
Projected returns pro-forma
-3.0% appreciation · 4.46% rent growth · sell at horizon
- IRR
- -11.4%
- Equity multiple
- 0.58×
- Total profit
- $-32,763
- Equity at exit
- $41,734
- IRR
- -0.4%
- Equity multiple
- 0.97×
- Total profit
- $-2,329
- Equity at exit
- $24,201
Cash invested: $78,372 (down + closing). Projections, not guarantees.
Landlord ↔ Tenant lean methodology
- Overall (STATE)
- 87 Strongly Landlord-Friendly
- State Arizona
- 87 Strongly Landlord-Friendly · R+3
- County
- — inherits STATE
- City
- — inherits STATE
ZIP-level market 85367
- Home prices YoY
- -26.2%
- Rents YoY
- 4.5%
- Active inventory
- 415
- Price-to-rent
- 9.9×
Monthly cashflow live
- Estimated rent
- $2,345 medium interval (Pro) →
- Mortgage (P&I)
- −$1,468
- Tax from tax record
- −$123 /mo · $1,480/yr
- Insurance
- −$117
- HOA
- −$0
- Vacancy / Maint / Mgmt
- −$492
- Net cashflow
- $144
Break-even live
Sensitivity live
| Price | -10% $303 | -5% $224 | +0% $144 | +5% $65 | +10% $-14 |
|---|---|---|---|---|---|
| Rent | -10% $-41 | -5% $52 | +0% $144 | +5% $237 | +10% $330 |
| Rate | -1.0pp $285 | -0.5pp $216 | base $144 | +0.5pp $72 | +1.0pp $-2 |
UW: 25.0% down · 7.5% · 30yr · 1.5% tax · 5.0% vac · 8.0% maint · 8.0% mgmt
Financing live
Cash to close
- Down payment
- $69,975
- Closing costs
- $8,397
- Reserves months
- —
- Total cash needed
- —
Loan-product check · same deal, 3 products live
Conventional
25% down · 7.5% · 30yr
- Down + closing
- —
- Monthly P&I
- —
- Monthly cashflow
- —
- DSCR
- —
- Eligible?
- —
Personal DTI + credit; lowest rate.
DSCR
20% down · 8.5% · 30yr
- Down + closing
- —
- Monthly P&I
- —
- Monthly cashflow
- —
- DSCR
- —
- Eligible?
- —
No personal income docs; deal must DSCR.
Hard money
10% down · 12.0% · 12mo
- Down + closing
- —
- Monthly P&I
- —
- Monthly cashflow
- —
- DSCR
- —
- Eligible?
- —
Short-term bridge; refi at stabilization.
Rent comps 4 comps
| Address | Beds | Baths | Sqft | Rent | $/sqft | DOM | Units | Dist |
|---|---|---|---|---|---|---|---|---|
| 14739 E 47th Ln Yuma, AZ | 3.0 | 2.0 | 1706 | $2,325 | $1.36 | 22d | 1 | 0.40mi |
| 14341 E 54th St Yuma, AZ | 3.0 | 2.0 | 1714 | $2,300 | $1.34 | 15d | 1 | 0.69mi |
| 12237 S Laurel Ln Yuma, AZ | 3.0 | 2.0 | 2099 | $2,950 | $1.41 | 15d | 1 | 1.20mi |
| 14814 E 41st St Yuma, AZ | 3.0 | 2.0 | 2121 | $850 | $0.40 | 15d | 1 | 1.30mi |
Listing history 22 events
-
2026-06-21days on market $279,900 Active 85 DOM
-
2026-06-19days on market $279,900 Active 83 DOM
-
2026-06-18days on market $279,900 Active 82 DOM
-
2026-06-17days on market $279,900 Active 81 DOM
-
2026-06-16days on market $279,900 Active 80 DOM
-
2026-06-15days on market $279,900 Active 79 DOM
-
2026-06-14days on market $279,900 Active 77 DOM
-
2026-06-13remarks 604-char remark
-
2026-06-13statusdays on market $279,900 Active 76 DOM
-
2026-06-10days on market $279,900 Active Under Contract 74 DOM
-
2026-06-09days on market $279,900 Active Under Contract 73 DOM
-
2026-06-08days on market $279,900 Active Under Contract 72 DOM
-
2026-06-07days on market $279,900 Active Under Contract 71 DOM
-
2026-06-05statusdays on market $279,900 Active Under Contract 68 DOM
-
2026-06-02days on market $279,900 Active 66 DOM
-
2026-06-01days on market $279,900 Active 65 DOM
-
2026-05-31days on market $279,900 Active 64 DOM
-
2026-05-30days on market $279,900 Active 63 DOM
-
2026-04-24price $279,900
-
2026-03-27$299,900 Active
-
2004-10-21soldstatus $54,000
-
2004-06-04soldstatus $29,332
ⓘ Source: listings_history table (triggers on properties + properties_extension) + one-shot
backfill from property_details.listing_events for pre-trigger history.
Tax reassessment forecast AZ · Resets to sale price
- Current annual tax
- $1,480 · $123/mo
- Projected year-2 tax
- $1,847 · $154/mo
- Expected delta
- +$367/yr (+$31/mo · 24.8%)
ⓘ Screening estimate from a state-policy table — verify with the county assessor before closing.
Climate risk First Street
- Flood 1/10 Low FEMA zone X (unshaded) · 0% chance over 30 yrs
- Wildfire 4/10 Moderate
- Heat 9/10 Extreme 6 d/yr ≥111°F today · 17 d/yr by 30 yrs out
- Wind 1/10 Low
- Air quality 2/10 Low 1 unhealthy d/yr today · 2 by 30 yrs out
Nearby sold comps map
Loading sold comps map…
Walkable amenities ~0.75 mi
Loading nearby amenities…
Taxation est. · year 1
- Rental income
- $28,136
- − Mortgage interest
- −$15,679
- − Property taxes
- −$1,480
- − Insurance
- −$1,400
- − Repairs & maintenance
- −$2,251
- − Management
- −$2,251
- − Depreciation
- −$8,143
- Taxable loss
- −$3,067
- Est. tax savings @ 24.0%
- +$736
- After-tax cash flow
- $2,470/yr
For passive investors: Depreciation is non-cash, so a rental often shows a tax loss while cash-flowing — sheltering income. Rental losses are passive: they offset passive income freely, and up to $25,000/yr can offset ordinary (W-2) income if you actively participate and your MAGI is under $100k (phasing out to $0 by $150k); unused losses carry forward. On sale, claimed depreciation is recaptured at up to 25%, and gains may owe capital-gains tax (a 1031 exchange can defer both). Figures are a year-1 estimate at your 24.0% rate — not tax advice; consult a CPA.
Schools (NCES district)
- District
- Yuma Union High School District (4507)
- NCES district ID
- 0409630
- Math proficiency
- 14% ▼ -12.00%
- Reading proficiency
- 16% ▼ -10.00%
- Median HH income
- $40,512
- Composite
- 12.86/100
- National rank
- #9592
- State rank
- #212 of 249 in AZ
Livability — Fortuna Foothills
- Score
- 60/100
- State rank
- #174
- US rank
- #18663
Category grades
Schools grade is shown separately in the Schools card above.
Census & demographics
- Census place
- Fortuna Foothills, AZ
- County
- Yuma County · 149,809 people
- City population
- 21,356
- Metro
- Yuma, AZ
- Population (ZIP)
- 22,074
- Household income
- $58,469
- Rent vs Own
- Severe rent burden
- 408.0
Population outlook (Yuma County) Hauer SSP2
- Today (2025)
- 211,633 people
- By 2030
- 214,114 · +1.2%
- By 2040
- 217,856 · +2.9%
- By 2050
- 220,276 · +4.1%
- By 2075
- 222,359 · +5.1%
- By 2100
- 198,880 · -6.0%
Race, ethnicity, and origin ACS 2023
- Neighborhood character
- Predominantly White (71%)
- Race & ethnicity
- White 71% Hispanic / Latino 22% Two or more races 11% Black 3%
- Hispanic origin (detail)
- Mexican 20%
- Common ancestry
- Portuguese 4% Lithuanian 2% Italian 2%
- Foreign-born
- 10% · Canada
- Languages at home
- 81% English-only · Spanish 16% French/Haitian/Cajun 1% German/W. Germanic 1%
Political lean MEDSL · Yuma
- 2024 margin
- Strong R (+20.4) · D 39.3% · R 59.8%
- 2008→2024 swing
- -6.6pp toward R · 2008: -13.8pp · 2024: -20.4pp
- All cycles
- 2024: R+20.4 2020: R+6.2 2016: R+5.5 2012: R+16.1 2008: R+13.8
Not yet ingested
- Civics
- —
Market trends
- HPI YoY
- ▼ -80.81%
- Current HPI
- 227.2692
- Rent YoY
- ▲ 4.46%
- Metro
- Yuma, AZ
- State GDP YoY
- ▲ 4.54%
- F500 in state
- 20
Industry mix (Fortune 500 HQ in AZ)
| Industry | F500 HQs | Revenue |
|---|---|---|
| Technology | 2 | $13B |
|
||
| Mining / Metals | 1 | $23B |
|
||
| Environmental Services | 1 | $16B |
|
||
| Metals / Steel | 1 | $14B |
|
||
| Technology Distribution | 1 | $9B |
|
||
| Homebuilding | 1 | $8B |
|
||
Price history
+854.2% since first listed4 events — show timeline
- 2026-04-24 Price Changed $279,900 YAR
- 2026-03-27 Listed $299,900 YAR
- 2004-10-21 Sold (Public Records) $54,000 Public Records
- 2004-06-04 Sold (Public Records) $29,332 Public Records
Property tax history
+2.5%/yrLatest (2025): $1,480 · +3.2% YoY. Source: county tax records.
Cash-flow waterfall
monthlySold comps — $/sqft
last 12 mo · ≤1 miLoading sold comps…