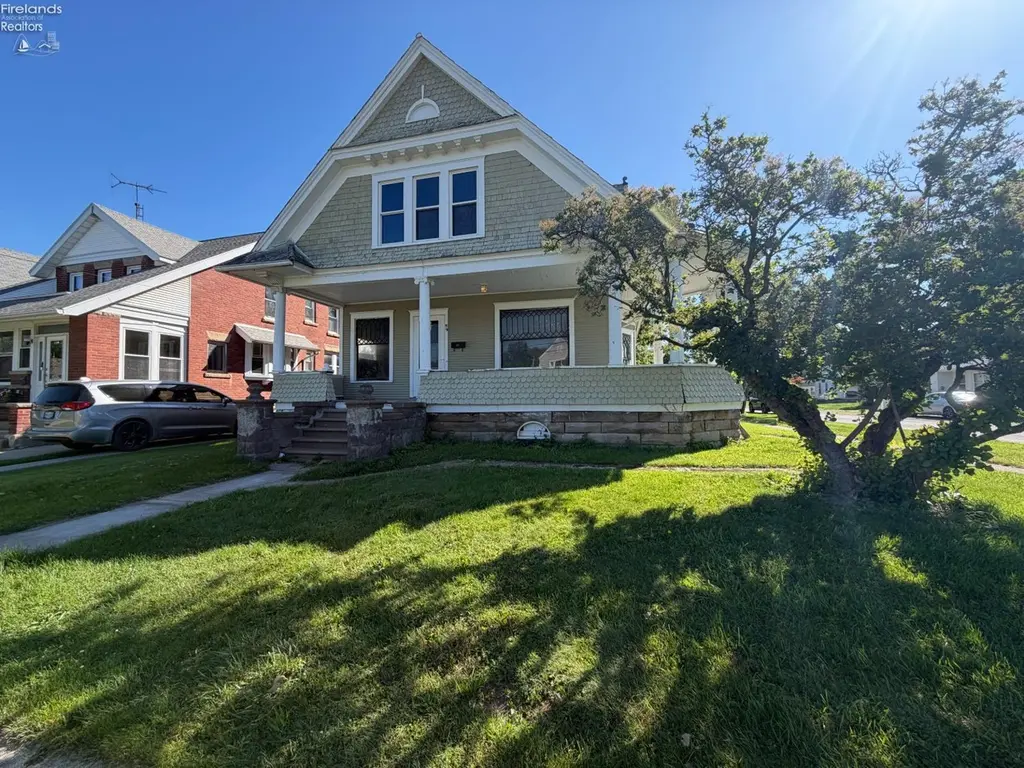
99 S Linwood Ave · Norwalk, OH
Flood risk 1/10 · Minimal
- FEMA flood zone
- X (unshaded)
- Chance of flooding over 30 yrs
- 0.0%
- Est. flood insurance / yr
- $507 – $1,088
Fire risk 1/10 · Minimal
- Est. fire insurance / yr
- $713 – $1,323
Heat risk 3/10 · Minor
- Hot days now (above 96°F)
- 7 days/yr
- Hot days in 30 yrs
- 17 days/yr
Wind risk 1/10 · Minimal
- Chance of severe wind over 30 yrs
- —
Air-quality risk 2/10 · Minimal
- Unhealthy air days now
- 0 days/yr
- Unhealthy air days in 30 yrs
- 1 days/yr
Risk factors via First Street. Map © Google.
Why this score? — see what drove the B+ grade
The composite is a weighted blend of 9 inputs, each scored 0–100. Each bar is that input's sub-score; the figure is the points it added to the 100-point composite (weight × sub-score).
- Cash flow +30.0/30.0
- ARV discount +15.0/15.0
- DSCR +10.0/10.0
- 1% rule +9.4/10.0
- Schools +5.2/10.0
- Livability +4.0/5.0
- Rent growth +2.5/5.0
- Condition / age +2.5/5.0
- Appreciation +0.0/10.0
$99,000
🖨 Deal sheet 📄 Offer letter ✓ Due diligence
Listing remarks
Historic charm meets unlimited potential for under $100k at this corner-lot gem in the heart of Norwalk! Classic wood finishes and large, light-filled rooms give this property the bones buyers dream about finding. Wrap around front porch. Investors and buyers ready to roll up their sleeves will find exactly what they have been searching for here. Sold strictly as-is, seller will not make repairs. Cash offers and specialty rehab loans considered. Closed-toe shoes required for all showings. Bring your vision and make this one yours.
Key facts
- Corner-lot
- 7,649 sq ft lot
Tags
Property features AI
Exterior
- Parking: Off-street parking
- Utilities: Public water; Public sewer
- Home design: Single family residence; Residential property
- Construction: Wood siding
- Exterior features: Off-street parking
Interior
- Kitchen: Range; Refrigerator
- Bedrooms: 7 total rooms (bedroom count not specified)
- Bathrooms: 1 full bathroom; 1 half bathroom
- Heating & cooling: Natural gas heating; Forced air
- Interior features: Gas fireplace; Full basement
- Laundry & utility: Has heating: natural gas, forced air
Neighborhood map
What this means for you Summary
Snapshot
- This is a 3-bed/1.5-bath single-family listed at $99k.
Deal economics
- At list price, monthly cash flow is $422 ($5k/yr) — positive.
- The deal already cash-flows at list — no discount required.
- Meets the 1% rule at list price ($1k rent vs $99k).
- Cap rate 11.4% vs local median 4.0% in Norwalk — top-decile yield for the area; either an underpriced asset or a hidden risk that comps aren't pricing in. Stress-test before assuming the spread holds.
Location & tenants
- Location reads 80/100 on livability (#120 in OH, #1,771 nationally) — a professional / high-income tenant draw. Strengths: crime A+, cost of living A+, housing A+; Watch: employment D+, commute F.
- Norwalk City (town): math 59% / reading 64% proficiency, ranked #279 of 656 in OH (top 42%) — acceptable for families but not a draw, mixed tenant base, ~2y average lease.
- Market conditions: 51 active listings in the ZIP; 40 units permitted in Huron County in 2024 (0 in 5+ unit buildings).
Forward outlook
- Local home prices are declining (-3.0%/yr); year-one equity from $684 of loan paydown is wiped out by about $3k of value loss. Plan a longer hold.
- Huron County population projected at -22% by 2050 — secular population decline; favor cash flow + early exit over multi-decade hold.
- At projected returns (-3.0% appreciation + 3.0% rent growth), your $28k cash investment doubles in ~7 years — after that, you're playing with house money.
Negotiation context
- Only 1 days on market — expect competitive offers; lowballing is unlikely to land.
Questions for the listing agent
- Is there a deadline driving the sale (1031 exchange, divorce, estate, relocation)? That informs how much negotiation room exists.
- Schools are A-rated — typically a magnet for longer-tenancy family renters. What's the average tenant stay here, and is there a school-zone premium baked into asking?
- What's the average days-on-market for RENTAL listings here right now (not sales)? A rising rental-DOM trend means longer vacancies and softer asking-rent achievability than the comps imply.
- What's the recent tenant-quality profile in this submarket — average credit score on applications, eviction rate, late-payment / NSF rate, and stable-employment percentage? A property-management company in the area should have these aggregated.
- How much new for-sale + rental construction is in the pipeline within 1–3 miles? Heavy new supply typically softens prices + rents 12–24 months out; constrained supply supports both.
Investment metrics
- 1% rule
- 1.44% ✓
- Cap rate
- 11.41%
- Cash-on-cash
- 18.27%
- DSCR
- 1.81
- GRM
- 5.8
CMA / ARV
- ARV (on-the-fly)
- $195,500
- Comps found
- 12
Show comp detail 12 sales within ~0.75 mi
| Address | Dist | Beds/Ba | Sqft | Sold | Price | $/sf | Match |
|---|---|---|---|---|---|---|---|
| 99 S Linwood Ave | 0.00mi | 3/1.5 | 1,955 (0%) | 0mo | $97,000 | $50 | 100 |
| 17 Henry St | 0.33mi | 3/2.0 | 1,777 (-9%) | 3mo | $314,000 | $177 | 65 |
| 37 S Garden St | 0.54mi | 4/1.5 (+1) | 1,960 (+0%) | 8mo | $219,700 | $112 | 63 |
| 12 Olive St | 0.32mi | 4/2.0 (+1) | 1,920 (-2%) | 18mo | $164,000 | $85 | 60 |
| 57 Milan Ave | 0.69mi | 4/1.5 (+1) | 1,956 (+0%) | 6mo | $180,000 | $92 | 58 |
| 120 Woodlawn Ave | 0.55mi | 4/2.0 (+1) | 1,884 (-4%) | 4mo | $209,900 | $111 | 57 |
| 39 W Elm St | 0.31mi | 3/2.0 | 1,826 (-7%) | 19mo | $145,000 | $79 | 57 |
| 144 Benedict Ave | 0.12mi | 4/1.5 (+1) | 1,707 (-13%) | 18mo | $185,000 | $108 | 53 |
| 22 Walnut St | 0.19mi | 3/2.0 | 1,706 (-13%) | 19mo | $169,900 | $100 | 52 |
| 89 Christie Ave | 0.55mi | 4/1.5 (+1) | 1,869 (-4%) | 18mo | $230,000 | $123 | 47 |
| 1 Manahan Dr | 0.60mi | 3/2.0 | 1,829 (-6%) | 17mo | $159,900 | $87 | 45 |
| 15 Marshall St | 0.68mi | 4/1.5 (+1) | 1,820 (-7%) | 19mo | $150,000 | $82 | 36 |
Match score weights: distance 35% · size 25% · config 20% · recency 20%. Top-matched comps best support the ARV.
Projected returns pro-forma
-3.0% appreciation · 3.0% rent growth · sell at horizon
- IRR
- 9.9%
- Equity multiple
- 1.39×
- Total profit
- $10,868
- Equity at exit
- $14,761
- IRR
- 19.1%
- Equity multiple
- 2.59×
- Total profit
- $44,208
- Equity at exit
- $8,560
Cash invested: $27,720 (down + closing). Projections, not guarantees.
Landlord ↔ Tenant lean methodology
- Overall (STATE)
- 73 Landlord-Friendly
- State Ohio
- 73 Landlord-Friendly · R+6
- County
- — inherits STATE
- City
- — inherits STATE
ZIP-level market 44857
- Home prices YoY
- -28.3%
- Active inventory
- 51
- Price-to-rent
- 5.8×
Monthly cashflow live
- Estimated rent
- $1,425 medium interval (Pro) →
- Mortgage (P&I)
- −$519
- Tax from tax record
- −$144 /mo · $1,723/yr
- Insurance
- −$41
- HOA
- −$0
- Vacancy / Maint / Mgmt
- −$299
- Net cashflow
- $422
Break-even live
UW: 25.0% down · 7.5% · 30yr · 1.5% tax · 5.0% vac · 8.0% maint · 8.0% mgmt
Financing live
Cash to close
- Down payment
- $24,750
- Closing costs
- $2,970
- Reserves months
- —
- Total cash needed
- —
Loan-product check · same deal, 3 products live
Conventional
25% down · 7.5% · 30yr
- Down + closing
- —
- Monthly P&I
- —
- Monthly cashflow
- —
- DSCR
- —
- Eligible?
- —
Personal DTI + credit; lowest rate.
DSCR
20% down · 8.5% · 30yr
- Down + closing
- —
- Monthly P&I
- —
- Monthly cashflow
- —
- DSCR
- —
- Eligible?
- —
No personal income docs; deal must DSCR.
Hard money
10% down · 12.0% · 12mo
- Down + closing
- —
- Monthly P&I
- —
- Monthly cashflow
- —
- DSCR
- —
- Eligible?
- —
Short-term bridge; refi at stabilization.
Listing history 3 events
-
2026-06-07status $99,000 Pending 1 DOM
-
2026-06-02remarks 536-char remark
-
2026-06-02$99,000 Active 1 DOM
ⓘ Source: listings_history table (triggers on properties + properties_extension) + one-shot
backfill from property_details.listing_events for pre-trigger history.
Tax reassessment forecast OH · Partial reset (capped growth)
- Current annual tax
- $1,723 · $144/mo
- Projected year-2 tax
- $1,723 · $144/mo
- Expected delta
- $0/yr ($0/mo · 0.0%)
ⓘ Screening estimate from a state-policy table — verify with the county assessor before closing.
Climate risk First Street
- Flood 1/10 Low FEMA zone X (unshaded) · 0% chance over 30 yrs
- Wildfire 1/10 Low
- Heat 3/10 Moderate 7 d/yr ≥96°F today · 17 d/yr by 30 yrs out
- Wind 1/10 Low
- Air quality 2/10 Low 0 unhealthy d/yr today · 1 by 30 yrs out
Nearby sold comps map
Loading sold comps map…
Walkable amenities ~0.75 mi
Loading nearby amenities…
Taxation est. · year 1
- Rental income
- $17,104
- − Mortgage interest
- −$5,546
- − Property taxes
- −$1,723
- − Insurance
- −$495
- − Repairs & maintenance
- −$1,368
- − Management
- −$1,368
- − Depreciation
- −$2,880
- Taxable income
- $3,723
- Est. tax owed @ 24.0%
- −$894
- After-tax cash flow
- $4,170/yr
For passive investors: Depreciation is non-cash, so a rental often shows a tax loss while cash-flowing — sheltering income. Rental losses are passive: they offset passive income freely, and up to $25,000/yr can offset ordinary (W-2) income if you actively participate and your MAGI is under $100k (phasing out to $0 by $150k); unused losses carry forward. On sale, claimed depreciation is recaptured at up to 25%, and gains may owe capital-gains tax (a 1031 exchange can defer both). Figures are a year-1 estimate at your 24.0% rate — not tax advice; consult a CPA.
Schools (NCES district)
- District
- Norwalk City
- NCES district ID
- 3904456
- Math proficiency
- 59% ▼ -7.00%
- Reading proficiency
- 64% ▬ 0.00%
- Median HH income
- $44,253
- Composite
- 51.76/100
- National rank
- #1680
- State rank
- #279 of 656 in OH
Livability — Norwalk
- Score
- 80/100
- State rank
- #120
- US rank
- #1771
Category grades
Schools grade is shown separately in the Schools card above.
Census & demographics
- Census place
- Norwalk, OH
- County
- Huron County · 23,288 people
- City population
- 23,288
- Metro
- Norwalk, OH
- Population (ZIP)
- 23,288
- Household income
- $64,297
- Rent vs Own
- Severe rent burden
- 620.0
Population outlook (Huron County) Hauer SSP2
- Today (2025)
- 55,572 people
- By 2030
- 53,514 · -3.7%
- By 2040
- 48,770 · -12.2%
- By 2050
- 43,611 · -21.5%
- By 2075
- 32,349 · -41.8%
- By 2100
- 21,849 · -60.7%
Race, ethnicity, and origin ACS 2023
- Neighborhood character
- Predominantly White (87%)
- Race & ethnicity
- White 87% Hispanic / Latino 7% Two or more races 6%
- Hispanic origin (detail)
- Mexican 6%
- Common ancestry
- Lithuanian 2% Slovak 2% Romanian 2%
- Foreign-born
- 2% · Canada
- Languages at home
- 97% English-only · Spanish 3%
Political lean MEDSL · Huron
- 2024 margin
- Solid R (+44.0) · D 27.6% · R 71.6%
- 2008→2024 swing
- -40.9pp toward R · 2008: -3.1pp · 2024: -44.0pp
- All cycles
- 2024: R+44.0 2020: R+41.2 2016: R+36.4 2012: R+8.9 2008: R+3.1
Not yet ingested
- Civics
- —
Market trends
- HPI YoY
- ▼ -88.69%
- Current HPI
- 225.1408
- Rent YoY
- —
- Metro
- Norwalk, OH
- State GDP YoY
- ▲ 1.98%
- F500 in state
- 48
Industry mix (Fortune 500 HQ in OH)
| Industry | F500 HQs | Revenue |
|---|---|---|
| Insurance | 3 | $145B |
|
||
| Industrial Machinery | 3 | $49B |
|
||
| Financial Services | 3 | $24B |
|
||
| Consumer Goods | 2 | $93B |
|
||
| Aerospace / Defense | 2 | $47B |
|
||
| Utilities | 2 | $33B |
|
||
Price history
1 event — show timeline
- 2026-06-02 Listed $99,000 FAOR
Property tax history
+8.6%/yrLatest (2025): $1,723 · -0.5% YoY. Source: county tax records.
Cash-flow waterfall
monthlySold comps — $/sqft
last 12 mo · ≤1 miLoading sold comps…