173 W Main St · Galeton, PA
Flood risk 1/10 · Minimal
- FEMA flood zone
- X (unshaded)
- Chance of flooding over 30 yrs
- 0.0%
- Est. flood insurance / yr
- $473 – $860
Fire risk 3/10 · Minor
- Est. fire insurance / yr
- $511 – $949
Heat risk 2/10 · Minimal
- Hot days now (above 90°F)
- 8 days/yr
- Hot days in 30 yrs
- 18 days/yr
Wind risk 1/10 · Minimal
- Chance of severe wind over 30 yrs
- —
Air-quality risk 1/10 · Minimal
- Unhealthy air days now
- 0 days/yr
- Unhealthy air days in 30 yrs
- 0 days/yr
Risk factors via First Street. Map © Google.
Why this score? — see what drove the C- grade
The composite is a weighted blend of 9 inputs, each scored 0–100. Each bar is that input's sub-score; the figure is the points it added to the 100-point composite (weight × sub-score).
- Cash flow +14.6/30.0
- Appreciation +8.2/10.0
- ARV discount +7.5/15.0
- DSCR +4.4/10.0
- 1% rule +4.1/10.0
- Schools +3.8/10.0
- Livability +3.3/5.0
- Rent growth +2.5/5.0
- Condition / age +2.5/5.0
$105,000
🖨 Deal sheet 📄 Offer letter ✓ Due diligence
Listing remarks
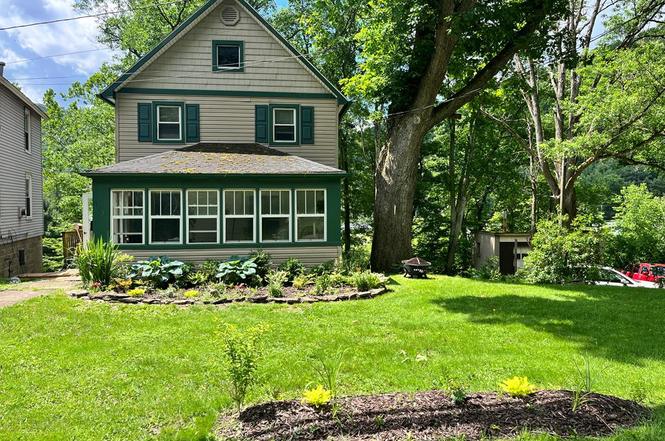
There's so much charm in this 4-bedroom, 1-bath home! Featuring recently updated kitchen countertops, this home offers a fresh and inviting space and a functional layout for everyday living. Relax with your morning coffee on the lovely front sunporch, or unwind in the backyard while listening to the peaceful sounds of the rumbling river nearby. Conveniently located close to shopping, dining, schools, and other everyday amenities, you'll appreciate all the benefits of in-town living while still enjoying a tranquil outdoor setting. Whether you're looking for a primary residence or an investment opportunity, this property is one you won't want to miss!
Key facts
- Front sunporch
- Backyard
- 0.24 acre lot
Tags
Property features AI
Exterior
- Utilities: Public water; Public sewer
- Home design: Single-family residence; 2 stories
- Construction: Wood siding construction
- Exterior features: Shingle roof; Lot approximately 63.6 x 165 (0.24 acres)
Interior
- Bedrooms: Total of 8 rooms (bedrooms not separately specified)
- Bathrooms: 1 full bathroom
- Heating & cooling: Propane heating; Has heating
- Interior features: Gas water heater; Unfinished basement
Neighborhood map
What this means for you Summary
Snapshot
- This is a 4-bed/1.0-bath other listed at $105k.
Deal economics
- At list price, monthly cash flow is $24 ($292/yr) — positive.
- The deal already cash-flows at list — no discount required.
- To meet the 1% rule (rent ≥ 1% of price), the offer needs to be $96k (8.5% below list).
- Recommended offer: $96k (8.5% below list) — sets the bar for 1% rule.
Location & tenants
- Location reads 66/100 on livability (#1,038 in PA) — a middle-class / working-renter tenant base. Strengths: crime A+, cost of living A+, housing B+; Watch: schools D+, health & safety D, amenities F.
- Galeton Area SD (rural): math 35% / reading 50% proficiency, ranked #484 of 658 in PA (top 74%) — families likely to look elsewhere, expect single-tenant / working-renter base with shorter leases.
- Market conditions: 20 active listings in the ZIP; 24 units permitted in Potter County in 2024 (0 in 5+ unit buildings).
Forward outlook
- In year one you build about $8k of equity ($726 loan paydown + $7k appreciation (6.5% local appreciation)).
- Potter County population projected at -27% by 2050 — secular population decline; favor cash flow + early exit over multi-decade hold.
- At projected returns (6.5% appreciation + 3.0% rent growth), your $29k cash investment doubles in ~4 years — after that, you're playing with house money.
- By year 5, paydown + projected appreciation supports a ~$33k cash-out refi (75% LTV) — recoverable capital for the next deal without selling this one.
Negotiation context
- Only 1 days on market — expect competitive offers; lowballing is unlikely to land.
- Current owner paid $40k; list at $105k implies a 162% gain — meaningful room to come down on a strong offer.
Risks & watch-outs
- Watch-outs: built in 1900 — expect roof / HVAC / electrical / plumbing capex.
Questions for the listing agent
- Built in 1900 — when were the roof, HVAC, electrical panel, plumbing, and water heater last replaced?
- Is there a deadline driving the sale (1031 exchange, divorce, estate, relocation)? That informs how much negotiation room exists.
- Schools are D-rated, which usually means shorter tenancies and higher turnover. Who's the typical renter profile here, and what's been the actual vacancy rate?
- What's the average days-on-market for RENTAL listings here right now (not sales)? A rising rental-DOM trend means longer vacancies and softer asking-rent achievability than the comps imply.
- What's the recent tenant-quality profile in this submarket — average credit score on applications, eviction rate, late-payment / NSF rate, and stable-employment percentage? A property-management company in the area should have these aggregated.
- How much new for-sale + rental construction is in the pipeline within 1–3 miles? Heavy new supply typically softens prices + rents 12–24 months out; constrained supply supports both.
Investment metrics
- 1% rule
- 0.91% ✗
- Cap rate
- 6.57%
- Cash-on-cash
- 0.99%
- DSCR
- 1.04
- GRM
- 9.1
CMA / ARV
No comps found within radius.
Projected returns pro-forma
6.48% appreciation · 3.0% rent growth · sell at horizon
- IRR
- 17.3%
- Equity multiple
- 2.19×
- Total profit
- $34,922
- Equity at exit
- $69,240
- IRR
- 16.9%
- Equity multiple
- 4.43×
- Total profit
- $100,835
- Equity at exit
- $128,452
Cash invested: $29,400 (down + closing). Projections, not guarantees.
Landlord ↔ Tenant lean methodology
- Overall (STATE)
- 62 Landlord-Friendly
- State Pennsylvania
- 62 Landlord-Friendly · EVEN
- County
- — inherits STATE
- City
- — inherits STATE
ZIP-level market 16922
- Home prices YoY
- 4.9%
- Active inventory
- 20
- Price-to-rent
- 9.1×
Monthly cashflow live
- Estimated rent
- $960 medium interval (Pro) →
- Mortgage (P&I)
- −$551
- Tax from tax record
- −$140 /mo · $1,680/yr
- Insurance
- −$44
- HOA
- −$0
- Vacancy / Maint / Mgmt
- −$202
- Net cashflow
- $24
Break-even live
UW: 25.0% down · 7.5% · 30yr · 1.5% tax · 5.0% vac · 8.0% maint · 8.0% mgmt
Financing live
Cash to close
- Down payment
- $26,250
- Closing costs
- $3,150
- Reserves months
- —
- Total cash needed
- —
Loan-product check · same deal, 3 products live
Conventional
25% down · 7.5% · 30yr
- Down + closing
- —
- Monthly P&I
- —
- Monthly cashflow
- —
- DSCR
- —
- Eligible?
- —
Personal DTI + credit; lowest rate.
DSCR
20% down · 8.5% · 30yr
- Down + closing
- —
- Monthly P&I
- —
- Monthly cashflow
- —
- DSCR
- —
- Eligible?
- —
No personal income docs; deal must DSCR.
Hard money
10% down · 12.0% · 12mo
- Down + closing
- —
- Monthly P&I
- —
- Monthly cashflow
- —
- DSCR
- —
- Eligible?
- —
Short-term bridge; refi at stabilization.
Listing history 2 events
-
2026-06-17remarks 657-char remark
-
2026-06-17$105,000 Active 1 DOM
ⓘ Source: listings_history table (triggers on properties + properties_extension) + one-shot
backfill from property_details.listing_events for pre-trigger history.
Tax reassessment forecast PA · Partial reset (capped growth)
- Current annual tax
- $1,680 · $140/mo
- Projected year-2 tax
- $1,680 · $140/mo
- Expected delta
- $0/yr ($0/mo · 0.0%)
ⓘ Screening estimate from a state-policy table — verify with the county assessor before closing.
Climate risk First Street
- Flood 1/10 Low FEMA zone X (unshaded) · 0% chance over 30 yrs
- Wildfire 3/10 Moderate
- Heat 2/10 Low 8 d/yr ≥90°F today · 18 d/yr by 30 yrs out
- Wind 1/10 Low
- Air quality 1/10 Low 0 unhealthy d/yr today · 0 by 30 yrs out
Nearby sold comps map
Loading sold comps map…
Walkable amenities ~0.75 mi
Loading nearby amenities…
Taxation est. · year 1
- Rental income
- $11,524
- − Mortgage interest
- −$5,882
- − Property taxes
- −$1,680
- − Insurance
- −$525
- − Repairs & maintenance
- −$922
- − Management
- −$922
- − Depreciation
- −$3,055
- Taxable loss
- −$1,461
- Est. tax savings @ 24.0%
- +$351
- After-tax cash flow
- $642/yr
For passive investors: Depreciation is non-cash, so a rental often shows a tax loss while cash-flowing — sheltering income. Rental losses are passive: they offset passive income freely, and up to $25,000/yr can offset ordinary (W-2) income if you actively participate and your MAGI is under $100k (phasing out to $0 by $150k); unused losses carry forward. On sale, claimed depreciation is recaptured at up to 25%, and gains may owe capital-gains tax (a 1031 exchange can defer both). Figures are a year-1 estimate at your 24.0% rate — not tax advice; consult a CPA.
Schools (NCES district)
- District
- Galeton Area SD
- NCES district ID
- 4210530
- Math proficiency
- 35% ▼ -5.00%
- Reading proficiency
- 50% ▼ -5.00%
- Median HH income
- $37,991
- Composite
- 37.72/100
- National rank
- #8769
- State rank
- #484 of 658 in PA
Livability — Galeton
- Score
- 66/100
- State rank
- #1038
- US rank
- #11568
Category grades
Schools grade is shown separately in the Schools card above.
Census & demographics
- Census place
- Galeton, PA
- Population (ZIP)
- 1,610
Population outlook (Potter County) Hauer SSP2
- Today (2025)
- 15,824 people
- By 2030
- 15,023 · -5.1%
- By 2040
- 13,290 · -16.0%
- By 2050
- 11,572 · -26.9%
- By 2075
- 8,144 · -48.5%
- By 2100
- 5,102 · -67.8%
Race, ethnicity, and origin ACS 2023
- Neighborhood character
- Predominantly White (96%)
- Race & ethnicity
- White 96% Two or more races 2%
- Common ancestry
- Slovak 3% Romanian 3% Lithuanian 1%
- Foreign-born
- 1% · Canada
- Languages at home
- 98% English-only · Spanish 1% German/W. Germanic 1%
Political lean MEDSL · Potter
- 2024 margin
- Solid R (+62.3) · D 18.4% · R 80.7%
- 2008→2024 swing
- -24.9pp toward R · 2008: -37.4pp · 2024: -62.3pp
- All cycles
- 2024: R+62.3 2020: R+60.8 2016: R+63.6 2012: R+45.9 2008: R+37.4
Not yet ingested
- Civics
- —
Market trends
- HPI YoY
- ▲ 6.48%
- Current HPI
- 138.961
- Rent YoY
- —
- Metro
- —
- State GDP YoY
- ▲ 1.68%
- F500 in state
- 34
Industry mix (Fortune 500 HQ in PA)
| Industry | F500 HQs | Revenue |
|---|---|---|
| Healthcare | 2 | $309B |
|
||
| Insurance | 2 | $27B |
|
||
| Telecommunications / Media | 1 | $124B |
|
||
| Industrial Distribution | 1 | $22B |
|
||
| Financial Services | 1 | $20B |
|
||
| Chemicals / Materials | 1 | $18B |
|
||
Price history
+228.1% since first listed3 events — show timeline
- 2026-06-17 Listed $105,000 NMPA
- 2019-10-11 Sold (Public Records) $40,000 Public Records
- 2008-03-28 Sold (Public Records) $32,000 Public Records
Property tax history
+2.5%/yrLatest (2026): $1,680 · -0.1% YoY. Source: county tax records.
Cash-flow waterfall
monthlySold comps — $/sqft
last 12 mo · ≤1 miLoading sold comps…