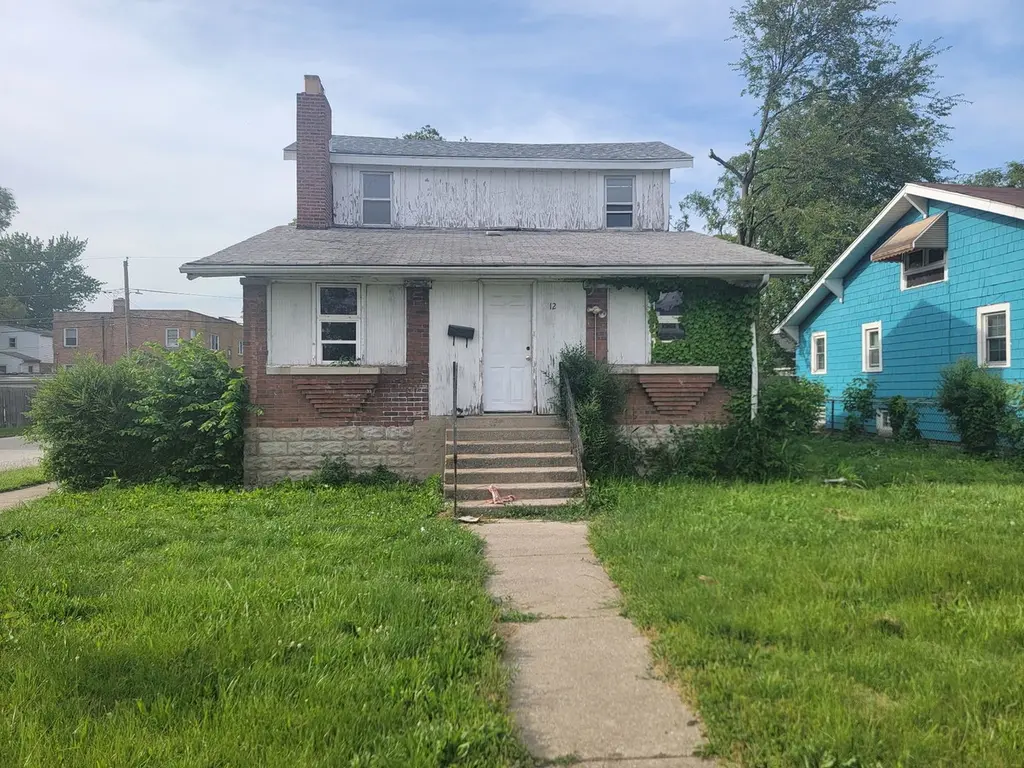
12 Webb St · Calumet City, IL
Flood risk 1/10 · Minimal
- FEMA flood zone
- X (unshaded)
- Chance of flooding over 30 yrs
- 0.0%
- Est. flood insurance / yr
- $507 – $1,088
Fire risk 1/10 · Minimal
- Est. fire insurance / yr
- $804 – $1,492
Heat risk 3/10 · Minor
- Hot days now (above 102°F)
- 7 days/yr
- Hot days in 30 yrs
- 15 days/yr
Wind risk 2/10 · Minimal
- Chance of severe wind over 30 yrs
- 0.0%
Air-quality risk 4/10 · Minor
- Unhealthy air days now
- 5 days/yr
- Unhealthy air days in 30 yrs
- 6 days/yr
Risk factors via First Street. Map © Google.
Why this score? — see what drove the D grade
The composite is a weighted blend of 9 inputs, each scored 0–100. Each bar is that input's sub-score; the figure is the points it added to the 100-point composite (weight × sub-score).
- Cash flow +15.0/30.0
- ARV discount +7.5/15.0
- 1% rule +5.0/10.0
- DSCR +5.0/10.0
- Rent growth +4.0/5.0
- Livability +3.6/5.0
- Condition / age +2.5/5.0
- Schools +1.0/10.0
- Appreciation +0.0/10.0
$49,900
🖨 Deal sheet 📄 Offer letter ✓ Due diligence
Listing remarks
Calling all investors, rehabbers, and buyers looking for their next project! This property is ready for a complete transformation and offers endless possibilities for the right buyer. Previously configured with 4+ bedrooms, 2 bathrooms, an unfinished basement, and a 2-car garage, this home provides a great foundation to bring your vision to life. Whether you're planning a fix-and-flip, buy-and-hold investment, or custom renovation, this is your chance to be creative. Property is being sold AS-IS.
Key facts
- 5,000 sq ft lot
- 2 garage spots
- Built 1918
Property features AI
Finance
- Other: Property assessed using assessor's living area source
- HOA & community: No master association fees required
Exterior
- Parking: Detached garage with 2 garage spaces (2 total parking spaces)
- Utilities: Public water; Public sewer
- Home design: Detached single-family home; 1.5-story design; Fee simple ownership; More than 100 years old; Built before 1978
- Construction: Brick and frame construction
- Exterior features: Lot dimensions approximately 40 x 125; Lot smaller than 0.25 acre
Interior
- Kitchen: Kitchen on main level
- Bedrooms: 4 bedrooms (Master bedroom on main level, other bedrooms on main and second levels)
- Bathrooms: 2 full bathrooms
- Heating & cooling: Natural gas forced air heating
- Interior features: Unfinished full basement; 7 total rooms
- Laundry & utility: Laundry room
Neighborhood map
What this means for you Summary
Snapshot
- This is a 5-bed/2.0-bath single-family listed at $50k.
Deal economics
- At list price, monthly cash flow is $2k ($20k/yr) — positive.
- The deal already cash-flows at list — no discount required.
- Meets the 1% rule at list price ($3k rent vs $50k).
- Recommended offer: $49k (1.5% below list) — sets the bar for market timing.
- Cap rate 46.4% vs local median 8.2% in Calumet City — top-decile yield for the area; either an underpriced asset or a hidden risk that comps aren't pricing in. Stress-test before assuming the spread holds.
Location & tenants
- Location reads 71/100 on livability (#330 in IL) — a middle-class / working-renter tenant base. Strengths: commute A+, cost of living A+, housing A+; Watch: employment C-, schools F, crime D-.
- Thornton Fractional Twp Hsd 215 (suburban): math 9% / reading 13% proficiency, ranked #563 of 620 in IL (top 91%) — low school quality limits family demand, transient renter base, plan for 1-2y turnover.
- Market conditions: Rents rising fast (+6.2%/yr); 198 active listings in the ZIP; 3 comparable units currently listed for rent nearby; rentals leasing fast (median 1d on market — plan ~1-2 weeks tenant-placement turnaround); 6,272 units permitted in Cook County in 2024 (4,658 in 5+ unit buildings).
- At $2,547/mo this rent would consume 55% of the median local household income ($55k/yr) (locally 2415% of renters already pay >50% of income on rent) — very limited rent-growth headroom before tenants either downsize or default.
Forward outlook
- Local home prices are declining (-3.0%/yr); year-one equity from $345 of loan paydown is wiped out by about $1k of value loss. Plan a longer hold.
- At projected returns (-3.0% appreciation + 6.2% rent growth), your $14k cash investment doubles in ~1 year — after that, you're playing with house money.
Negotiation context
- It's been on market 20 days — a 2% lower offer ($49k) is reasonable based on typical stale-listing flexibility.
- 18 sale attempts since 19y ago with the ask held roughly flat each time — persistent listings suggest the price (not the market) is what's stuck; bring a comps-based counter.
- Current owner paid $30k; list at $50k implies a 64% gain — meaningful room to come down on a strong offer.
Risks & watch-outs
- Watch-outs: built in 1918 — expect roof / HVAC / electrical / plumbing capex.
Questions for the listing agent
- Built in 1918 — when were the roof, HVAC, electrical panel, plumbing, and water heater last replaced?
- Is there a deadline driving the sale (1031 exchange, divorce, estate, relocation)? That informs how much negotiation room exists.
- Schools are F-rated, which usually means shorter tenancies and higher turnover. Who's the typical renter profile here, and what's been the actual vacancy rate?
- Crime grade is D in this area — have there been break-ins, vandalism, or insurance claims at this property in the last 3 years? What carrier currently insures it and at what premium?
- The area grade is low — what's the realistic commute time and amenity access for the typical tenant pool here? Any planned neighborhood developments (good or bad) we should know about?
- What's the average days-on-market for RENTAL listings here right now (not sales)? A rising rental-DOM trend means longer vacancies and softer asking-rent achievability than the comps imply.
- What's the recent tenant-quality profile in this submarket — average credit score on applications, eviction rate, late-payment / NSF rate, and stable-employment percentage? A property-management company in the area should have these aggregated.
- How much new for-sale + rental construction is in the pipeline within 1–3 miles? Heavy new supply typically softens prices + rents 12–24 months out; constrained supply supports both.
Investment metrics
- 1% rule
- 5.10% ✓
- Cap rate
- 46.39%
- Cash-on-cash
- 143.20%
- DSCR
- 7.37
- GRM
- 1.6
CMA / ARV
- ARV (on-the-fly)
- $236,750
- Comps found
- 12
Show comp detail 12 sales within ~0.75 mi
| Address | Dist | Beds/Ba | Sqft | Sold | Price | $/sf | Match |
|---|---|---|---|---|---|---|---|
| 4 Warren St | 0.11mi | 4/1.0 (-1) | 1,775 (-6%) | 7mo | $145,000 | $82 | 70 |
| 512 156th Pl | 0.60mi | 4/2.0 (-1) | 1,920 (+1%) | 1mo | $45,000 | $23 | 64 |
| 207 156th Pl | 0.22mi | 4/2.5 (-1) | 1,625 (-14%) | 3mo | $200,000 | $123 | 57 |
| 228 Elizabeth St | 0.40mi | 4/2.0 (-1) | 2,029 (+7%) | 10mo | $270,000 | $133 | 57 |
| 334 153rd St | 0.67mi | 6/3.0 (+1) | 1,900 (+0%) | 10mo | $240,000 | $126 | 51 |
| 11 Forestdale Park | 0.55mi | 4/2.5 (-1) | 1,862 (-2%) | 17mo | $241,200 | $130 | 51 |
| 106 Highland St | 0.37mi | 5/2.0 | 2,178 (+15%) | 11mo | $230,000 | $106 | 49 |
| 329 153rd Pl | 0.60mi | 4/2.0 (-1) | 2,036 (+8%) | 9mo | $255,000 | $125 | 48 |
| 510 Pulaski Rd | 0.72mi | 5/2.0 | 2,112 (+12%) | 0mo | $199,900 | $95 | 47 |
| 691 Wentworth Ave | 0.45mi | 6/3.0 (+1) | 2,150 (+14%) | 4mo | $273,000 | $127 | 44 |
| 512 155th St | 0.66mi | 4/2.0 (-1) | 1,800 (-5%) | 15mo | $175,000 | $97 | 44 |
| 332 153rd St | 0.67mi | 5/2.0 | 1,742 (-8%) | 18mo | $220,000 | $126 | 41 |
Match score weights: distance 35% · size 25% · config 20% · recency 20%. Top-matched comps best support the ARV.
Projected returns pro-forma
-3.0% appreciation · 6.17% rent growth · sell at horizon
- IRR
- —
- Equity multiple
- 8.62×
- Total profit
- $106,528
- Equity at exit
- $7,440
- IRR
- —
- Equity multiple
- 20.06×
- Total profit
- $266,372
- Equity at exit
- $4,314
Cash invested: $13,972 (down + closing). Projections, not guarantees.
Landlord ↔ Tenant lean methodology
- Overall (STATE)
- 43 Moderately Tenant-Leaning
- State Illinois
- 43 Moderately Tenant-Leaning · D+7
- County
- — inherits STATE
- City
- — inherits STATE
ZIP-level market 60409
- Home prices YoY
- -27.6%
- Rents YoY
- 6.2%
- Active inventory
- 198
- Price-to-rent
- 1.6×
Monthly cashflow live
- Estimated rent
- $2,547 medium interval (Pro) →
- Mortgage (P&I)
- −$262
- Tax est. 1.5%
- −$62 /mo · $748/yr
- Insurance
- −$21
- HOA
- −$0
- Vacancy / Maint / Mgmt
- −$535
- Net cashflow
- $1,667
Break-even live
UW: 25.0% down · 7.5% · 30yr · 1.5% tax · 5.0% vac · 8.0% maint · 8.0% mgmt
Financing live
Cash to close
- Down payment
- $12,475
- Closing costs
- $1,497
- Reserves months
- —
- Total cash needed
- —
Loan-product check · same deal, 3 products live
Conventional
25% down · 7.5% · 30yr
- Down + closing
- —
- Monthly P&I
- —
- Monthly cashflow
- —
- DSCR
- —
- Eligible?
- —
Personal DTI + credit; lowest rate.
DSCR
20% down · 8.5% · 30yr
- Down + closing
- —
- Monthly P&I
- —
- Monthly cashflow
- —
- DSCR
- —
- Eligible?
- —
No personal income docs; deal must DSCR.
Hard money
10% down · 12.0% · 12mo
- Down + closing
- —
- Monthly P&I
- —
- Monthly cashflow
- —
- DSCR
- —
- Eligible?
- —
Short-term bridge; refi at stabilization.
Rent comps 3 comps
| Address | Beds | Baths | Sqft | Rent | $/sqft | DOM | Units | Dist |
|---|---|---|---|---|---|---|---|---|
| 617 Kane St Hammond, IN | 4.0 | 2.0 | 2146 | $2,300 | $1.07 | 1d | 1 | 0.77mi |
| 4624 Towle Ave Hammond, IN | 4.0 | 2.0 | 1500 | $2,500 | $1.67 | 2d | 1 | 1.43mi |
| 4624 Towle Ave Hammond, IN | 4.0 | 2.0 | 1500 | $2,500 | $1.67 | 1d | 1 | 1.43mi |
Listing history 14 events
-
2026-06-18days on market $49,900 Active 20 DOM
-
2026-06-17days on market $49,900 Active 19 DOM
-
2026-06-16days on market $49,900 Active 18 DOM
-
2026-06-16remarks 501-char remark
-
2026-06-15days on market $49,900 Active 17 DOM
-
2026-06-13days on market $49,900 Active 15 DOM
-
2026-06-09days on market $49,900 Active 11 DOM
-
2026-06-08days on market $49,900 Active 10 DOM
-
2026-06-07days on market $49,900 Active 9 DOM
-
2026-06-04days on market $49,900 Active 6 DOM
-
2026-06-03days on market $49,900 Active 5 DOM
-
2026-06-02days on market $49,900 Active 4 DOM
-
2026-06-01days on market $49,900 Active 3 DOM
-
2026-05-31days on market $49,900 Active 2 DOM
ⓘ Source: listings_history table (triggers on properties + properties_extension) + one-shot
backfill from property_details.listing_events for pre-trigger history.
Climate risk First Street
- Flood 1/10 Low FEMA zone X (unshaded) · 0% chance over 30 yrs
- Wildfire 1/10 Low
- Heat 3/10 Moderate 7 d/yr ≥102°F today · 15 d/yr by 30 yrs out
- Wind 2/10 Low 0% chance of damaging wind over 30 yrs
- Air quality 4/10 Moderate 5 unhealthy d/yr today · 6 by 30 yrs out
Nearby sold comps map
Loading sold comps map…
Walkable amenities ~0.75 mi
Loading nearby amenities…
Taxation est. · year 1
- Rental income
- $30,565
- − Mortgage interest
- −$2,795
- − Property taxes
- −$748
- − Insurance
- −$250
- − Repairs & maintenance
- −$2,445
- − Management
- −$2,445
- − Depreciation
- −$1,452
- Taxable income
- $20,430
- Est. tax owed @ 24.0%
- −$4,903
- After-tax cash flow
- $15,105/yr
For passive investors: Depreciation is non-cash, so a rental often shows a tax loss while cash-flowing — sheltering income. Rental losses are passive: they offset passive income freely, and up to $25,000/yr can offset ordinary (W-2) income if you actively participate and your MAGI is under $100k (phasing out to $0 by $150k); unused losses carry forward. On sale, claimed depreciation is recaptured at up to 25%, and gains may owe capital-gains tax (a 1031 exchange can defer both). Figures are a year-1 estimate at your 24.0% rate — not tax advice; consult a CPA.
Schools (NCES district)
- District
- Thornton Fractional Twp Hsd 215
- NCES district ID
- 1738940
- Math proficiency
- 9% ▼ -3.00%
- Reading proficiency
- 13% ▼ -3.00%
- Median HH income
- $48,207
- Composite
- 10.27/100
- National rank
- #9793
- State rank
- #563 of 620 in IL
Livability — Calumet City
- Score
- 71/100
- State rank
- #330
- US rank
- #6552
Category grades
Schools grade is shown separately in the Schools card above.
Census & demographics
- Census place
- Calumet City, IL
- County
- Cook County · 4,486,803 people
- City population
- 35,100
- Metro
- Chicago-Naperville-Elgin, IL-IN-WI
- Population (ZIP)
- 35,100
- Household income
- $55,369
- Rent vs Own
- Severe rent burden
- 2415.0
Population outlook (Cook County) Hauer SSP2
- Today (2025)
- 5,347,519 people
- By 2030
- 5,357,703 · +0.2%
- By 2040
- 5,324,924 · -0.4%
- By 2050
- 5,230,762 · -2.2%
- By 2075
- 4,785,735 · -10.5%
- By 2100
- 4,188,836 · -21.7%
Race, ethnicity, and origin ACS 2023
- Neighborhood character
- Predominantly Black (74%)
- Race & ethnicity
- Black 74% Hispanic / Latino 15% White 7% Two or more races 4%
- Hispanic origin (detail)
- Mexican 14%
- Common ancestry
- Romanian 2%
- Foreign-born
- 9% · Canada
- Languages at home
- 83% English-only · Spanish 14%
Political lean MEDSL · Cook
- 2024 margin
- Solid D (+42.0) · D 70.4% · R 28.4% · Other 1.2%
- 2008→2024 swing
- -11.4pp toward R · 2008: 53.4pp · 2024: 42.0pp
- All cycles
- 2024: D+42.0 2020: D+50.3 2016: D+53.0 2012: D+49.4 2008: D+53.4
Not yet ingested
- Civics
- —
Market trends
- HPI YoY
- ▼ -75.01%
- Current HPI
- 197.2137
- Rent YoY
- ▲ 6.17%
- Metro
- Chicago-Naperville-Elgin, IL-IN-WI
- State GDP YoY
- ▲ 1.59%
- F500 in state
- 60
Industry mix (Fortune 500 HQ in IL)
| Industry | F500 HQs | Revenue |
|---|---|---|
| Insurance | 4 | $201B |
|
||
| Consumer Goods | 4 | $87B |
|
||
| Industrial Machinery | 3 | $64B |
|
||
| Healthcare | 2 | $55B |
|
||
| Retail / Pharmacy | 1 | $148B |
|
||
| Agriculture / Food | 1 | $86B |
|
||
Price history
-2.2% since first listed49 events — show timeline
- 2026-05-28 Listed $49,900 MRED as Distributed by MLS Grid
- 2026-05-01 Listing Removed — MRED as Distributed by MLS Grid
- 2026-04-04 Listed — MRED as Distributed by MLS Grid
- 2026-03-31 Listing Removed — MRED as Distributed by MLS Grid
- 2026-01-15 Price Changed — MRED as Distributed by MLS Grid
- 2026-01-14 Price Changed — MRED as Distributed by MLS Grid
- 2026-01-14 Relisted — MRED as Distributed by MLS Grid
- 2025-11-24 Contingent — MRED as Distributed by MLS Grid
- 2025-11-21 Relisted — MRED as Distributed by MLS Grid
- 2025-11-07 Contingent — MRED as Distributed by MLS Grid
- 2025-10-03 Listed — MRED as Distributed by MLS Grid
- 2023-06-02 Listing Removed — MRED as Distributed by MLS Grid
- 2023-04-14 Relisted — MRED as Distributed by MLS Grid
- 2023-03-28 Pending — MRED as Distributed by MLS Grid
- 2023-03-27 Relisted — MRED as Distributed by MLS Grid
- 2022-12-07 Pending — MRED as Distributed by MLS Grid
- 2022-10-29 Relisted — MRED as Distributed by MLS Grid
- 2022-10-22 Listing Removed — MRED as Distributed by MLS Grid
- 2022-09-02 Listed — MRED as Distributed by MLS Grid
- 2022-08-31 Listing Removed — MRED as Distributed by MLS Grid
- 2022-08-18 Relisted — MRED as Distributed by MLS Grid
- 2022-08-13 Listing Removed — MRED as Distributed by MLS Grid
- 2022-07-23 Relisted — MRED as Distributed by MLS Grid
- 2022-07-13 Listing Removed — MRED as Distributed by MLS Grid
- 2022-06-24 Price Changed — MRED as Distributed by MLS Grid
- 2022-05-17 Relisted — MRED as Distributed by MLS Grid
- 2022-05-17 Price Changed — MRED as Distributed by MLS Grid
- 2022-03-09 Pending — MRED as Distributed by MLS Grid
- 2022-03-07 Listing Removed — MRED as Distributed by MLS Grid
- 2022-02-21 Relisted — MRED as Distributed by MLS Grid
- 2022-02-20 Listing Removed — MRED as Distributed by MLS Grid
- 2022-02-07 Price Changed — MRED as Distributed by MLS Grid
- 2021-12-17 Listed — MRED as Distributed by MLS Grid
- 2016-10-21 Listing Removed — MRED as Distributed by MLS Grid
- 2016-06-21 Listed — MRED as Distributed by MLS Grid
- 2008-09-19 Sold (MLS) $30,500 MRED as Distributed by MLS Grid
- 2008-08-28 Listing Removed — MRED as Distributed by MLS Grid
- 2008-08-13 Price Changed $29,900 MRED as Distributed by MLS Grid
- 2008-07-25 Price Changed $34,900 MRED as Distributed by MLS Grid
- 2008-07-24 Price Changed $45,900 MRED as Distributed by MLS Grid
- 2008-07-24 Listed $58,900 MRED as Distributed by MLS Grid
- 2008-01-23 Listing Removed — MRED as Distributed by MLS Grid
- 2007-08-27 Listed — MRED as Distributed by MLS Grid
- 2007-08-24 Listing Removed — MRED as Distributed by MLS Grid
- 2007-02-23 Listed — MRED as Distributed by MLS Grid
- 2002-08-13 Sold (Public Records) $97,500 Public Records
- 1997-08-12 Sold (Public Records) $97,000 Public Records
- 1994-11-17 Sold (Public Records) $73,500 Public Records
- 1981-04-01 Sold (Public Records) $51,000 Public Records
Property tax history
+4.0%/yrLatest (2021): $7,317 · +7.2% YoY. Source: county tax records.
Cash-flow waterfall
monthlySold comps — $/sqft
last 12 mo · ≤1 miLoading sold comps…