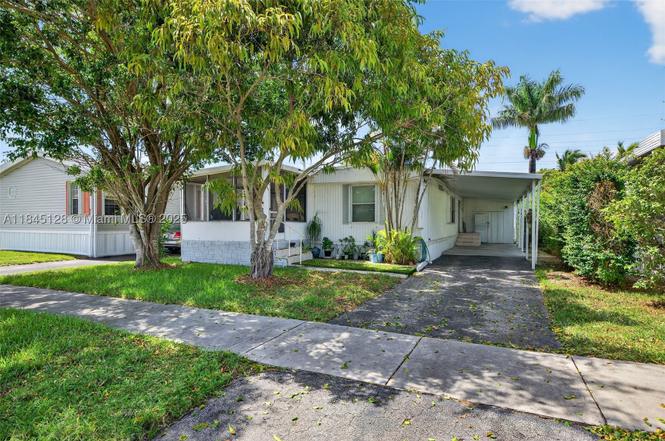
2430 SW 53rd St · Dania Beach, FL
Flood risk 1/10 · Minimal
- FEMA flood zone
- X (shaded)
- Chance of flooding over 30 yrs
- 0.0%
- Est. flood insurance / yr
- $507 – $1,088
Fire risk 1/10 · Minimal
- Est. fire insurance / yr
- $947 – $1,759
Heat risk 10/10 · Severe
- Hot days now (above 105°F)
- 5 days/yr
- Hot days in 30 yrs
- 16 days/yr
Wind risk 10/10 · Severe
- Chance of severe wind over 30 yrs
- 99.0%
Air-quality risk 2/10 · Minimal
- Unhealthy air days now
- 2 days/yr
- Unhealthy air days in 30 yrs
- 2 days/yr
Risk factors via First Street. Map © Google.
Why this score? — see what drove the D grade
The composite is a weighted blend of 9 inputs, each scored 0–100. Each bar is that input's sub-score; the figure is the points it added to the 100-point composite (weight × sub-score).
- Cash flow +12.2/30.0
- ARV discount +7.5/15.0
- Schools +4.1/10.0
- Livability +3.9/5.0
- 1% rule +3.6/10.0
- DSCR +3.6/10.0
- Rent growth +2.8/5.0
- Condition / age +2.5/5.0
- Appreciation +0.0/10.0
$299,900
🖨 Deal sheet 📄 Offer letter ✓ Due diligence
Listing remarks
ONE OF THE BEST LOTS IN ALL OF RAVENSWOOD! ONE OF A FEW PROPERTIES HERE WERE YOU HAVE A NICE BACK LAWN AREA FOR MORE ENJOYMENT. YOU OWN THE LAND HERE AS WELL. THIS IS ONE OF THE NICEST, MOST ESTABLISHED MOBILE HOME PARKS IN ALL OF SOUTH FLORIDA. THIS CAN BE A GREAT PRIMARY RESIDENCE, SEASONAL RESIDENCE, VACATION HOME OR INVESTMENT. THE PROPERTY RIGHT NOW IS TENANT OCCUPIED AT $2000.00 PER MONTH ON LEASE THRU THE END OF AUGUST. TENANTS WILLING TO STAY IF YOU WANT THE INVESTMENT INCOME OR CAN VACATE THEN IF YOU NEED TO OCCUPY. PROPERTY WAS RECENTLY UPDATED WITH NEW FLOORING AND MORE AS OF 2024. THE HOME IS IN GREAT OVERALL CONDITION & THE MOBILE HOME PARK ITS SELF IS IN FANTASTIC SHAPE
Key facts
- Recently updated
- Own the land
- 4,984 sq ft lot
Tags
Property features AI
Finance
- Other: Lot is less than quarter acre; Zoning: RMH; Community-maintained grounds; Mobile home make/model: Striker
- HOA & community: Monthly association fee ($70); Community amenities include pool, clubhouse, pickleball, tennis courts, and on-site property manager
Exterior
- Parking: Attached carport (1 covered space); Driveway
- Utilities: Public water; Public sewer; Cable available
- Home design: Manufactured home; Faces north
- Construction: Manufactured construction; Roof over
- Exterior features: Deck; Porch; Screened porch; Community pool; Pickleball and tennis courts; Clubhouse; Maintained community; Property manager on-site
Interior
- Kitchen: Dishwasher; Electric range; Disposal; Microwave; Refrigerator
- Flooring: Vinyl flooring
- Bathrooms: 2 full bathrooms
- Heating & cooling: Central heating; Central air conditioning
- Interior features: Split bedroom floor plan; Enclosed porch / Florida room; Storage room; Utility room
- Laundry & utility: Washer; Dryer; Laundry room
Neighborhood map
What this means for you Summary
Snapshot
- This is a 2-bed/2.0-bath manufactured listed at $300k.
Deal economics
- At list price, monthly cash flow is $-61 ($-731/yr) — negative.
- To cash-flow at today's rent, offer at most $289k (3.6% below list).
- To meet the 1% rule (rent ≥ 1% of price), the offer needs to be $259k (13.7% below list).
- Recommended offer: $259k (13.7% below list) — sets the bar for 1% rule.
- Cap rate 6.0% vs local median 3.9% in Dania Beach — top-decile yield for the area; either an underpriced asset or a hidden risk that comps aren't pricing in. Stress-test before assuming the spread holds.
Location & tenants
- Location reads 77/100 on livability (#180 in FL, #2,806 nationally) — a middle-class / working-renter tenant base. Strengths: commute A+, cost of living A, housing A; Watch: schools D, employment D, amenities F.
- Broward (suburban): math 42% / reading 53% proficiency, ranked #46 of 73 in FL (top 63%) — families likely to look elsewhere, expect single-tenant / working-renter base with shorter leases.
- Market conditions: Rents rising (+1.3%/yr); 412 active listings in the ZIP; 40 comparable units currently listed for rent nearby; rentals at typical pace (median 18d on market — plan ~3-4 weeks tenant-placement turnaround); solid renter incomes; 2,111 units permitted in Broward County in 2024 (1,265 in 5+ unit buildings).
- This rent runs 41% of the median local income ($76k/yr) — at the standard rent-burdened threshold; future hikes will face affordability resistance.
Forward outlook
- Local home prices are declining (-3.0%/yr); year-one equity from $2k of loan paydown is wiped out by about $9k of value loss. Plan a longer hold.
- Broward County population projected at +34% by 2050 — long-run rental-demand tailwind backs the buy-and-hold thesis.
Negotiation context
- It's been on market 331 days — a 12% lower offer ($264k) is reasonable based on typical stale-listing flexibility.
- Current owner paid $85k; list at $300k implies a 253% gain — meaningful room to come down on a strong offer.
Risks & watch-outs
- Climate carrying-cost: severe wind risk, 99% chance of damaging wind over 30y; extreme-heat days projected 5→16/yr by 2055 (HVAC capex compounding) — expect insurance premiums to compound above CPI over the hold.
Questions for the listing agent
- What do current leases actually rent for vs. the listed asking? Can we see a recent rent roll and the last 12 months of T-12 income?
- It's been on market 331 days. Have you received any prior offers? Is the seller open to a 14% concession, seller financing, or rate buy-down credit?
- What does the HOA fee cover, when was the last increase, and are there any pending special assessments or reserve-fund shortfalls?
- Why hasn't it sold? Are there any deal-killer items the seller is aware of (foundation, flood, title, zoning, code violations)?
- Is there a deadline driving the sale (1031 exchange, divorce, estate, relocation)? That informs how much negotiation room exists.
- Schools are D-rated, which usually means shorter tenancies and higher turnover. Who's the typical renter profile here, and what's been the actual vacancy rate?
- The area grade is low — what's the realistic commute time and amenity access for the typical tenant pool here? Any planned neighborhood developments (good or bad) we should know about?
- What's the average days-on-market for RENTAL listings here right now (not sales)? A rising rental-DOM trend means longer vacancies and softer asking-rent achievability than the comps imply.
- What's the recent tenant-quality profile in this submarket — average credit score on applications, eviction rate, late-payment / NSF rate, and stable-employment percentage? A property-management company in the area should have these aggregated.
- How much new for-sale + rental construction is in the pipeline within 1–3 miles? Heavy new supply typically softens prices + rents 12–24 months out; constrained supply supports both.
Investment metrics
- 1% rule
- 0.86% ✗
- Cap rate
- 6.05%
- Cash-on-cash
- -0.87%
- DSCR
- 0.96
- GRM
- 9.7
CMA / ARV
- ARV (on-the-fly)
- $199,100
- Comps found
- 1
Show comp detail 1 sale within ~0.75 mi
| Address | Dist | Beds/Ba | Sqft | Sold | Price | $/sf | Match |
|---|---|---|---|---|---|---|---|
| 5301 SW 30th Ter | 0.63mi | 2/2.0 | 956 (+6%) | 3mo | $210,000 | $220 | 58 |
Match score weights: distance 35% · size 25% · config 20% · recency 20%. Top-matched comps best support the ARV.
Projected returns pro-forma
-3.0% appreciation · 1.3% rent growth · sell at horizon
- IRR
- -19.7%
- Equity multiple
- 0.32×
- Total profit
- $-56,770
- Equity at exit
- $44,716
- IRR
- -16.6%
- Equity multiple
- 0.15×
- Total profit
- $-71,449
- Equity at exit
- $25,930
Cash invested: $83,972 (down + closing). Projections, not guarantees.
Landlord ↔ Tenant lean methodology
- Overall (STATE)
- 87 Strongly Landlord-Friendly
- State Florida
- 87 Strongly Landlord-Friendly · R+3
- County
- — inherits STATE
- City
- — inherits STATE
ZIP-level market 33312
- Rents YoY
- 1.3%
- Active inventory
- 412
- Price-to-rent
- 9.7×
Monthly cashflow live
- Estimated rent
- $2,587 high interval (Pro) →
- Mortgage (P&I)
- −$1,573
- Tax from tax record
- −$337 /mo · $4,043/yr
- Insurance
- −$125
- HOA
- −$70
- Vacancy / Maint / Mgmt
- −$543
- Net cashflow
- $-61
Break-even live
UW: 25.0% down · 7.5% · 30yr · 1.5% tax · 5.0% vac · 8.0% maint · 8.0% mgmt
Financing live
Cash to close
- Down payment
- $74,975
- Closing costs
- $8,997
- Reserves months
- —
- Total cash needed
- —
Loan-product check · same deal, 3 products live
Conventional
25% down · 7.5% · 30yr
- Down + closing
- —
- Monthly P&I
- —
- Monthly cashflow
- —
- DSCR
- —
- Eligible?
- —
Personal DTI + credit; lowest rate.
DSCR
20% down · 8.5% · 30yr
- Down + closing
- —
- Monthly P&I
- —
- Monthly cashflow
- —
- DSCR
- —
- Eligible?
- —
No personal income docs; deal must DSCR.
Hard money
10% down · 12.0% · 12mo
- Down + closing
- —
- Monthly P&I
- —
- Monthly cashflow
- —
- DSCR
- —
- Eligible?
- —
Short-term bridge; refi at stabilization.
Rent comps 40 comps
| Address | Beds | Baths | Sqft | Rent | $/sqft | DOM | Units | Dist |
|---|---|---|---|---|---|---|---|---|
| 5221 SW 25th Ave Fort Lauderdale, FL | 3.0 | 2.0 | 1084 | $2,700 | $2.49 | 5d | 1 | 0.09mi |
| 2461 SW 50th St Fort Lauderdale, FL | 2.0 | 2.0 | 1008 | $2,300 | $2.28 | 24d | 1 | 0.18mi |
| 2308 Anchor Ct #2703 Fort Lauderdale, FL | 2.0 | 2.5 | 1100 | $2,200 | $2.00 | 24d | 1 | 0.24mi |
| 5597 Park Rd Fort Lauderdale, FL | 3.0 | 2.0 | 1038 | $3,000 | $2.89 | 24d | 1 | 0.35mi |
| 5741 SW 24th Ave Unit A Fort Lauderdale, FL | 3.0 | 2.0 | 1056 | $3,400 | $3.22 | 7d | 1 | 0.37mi |
| 5741 SW 24th Ave Unit A Fort Lauderdale, FL | 3.0 | 2.0 | 1056 | $3,400 | $3.22 | 2d | 1 | 0.37mi |
| 4850 SW 26th Ave Unit 4 Fort Lauderdale, FL | 2.0 | 2.0 | 800 | $2,200 | $2.75 | 10d | 1 | 0.42mi |
| 4940 SW 28th Ter Fort Lauderdale, FL | 2.0 | 1.0 | 640 | $2,000 | $3.12 | 24d | 1 | 0.46mi |
| 2210 Coral Reef Ct Fort Lauderdale, FL | 2.0 | 2.5 | 1083 | $2,475 | $2.29 | 24d | 1 | 0.47mi |
| 4961 SW 28th Ter Unit 2 Fort Lauderdale, FL | 2.0 | 1.0 | 800 | $2,500 | $3.12 | 24d | 1 | 0.47mi |
| 4951 SW 28th Ter Unit 2 Fort Lauderdale, FL | 2.0 | 1.0 | 700 | $2,600 | $3.71 | 24d | 1 | 0.48mi |
| 4910 SW 28th Ter #3 Fort Lauderdale, FL | 1.0 | 1.0 | 650 | $1,699 | $2.61 | 24d | 1 | 0.49mi |
| 2750 Griffin Rd Fort Lauderdale, FL | 1.0 | 1.0 | 811 | $2,600 | $3.21 | 24d | 13 | 0.51mi |
| 5840 Lakeshore Dr Fort Lauderdale, FL | 1.0–3.0 | 1.0–2.0 | 1056 | $3,034 | $2.87 | 1d | 31 | 0.55mi |
| 2915 W Marina Dr Unit 2915 Fort Lauderdale, FL | 1.0 | 1.0 | 1080 | $1,800 | $1.67 | 17d | 1 | 0.58mi |
| 2939 W Marina Dr Fort Lauderdale, FL | 2.0 | 2.0 | 800 | $2,000 | $2.50 | 5d | 1 | 0.62mi |
| 2939 W Marina Dr Fort Lauderdale, FL | 2.0 | 2.0 | 800 | $2,000 | $2.50 | 10d | 1 | 0.62mi |
| 3100 SW 50th St Fort Lauderdale, FL | 2.0 | 1.5 | 1110 | $2,600 | $2.34 | 2d | 1 | 0.74mi |
| 4963 SW 31st Ter Unit 4963 Fort Lauderdale, FL | 2.0 | 2.5 | 1110 | $2,700 | $2.43 | 22d | 1 | 0.79mi |
| 4904 SW 31st Ter Fort Lauderdale, FL | 2.0 | 1.5 | 1110 | $2,400 | $2.16 | 24d | 1 | 0.80mi |
| 4905 SW 31st Ter #115 Fort Lauderdale, FL | 2.0 | 1.5 | 1110 | $2,500 | $2.25 | 24d | 1 | 0.81mi |
| 4991 SW 32nd Ave Unit 4991 Fort Lauderdale, FL | 2.0 | 2.0 | 971 | $2,650 | $2.73 | 7d | 1 | 0.86mi |
| 4923 SW 32nd Ave Fort Lauderdale, FL | 2.0 | 2.0 | 971 | $2,650 | $2.73 | 2d | 1 | 0.91mi |
| 4923 SW 32nd Ave Fort Lauderdale, FL | 2.0 | 2.0 | 971 | $2,800 | $2.88 | 16d | 1 | 0.91mi |
| 121 N Compass Way Dania, FL | 1.0–2.0 | 1.0–2.0 | 871 | $3,010 | $3.45 | 24d | 3 | 0.95mi |
| 5880 SW 32nd Ter Fort Lauderdale, FL | 1.0 | 1.0 | 900 | $1,800 | $2.00 | 24d | 1 | 0.96mi |
| 3265 Griffin Rd #206 Fort Lauderdale, FL | 1.0 | 1.0 | 713 | $1,700 | $2.38 | 17d | 1 | 0.97mi |
| 120 N Compass Way Dania, FL | 1.0–3.0 | 1.0–2.0 | 982 | $2,819 | $2.87 | 24d | 1 | 0.99mi |
| 4732 SW 33rd Ave #206 Fort Lauderdale, FL | 2.0 | 1.0 | 773 | $1,700 | $2.20 | 24d | 1 | 1.00mi |
| 3800 N Hills Dr Hollywood, FL | 1.0–2.0 | 1.5–2.0 | 1068 | $3,200 | $2.99 | 4d | 3 | 1.02mi |
| 3800 N Hills Dr Hollywood, FL | 1.0–2.0 | 1.5–2.0 | 1068 | $3,200 | $2.99 | 1d | 3 | 1.02mi |
| 3800 N Hills Dr Hollywood, FL | 1.0–2.0 | 1.5–2.0 | 1068 | $3,200 | $2.99 | 14d | 4 | 1.02mi |
| 4000 N Hills Dr #30 Hollywood, FL | 1.0 | 1.5 | 833 | $2,000 | $2.40 | 24d | 1 | 1.04mi |
| 3071 SW 45th St Fort Lauderdale, FL | 1.0 | 1.0 | 700 | $2,000 | $2.86 | 16d | 1 | 1.06mi |
| 4621 SW 33rd Ave Unit 1 Fort Lauderdale, FL | 2.0 | 1.0 | 900 | $2,200 | $2.44 | 24d | 1 | 1.10mi |
| 105 NW 14th Way Dania Beach, FL | 2.0 | 1.0 | 650 | $1,795 | $2.76 | 7d | 1 | 1.15mi |
| 150 S Bryan Rd Dania, FL | 3.0 | 1.0–2.0 | 865 | $2,976 | $3.44 | 1d | 25 | 1.15mi |
| 250 NW 14th Way Unit 250 Dania Beach, FL | 3.0 | 1.0 | 1023 | $3,000 | $2.93 | 24d | 1 | 1.15mi |
| 4040 N Hills Dr #25 Hollywood, FL | 1.0 | 1.5 | 833 | $2,100 | $2.52 | 1d | 1 | 1.16mi |
| 2000 Stirling Rd Hollywood, FL | 1.0–3.0 | 1.0–2.0 | 993 | $3,245 | $3.27 | 1d | 19 | 1.20mi |
HOA detail
- Monthly dues
- $70 · $840/yr
Listing history 17 events
-
2026-06-18days on market $299,900 Active 331 DOM
-
2026-06-17days on market $299,900 Active 330 DOM
-
2026-06-16days on market $299,900 Active 329 DOM
-
2026-06-15days on market $299,900 Active 328 DOM
-
2026-06-13days on market $299,900 Active 326 DOM
-
2026-06-09days on market $299,900 Active 322 DOM
-
2026-06-07days on market $299,900 Active 320 DOM
-
2026-06-04days on market $299,900 Active 317 DOM
-
2026-06-03days on market $299,900 Active 316 DOM
-
2026-06-02days on market $299,900 Active 315 DOM
-
2026-06-01days on market $299,900 Active 314 DOM
-
2026-05-31days on market $299,900 Active 313 DOM
-
2025-07-22$299,900 Active
-
2004-08-09soldstatus $85,000
-
2002-08-06soldstatus $65,000
-
1993-05-04soldstatus $45,000
-
1982-12-01soldstatus $17,000
ⓘ Source: listings_history table (triggers on properties + properties_extension) + one-shot
backfill from property_details.listing_events for pre-trigger history.
Tax reassessment forecast FL · Resets to sale price
- Current annual tax
- $4,043 · $337/mo
- Projected year-2 tax
- $4,043 · $337/mo
- Expected delta
- $0/yr ($0/mo · 0.0%)
ⓘ Screening estimate from a state-policy table — verify with the county assessor before closing.
Climate risk First Street
- Flood 1/10 Low FEMA zone X (shaded) · 0% chance over 30 yrs
- Wildfire 1/10 Low
- Heat 10/10 Extreme 5 d/yr ≥105°F today · 16 d/yr by 30 yrs out
- Wind 10/10 Extreme 99% chance of damaging wind over 30 yrs
- Air quality 2/10 Low 2 unhealthy d/yr today · 2 by 30 yrs out
Nearby sold comps map
Loading sold comps map…
Walkable amenities ~0.75 mi
Loading nearby amenities…
Taxation est. · year 1
- Rental income
- $31,043
- − Mortgage interest
- −$16,799
- − Property taxes
- −$4,043
- − Insurance
- −$1,500
- − Repairs & maintenance
- −$2,483
- − Management
- −$2,483
- − HOA
- −$840
- − Depreciation
- −$8,724
- Taxable loss
- −$5,830
- Est. tax savings @ 24.0%
- +$1,399
- After-tax cash flow
- $668/yr
For passive investors: Depreciation is non-cash, so a rental often shows a tax loss while cash-flowing — sheltering income. Rental losses are passive: they offset passive income freely, and up to $25,000/yr can offset ordinary (W-2) income if you actively participate and your MAGI is under $100k (phasing out to $0 by $150k); unused losses carry forward. On sale, claimed depreciation is recaptured at up to 25%, and gains may owe capital-gains tax (a 1031 exchange can defer both). Figures are a year-1 estimate at your 24.0% rate — not tax advice; consult a CPA.
Schools (NCES district)
- District
- Broward
- NCES district ID
- 1200180
- Math proficiency
- 42% ▼ -18.00%
- Reading proficiency
- 53% ▼ -5.00%
- Median HH income
- $52,139
- Composite
- 40.88/100
- National rank
- #3621
- State rank
- #46 of 73 in FL
Livability — Dania Beach
- Score
- 77/100
- State rank
- #180
- US rank
- #2806
Category grades
Schools grade is shown separately in the Schools card above.
Census & demographics
- Census place
- Dania Beach, FL
- County
- Broward County · 1,963,430 people
- City population
- 17,094
- Metro
- Miami-Fort Lauderdale-Pompano Beach, FL
- Population (ZIP)
- 52,798
- Household income
- $75,952
- Rent vs Own
- Severe rent burden
- 1903.0
Population outlook (Broward County) Hauer SSP2
- Today (2025)
- 2,207,033 people
- By 2030
- 2,360,704 · +7.0%
- By 2040
- 2,661,208 · +20.6%
- By 2050
- 2,946,698 · +33.5%
- By 2075
- 3,602,273 · +63.2%
- By 2100
- 3,970,984 · +79.9%
Race, ethnicity, and origin ACS 2023
- Neighborhood character
- Highly diverse neighborhood (Simpson 0.70)
- Race & ethnicity
- White 34% Hispanic / Latino 32% Black 29% Two or more races 20% Asian 2%
- Hispanic origin (detail)
- Mexican 2% Puerto Rican 5% Cuban 6% Salvadoran 1%
- Common ancestry
- Hispanic 6% Romanian 3% Italian 1%
- Foreign-born
- 33% · Canada, Jamaica, Dominican Republic
- Languages at home
- 59% English-only · Spanish 29% French/Haitian/Cajun 7% Other Indo-European 2%
Political lean MEDSL · Broward
- 2024 margin
- D (+17.0) · D 58.0% · R 41.0%
- 2008→2024 swing
- -17.8pp toward R · 2008: 34.7pp · 2024: 17.0pp
- All cycles
- 2024: D+17.0 2020: D+29.8 2016: D+35.0 2012: D+34.9 2008: D+34.7
Not yet ingested
- Civics
- —
Market trends
- HPI YoY
- ▼ -323.99%
- Current HPI
- 382.6298
- Rent YoY
- ▲ 1.30%
- Metro
- Miami-Fort Lauderdale-Pompano Beach, FL
- State GDP YoY
- ▲ 3.28%
- F500 in state
- 36
Industry mix (Fortune 500 HQ in FL)
| Industry | F500 HQs | Revenue |
|---|---|---|
| Industrial Technology | 2 | $29B |
|
||
| Insurance | 2 | $17B |
|
||
| Retail | 1 | $60B |
|
||
| Technology Distribution | 1 | $58B |
|
||
| Homebuilding | 1 | $35B |
|
||
| Technology Manufacturing | 1 | $35B |
|
||
Price history
+1664.1% since first listed5 events — show timeline
- 2025-07-22 Listed $299,900 MARMLS
- 2004-08-09 Sold (Public Records) $85,000 Public Records
- 2002-08-06 Sold (Public Records) $65,000 Public Records
- 1993-05-04 Sold (Public Records) $45,000 Public Records
- 1982-12-01 Sold (Public Records) $17,000 Public Records
Property tax history
+7.5%/yrLatest (2025): $4,043 · +8.1% YoY. Source: county tax records.
Cash-flow waterfall
monthlySold comps — $/sqft
last 12 mo · ≤1 miLoading sold comps…