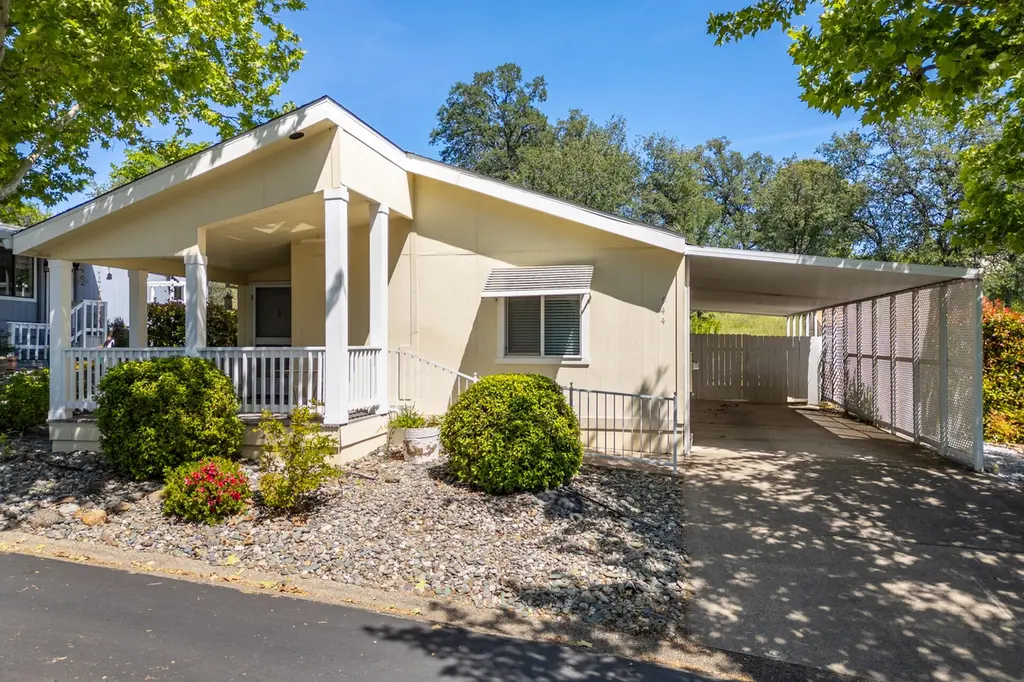
944 Tuberose Trl · Redding, CA
Flood risk 1/10 · Minimal
- FEMA flood zone
- X (unshaded)
- Chance of flooding over 30 yrs
- 0.0%
- Est. flood insurance / yr
- $507 – $1,088
Fire risk 7/10 · Major
- Est. fire insurance / yr
- $659 – $1,223
Heat risk 8/10 · Major
- Hot days now (above 106°F)
- 7 days/yr
- Hot days in 30 yrs
- 18 days/yr
Wind risk 1/10 · Minimal
- Chance of severe wind over 30 yrs
- —
Air-quality risk 10/10 · Severe
- Unhealthy air days now
- 37 days/yr
- Unhealthy air days in 30 yrs
- 40 days/yr
Risk factors via First Street. Map © Google.
Why this score? — see what drove the C grade
The composite is a weighted blend of 9 inputs, each scored 0–100. Each bar is that input's sub-score; the figure is the points it added to the 100-point composite (weight × sub-score).
- Cash flow +24.7/30.0
- DSCR +8.0/10.0
- ARV discount +7.5/15.0
- 1% rule +6.4/10.0
- Rent growth +4.0/5.0
- Livability +3.8/5.0
- Schools +2.5/10.0
- Condition / age +2.5/5.0
- Appreciation +0.0/10.0
$154,900
🖨 Deal sheet (PDF) 📄 Offer letter ✓ Due diligence
Listing remarks MLS
Great home in Los Robles Estates. The home features: 2 bedrooms + office/3rd bedroom, 2 baths and approx 1521 square feet. Large kitchen which is open to the living room and dining area. Other features include: indoor laundry, large covered parking area, covered patio, storage shed and so much more.
Key facts
- Large kitchen
- Covered patio
- Storage shed
Tags
Neighborhood map
What this means for you Summary
Snapshot
- This is a 2-bed/1.0-bath manufactured listed at $155k.
Deal economics
- At list price, monthly cash flow is $324 ($4k/yr) — positive.
- The deal already cash-flows at list — no discount required.
- Meets the 1% rule at list price ($2k rent vs $155k).
- Recommended offer: $146k (6.0% below list) — sets the bar for market timing.
- Cap rate 8.8% vs local median 3.3% in Redding — top-decile yield for the area; either an underpriced asset or a hidden risk that comps aren't pricing in. Stress-test before assuming the spread holds.
Location & tenants
- Location reads 76/100 on livability (#106 in CA, #3,726 nationally) — a middle-class / working-renter tenant base. Strengths: amenities A+, commute A+, health & safety A+; Watch: employment C-, crime F, cost of living F.
- Gateway Unified (suburban): math 25% / reading 35% proficiency, ranked #355 of 517 in CA (top 69%) — families likely to look elsewhere, expect single-tenant / working-renter base with shorter leases.
- Market conditions: Rents rising fast (+6.0%/yr); 393 active listings in the ZIP; 7 comparable units currently listed for rent nearby; rentals at typical pace (median 15d on market — plan ~3-4 weeks tenant-placement turnaround); 43% of comp listings sitting > 30 days — soft ceiling on asking rent; 246 units permitted in Shasta County in 2024 (0 in 5+ unit buildings).
Forward outlook
- Local home prices are declining (-3.0%/yr); year-one equity from $1k of loan paydown is wiped out by about $5k of value loss. Plan a longer hold.
- Shasta County population projected to shrink 9% by 2050 — rents likely to lag national; underwrite the cash flow, not the appreciation.
- At projected returns (-3.0% appreciation + 6.0% rent growth), your $43k cash investment doubles in ~9 years — after that, you're playing with house money.
Negotiation context
- It's been on market 61 days — a 6% lower offer ($146k) is reasonable based on typical stale-listing flexibility.
- 4 sale attempts since 12y ago; this cycle's ask has dropped $10k (6%) from the opening price — seller is motivated, your offer sets the floor, not the list.
- Current owner paid $76k; list at $155k implies a 104% gain — meaningful room to come down on a strong offer.
Risks & watch-outs
- Climate carrying-cost: major wildfire risk; extreme-heat days projected 7→18/yr by 2055 (HVAC capex compounding) — expect insurance premiums to compound above CPI over the hold.
Questions for the listing agent
- It's been on market 61 days. Have you received any prior offers? Is the seller open to a 6% concession, seller financing, or rate buy-down credit?
- Why hasn't it sold? Are there any deal-killer items the seller is aware of (foundation, flood, title, zoning, code violations)?
- Is there a deadline driving the sale (1031 exchange, divorce, estate, relocation)? That informs how much negotiation room exists.
- Schools are B-rated — typically a magnet for longer-tenancy family renters. What's the average tenant stay here, and is there a school-zone premium baked into asking?
- Crime grade is F in this area — have there been break-ins, vandalism, or insurance claims at this property in the last 3 years? What carrier currently insures it and at what premium?
- What's the average days-on-market for RENTAL listings here right now (not sales)? A rising rental-DOM trend means longer vacancies and softer asking-rent achievability than the comps imply.
- What's the recent tenant-quality profile in this submarket — average credit score on applications, eviction rate, late-payment / NSF rate, and stable-employment percentage? A property-management company in the area should have these aggregated.
- How much new for-sale + rental construction is in the pipeline within 1–3 miles? Heavy new supply typically softens prices + rents 12–24 months out; constrained supply supports both.
Investment metrics
- 1% rule
- 1.14% ✓
- Cap rate
- 8.80%
- Cash-on-cash
- 8.96%
- DSCR
- 1.40
- GRM
- 7.3
CMA / ARV
- ARV (median comp)
- $94,273
- List price
- $154,900
- Delta
- 64.31%
- Verdict
- OVERPRICED
- Comps
- 20 within 1.0 mi
Show comp detail 12 sales within ~0.75 mi
| Address | Dist | Beds/Ba | Sqft | Sold | Price | $/sf | Match |
|---|---|---|---|---|---|---|---|
| 4719 Maple Trl | 0.07mi | 3/2.0 (+1) | 1,520 (-0%) | 3mo | $181,500 | $119 | 85 |
| 899 Tuberose Trl | 0.06mi | 3/2.0 (+1) | 1,560 (+3%) | 5mo | $99,180 | $64 | 80 |
| 4532 Hardwood Blvd #195 | 0.28mi | 2/2.0 | 1,600 (+5%) | 3mo | $76,000 | $48 | 72 |
| 470 Brushwood Dr #139 | 0.25mi | 2/2.0 | 1,632 (+7%) | 6mo | $98,000 | $60 | 68 |
| 4649 Underwood Dr #257 | 0.40mi | 3/2.0 (+1) | 1,536 (+1%) | 4mo | $75,000 | $49 | 67 |
| 4555 Underwood Dr | 0.41mi | 2/2.0 | 1,440 (-5%) | 1mo | $99,000 | $69 | 67 |
| 1350 Aztec Path #229 | 0.38mi | 2/2.0 | 1,456 (-4%) | 6mo | $95,000 | $65 | 66 |
| 301 Sapwood Dr #280 | 0.39mi | 2/2.0 | 1,440 (-5%) | 4mo | $65,900 | $46 | 66 |
| 323 Sapwood Dr Sp# 279 Dr | 0.38mi | 2/2.0 | 1,440 (-5%) | 4mo | $89,000 | $62 | 66 |
| 458 Balsawood Dr | 0.27mi | 2/2.0 | 1,344 (-12%) | 1mo | $60,000 | $45 | 63 |
| 4726 Maple Trl | 0.06mi | 3/2.0 (+1) | 1,716 (+13%) | 7mo | $148,000 | $86 | 61 |
| 1401 Menomenee Ln #281 | 0.21mi | 3/2.0 (+1) | 1,680 (+10%) | 5mo | $71,000 | $42 | 60 |
Match score weights: distance 35% · size 25% · config 20% · recency 20%. Top-matched comps best support the ARV.
Projected returns pro-forma
-3.0% appreciation · 5.98% rent growth · sell at horizon
- IRR
- 0.6%
- Equity multiple
- 1.02×
- Total profit
- $1,006
- Equity at exit
- $23,096
- IRR
- 13.1%
- Equity multiple
- 2.18×
- Total profit
- $51,325
- Equity at exit
- $13,393
Cash invested: $43,372 (down + closing). Projections, not guarantees.
Landlord ↔ Tenant lean methodology
- Overall (STATE)
- 18 Strongly Tenant-Friendly
- State California
- 18 Strongly Tenant-Friendly · D+13
- County
- — inherits STATE
- City
- — inherits STATE
ZIP-level market 96003
- Rents YoY
- 6.0%
- Active inventory
- 393
- Price-to-rent
- 7.3×
Monthly cashflow live
- Estimated rent
- $1,765 high interval (Pro) →
- Mortgage (P&I)
- −$812
- Tax est. 1.5%
- −$194 /mo · $2,324/yr
- Insurance
- −$65
- HOA
- −$0
- Vacancy / Maint / Mgmt
- −$371
- Net cashflow
- $324
Break-even live
Sensitivity live
| Price | -10% $431 | -5% $377 | +0% $324 | +5% $270 | +10% $217 |
|---|---|---|---|---|---|
| Rent | -10% $184 | -5% $254 | +0% $324 | +5% $394 | +10% $463 |
| Rate | -1.0pp $402 | -0.5pp $363 | base $324 | +0.5pp $284 | +1.0pp $243 |
UW: 25.0% down · 7.5% · 30yr · 1.5% tax · 5.0% vac · 8.0% maint · 8.0% mgmt
Financing live
Cash to close
- Down payment
- $38,725
- Closing costs
- $4,647
- Reserves months
- —
- Total cash needed
- —
Loan-product check · same deal, 3 products live
Conventional
25% down · 7.5% · 30yr
- Down + closing
- —
- Monthly P&I
- —
- Monthly cashflow
- —
- DSCR
- —
- Eligible?
- —
Personal DTI + credit; lowest rate.
DSCR
20% down · 8.5% · 30yr
- Down + closing
- —
- Monthly P&I
- —
- Monthly cashflow
- —
- DSCR
- —
- Eligible?
- —
No personal income docs; deal must DSCR.
Hard money
10% down · 12.0% · 12mo
- Down + closing
- —
- Monthly P&I
- —
- Monthly cashflow
- —
- DSCR
- —
- Eligible?
- —
Short-term bridge; refi at stabilization.
Rent comps 7 comps
| Address | Beds | Baths | Sqft | Rent | $/sqft | DOM | Units | Dist |
|---|---|---|---|---|---|---|---|---|
| 701 Redwood Blvd Redding, CA | 2.0 | 1.5–2.5 | 1163 | $1,820 | $1.56 | 14d | 1 | 0.23mi |
| 4433 White River Dr Redding, CA | 2.0 | 2.0 | 1100 | $1,500 | $1.36 | 45d | 1 | 0.29mi |
| 5391 Stonethrow Ct Redding, CA | 3.0 | 2.0 | 1100 | $1,895 | $1.72 | 45d | 1 | 0.62mi |
| 636 Lake Blvd Redding, CA | 2.0–3.0 | 1.0–2.0 | 986 | $1,295 | $1.31 | 14d | 8 | 0.71mi |
| 3465 Magnums Way Apt 2 Redding, CA | 3.0 | 2.0 | 1080 | $1,775 | $1.64 | 45d | 1 | 1.21mi |
| 6053 Fallworth Dr Redding, CA | 3.0 | 2.0 | 1622 | $2,650 | $1.63 | 14d | 1 | 1.30mi |
| 6073 Fallworth Dr Redding, CA | 3.0 | 2.0 | 1622 | $2,650 | $1.63 | 14d | 1 | 1.31mi |
Listing history 22 events
-
2026-06-21days on market $154,900 Active 61 DOM
-
2026-06-19days on market $154,900 Active 59 DOM
-
2026-06-18days on market $154,900 Active 58 DOM
-
2026-06-17days on market $154,900 Active 57 DOM
-
2026-06-16days on market $154,900 Active 56 DOM
-
2026-06-15days on market $154,900 Active 55 DOM
-
2026-06-14days on market $154,900 Active 53 DOM
-
2026-06-13days on market $154,900 Active 52 DOM
-
2026-06-10days on market $154,900 Active 50 DOM
-
2026-06-09days on market $154,900 Active 49 DOM
-
2026-06-08days on market $154,900 Active 48 DOM
-
2026-06-07pricedays on market $154,900 Active 47 DOM
-
2026-06-03days on market $164,900 Active 43 DOM
-
2026-06-02days on market $164,900 Active 42 DOM
-
2026-06-01days on market $164,900 Active 41 DOM
-
2026-05-31days on market $164,900 Active 40 DOM
-
2026-05-30days on market $164,900 Active 39 DOM
-
2026-04-21$164,900 Active 300-char remark
Show marketing remark (300 chars)
Great home in Los Robles Estates. The home features: 2 bedrooms + office/3rd bedroom, 2 baths and approx 1521 square feet. Large kitchen which is open to the living room and dining area. Other features include: indoor laundry, large covered parking area, covered patio, storage shed and so much more.
-
2015-06-05soldstatus $76,000 368-char remark
Show marketing remark (368 chars)
This 2 bed/2 bath plus Den will make you never want to leave. Beautiful open floor plan, cathedral ceilings, spacious dining room and of course a large kitchen to satisfy everyone. Both bedrooms have walk in closets. Indoor laundry. Step out back door to your entertainers delight patio area. Located in a senior park just minutes from shopping & transportation.
-
2015-02-17$79,500 368-char remark
Show marketing remark (368 chars)
This 2 bed/2 bath plus Den will make you never want to leave. Beautiful open floor plan, cathedral ceilings, spacious dining room and of course a large kitchen to satisfy everyone. Both bedrooms have walk in closets. Indoor laundry. Step out back door to your entertainers delight patio area. Located in a senior park just minutes from shopping & transportation.
-
2014-10-06$85,500
-
2014-09-01$85,500
ⓘ Source: listings_history table (triggers on properties + properties_extension) + one-shot
backfill from property_details.listing_events for pre-trigger history.
Climate risk First Street
- Flood 1/10 Low FEMA zone X (unshaded) · 0% chance over 30 yrs
- Wildfire 7/10 Severe
- Heat 8/10 Severe 7 d/yr ≥106°F today · 18 d/yr by 30 yrs out
- Wind 1/10 Low
- Air quality 10/10 Extreme 37 unhealthy d/yr today · 40 by 30 yrs out
Nearby sold comps map
Loading sold comps map…
Walkable amenities ~0.75 mi
Loading nearby amenities…
Taxation est. · year 1
- Rental income
- $21,181
- − Mortgage interest
- −$8,677
- − Property taxes
- −$2,324
- − Insurance
- −$774
- − Repairs & maintenance
- −$1,694
- − Management
- −$1,694
- − Depreciation
- −$4,506
- Taxable income
- $1,511
- Est. tax owed @ 24.0%
- −$363
- After-tax cash flow
- $3,524/yr
For passive investors: Depreciation is non-cash, so a rental often shows a tax loss while cash-flowing — sheltering income. Rental losses are passive: they offset passive income freely, and up to $25,000/yr can offset ordinary (W-2) income if you actively participate and your MAGI is under $100k (phasing out to $0 by $150k); unused losses carry forward. On sale, claimed depreciation is recaptured at up to 25%, and gains may owe capital-gains tax (a 1031 exchange can defer both). Figures are a year-1 estimate at your 24.0% rate — not tax advice; consult a CPA.
Schools (NCES district)
- District
- Gateway Unified
- NCES district ID
- 0614950
- Math proficiency
- 25% ▼ -5.00%
- Reading proficiency
- 35% ▲ 2.00%
- Median HH income
- $41,888
- Composite
- 25.39/100
- National rank
- #7465
- State rank
- #355 of 517 in CA
Livability — Redding
- Score
- 76/100
- State rank
- #106
- US rank
- #3726
Category grades
Schools grade is shown separately in the Schools card above.
Census & demographics
- Census place
- Redding, CA
- County
- Shasta County · 147,641 people
- Metro
- Redding, CA
- Population (ZIP)
- 44,923
- Household income
- $72,445
- Rent vs Own
- Severe rent burden
- 1668.0
Population outlook (Shasta County) Hauer SSP2
- Today (2025)
- 179,231 people
- By 2030
- 176,953 · -1.3%
- By 2040
- 169,982 · -5.2%
- By 2050
- 162,547 · -9.3%
- By 2075
- 145,649 · -18.7%
- By 2100
- 123,025 · -31.4%
Race, ethnicity, and origin ACS 2023
- Neighborhood character
- Predominantly White (76%)
- Race & ethnicity
- White 76% Hispanic / Latino 11% Two or more races 10% Asian 4% Native American 1% Black 1%
- Hispanic origin (detail)
- Mexican 7%
- Common ancestry
- Italian 5% Slovak 3% Lithuanian 3%
- Foreign-born
- 6% · Canada, China
- Languages at home
- 92% English-only · Spanish 3% German/W. Germanic 1% Other Asian/Pacific 1%
Political lean MEDSL · Shasta
- 2024 margin
- Solid R (+36.5) · D 30.5% · R 67.0% · Other 2.5%
- 2008→2024 swing
- -10.7pp toward R · 2008: -25.8pp · 2024: -36.5pp
- All cycles
- 2024: R+36.5 2020: R+33.1 2016: R+37.4 2012: R+30.3 2008: R+25.8
Not yet ingested
- Civics
- —
Market trends
- HPI YoY
- ▼ -181.66%
- Current HPI
- 152.3069
- Rent YoY
- ▲ 5.98%
- Metro
- Redding, CA
- State GDP YoY
- ▲ 3.21%
- F500 in state
- 116
Industry mix (Fortune 500 HQ in CA)
| Industry | F500 HQs | Revenue |
|---|---|---|
| Technology | 27 | $1,492B |
|
||
| Financial Services | 3 | $174B |
|
||
| Retail | 3 | $44B |
|
||
| Insurance | 3 | $26B |
|
||
| Media / Entertainment | 2 | $115B |
|
||
| Pharmaceuticals / Biotech | 2 | $62B |
|
||
Price history
+92.9% since first listed5 events — show timeline
- 2026-04-21 Listed $164,900 SAOR
- 2015-06-05 Sold (MLS) $76,000 SAOR
- 2015-02-17 Listed $79,500 SAOR
- 2014-10-06 Listed $85,500 SAOR
- 2014-09-01 Listed $85,500 SAOR
Property tax history
-5.7%/yrLatest (2020): $260 · +1.2% YoY. Source: county tax records.
Cash-flow waterfall
monthlySold comps — $/sqft
last 12 mo · ≤1 miLoading sold comps…