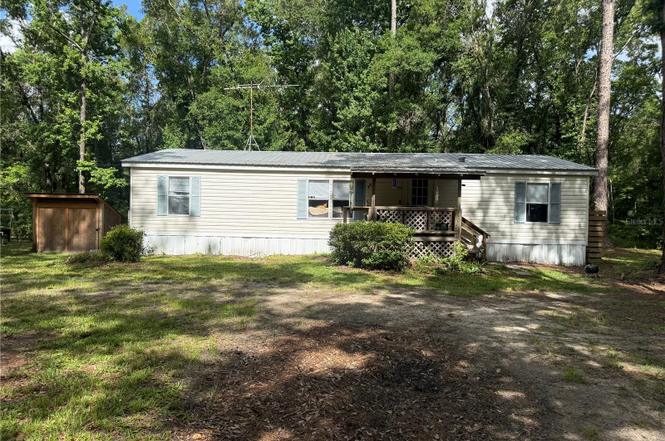
10225 Weatherby Ave · Flagler Estates, FL
Flood risk 3/10 · Minor
- FEMA flood zone
- X (unshaded)
- Chance of flooding over 30 yrs
- 0.2%
- Est. flood insurance / yr
- $507 – $1,088
Fire risk 7/10 · Major
- Est. fire insurance / yr
- $947 – $1,759
Heat risk 9/10 · Severe
- Hot days now (above 107°F)
- 7 days/yr
- Hot days in 30 yrs
- 20 days/yr
Wind risk 9/10 · Severe
- Chance of severe wind over 30 yrs
- 99.0%
Air-quality risk 2/10 · Minimal
- Unhealthy air days now
- 2 days/yr
- Unhealthy air days in 30 yrs
- 2 days/yr
Risk factors via First Street. Map © Google.
Why this score? — see what drove the C grade
The composite is a weighted blend of 9 inputs, each scored 0–100. Each bar is that input's sub-score; the figure is the points it added to the 100-point composite (weight × sub-score).
- Cash flow +17.4/30.0
- Appreciation +10.0/10.0
- ARV discount +7.3/15.0
- Schools +6.4/10.0
- DSCR +5.4/10.0
- 1% rule +3.4/10.0
- Livability +3.1/5.0
- Rent growth +2.5/5.0
- Condition / age +2.5/5.0
$219,900
🖨 Deal sheet 📄 Offer letter ✓ Due diligence
Listing remarks MLS
PRICED TO SELL!! Spacious 4 bed 2 bed newly updated and move in ready! This home is on 1.14 acres with mature trees, ample parking space and privacy. The kitchen features stainless steel appliances, food prep island, and all granite counter tops throughout kitchen and bathrooms. Beautiful vinyl flooring through out the home with new luscious carpet in the bedrooms. Out back there is a storage shed going with the property also so bring all your toys and tools! With all the updates, new lighting package and fresh designer paint this lovely space is ready to be called home.
Key facts
- Fully fenced acres
- Modern kitchen
- Granite countertops
Tags
Property features AI
Finance
- Other: Unfurnished; Directions: Follow GPS
- Financial info: No lease restrictions indicated
- HOA & community: No association indicated
Exterior
- Parking: Carport with 2 spaces
- Utilities: Water from a well; Septic tank; Other utilities (unspecified)
- Home design: Manufactured double-wide home; Single-story (one level); Home faces east
- Construction: Vinyl siding; Metal roof; Foundation listed as 'Other'; Built as a manufactured home (double wide)
- Exterior features: Gravel road access; 1.14-acre parcel (approximately); Lot is zoned residential; Homestead indicated
Interior
- Kitchen: Dishwasher
- Bedrooms: 4 bedrooms
- Bathrooms: 2 full bathrooms
- Heating & cooling: Central heating; Central air
- Interior features: Central heating; Central air conditioning; Additional interior features listed as 'Other'
- Laundry & utility: Laundry room; Washer; Dryer
Neighborhood map
What this means for you Summary
Snapshot
- This is a 4-bed/2.0-bath manufactured listed at $220k.
Deal economics
- At list price, monthly cash flow is $163 ($2k/yr) — positive.
- The deal already cash-flows at list — no discount required.
- To meet the 1% rule (rent ≥ 1% of price), the offer needs to be $184k (16.4% below list).
- Recommended offer: $184k (16.4% below list) — sets the bar for 1% rule.
- Cap rate 7.2% vs local median 4.0% in Flagler Estates — top-decile yield for the area; either an underpriced asset or a hidden risk that comps aren't pricing in. Stress-test before assuming the spread holds.
Location & tenants
- Location reads 62/100 on livability (#763 in FL) — a middle-class / working-renter tenant base. Strengths: cost of living A+, housing A+, crime A-; Watch: health & safety C-, schools F, amenities F.
- St. Johns (rural): math 75% / reading 73% proficiency, ranked #2 of 73 in FL (top 3%) — strong family-tenant draw, lease renewals of 3-5y typical; only 20% free/reduced lunch — higher-income household profile.
- Market conditions: 234 active listings in the ZIP; 5,575 units permitted in St. Johns County in 2024 (584 in 5+ unit buildings).
Forward outlook
- In year one you build about $24k of equity ($2k loan paydown + $22k appreciation (10.0% local appreciation)).
- St. Johns County population projected at +60% by 2050 — long-run rental-demand tailwind backs the buy-and-hold thesis.
- At projected returns (10.0% appreciation + 3.0% rent growth), your $62k cash investment doubles in ~3 years — after that, you're playing with house money.
- By year 2, paydown + projected appreciation supports a ~$38k cash-out refi (75% LTV) — recoverable capital for the next deal without selling this one.
Negotiation context
- Only 5 days on market — expect competitive offers; lowballing is unlikely to land.
- 2 sale attempts since 3y ago with the ask held roughly flat each time — persistent listings suggest the price (not the market) is what's stuck; bring a comps-based counter.
- Current owner paid $185k; 19% above their basis — modest negotiation headroom, anchor on the comps not their cost.
Risks & watch-outs
- Climate carrying-cost: severe wind risk, 99% chance of damaging wind over 30y; major wildfire risk; extreme-heat days projected 7→20/yr by 2055 (HVAC capex compounding) — expect insurance premiums to compound above CPI over the hold.
Questions for the listing agent
- Is there a deadline driving the sale (1031 exchange, divorce, estate, relocation)? That informs how much negotiation room exists.
- Schools are F-rated, which usually means shorter tenancies and higher turnover. Who's the typical renter profile here, and what's been the actual vacancy rate?
- What's the average days-on-market for RENTAL listings here right now (not sales)? A rising rental-DOM trend means longer vacancies and softer asking-rent achievability than the comps imply.
- What's the recent tenant-quality profile in this submarket — average credit score on applications, eviction rate, late-payment / NSF rate, and stable-employment percentage? A property-management company in the area should have these aggregated.
- How much new for-sale + rental construction is in the pipeline within 1–3 miles? Heavy new supply typically softens prices + rents 12–24 months out; constrained supply supports both.
Investment metrics
- 1% rule
- 0.84% ✗
- Cap rate
- 7.18%
- Cash-on-cash
- 3.18%
- DSCR
- 1.14
- GRM
- 10.0
CMA / ARV
- ARV (on-the-fly)
- $219,024
- Comps found
- 6
Show comp detail 6 sales within ~0.75 mi
| Address | Dist | Beds/Ba | Sqft | Sold | Price | $/sf | Match |
|---|---|---|---|---|---|---|---|
| 10350 Beckenger Ave | 0.56mi | 3/2.0 (-1) | 1,512 (+8%) | 2mo | $215,000 | $142 | 54 |
| 10240 Carpenter Ave | 0.59mi | 3/2.0 (-1) | 1,296 (-8%) | 4mo | $204,000 | $157 | 51 |
| 4865 Olaf St | 0.62mi | 3/2.0 (-1) | 1,458 (+4%) | 12mo | $190,000 | $130 | 50 |
| 10020 Vaughan Ave | 0.50mi | 3/2.0 (-1) | 1,600 (+14%) | 2mo | $249,900 | $156 | 47 |
| 10335 Ruth Ave | 0.67mi | 3/2.0 (-1) | 1,568 (+12%) | 3mo | $193,000 | $123 | 41 |
| 10465 Underwood Ave | 0.69mi | 3/2.0 (-1) | 1,216 (-13%) | 7mo | $240,000 | $197 | 34 |
Match score weights: distance 35% · size 25% · config 20% · recency 20%. Top-matched comps best support the ARV.
Projected returns pro-forma
10.0% appreciation · 3.0% rent growth · sell at horizon
- IRR
- 26.6%
- Equity multiple
- 3.11×
- Total profit
- $130,048
- Equity at exit
- $198,103
- IRR
- 23.3%
- Equity multiple
- 7.08×
- Total profit
- $374,566
- Equity at exit
- $427,217
Cash invested: $61,572 (down + closing). Projections, not guarantees.
Landlord ↔ Tenant lean methodology
- Overall (STATE)
- 87 Strongly Landlord-Friendly
- State Florida
- 87 Strongly Landlord-Friendly · R+3
- County
- — inherits STATE
- City
- — inherits STATE
ZIP-level market 32145
- Home prices YoY
- 19.1%
- Active inventory
- 234
- Price-to-rent
- 10.0×
Monthly cashflow live
- Estimated rent
- $1,839 medium interval (Pro) →
- Mortgage (P&I)
- −$1,153
- Tax from tax record
- −$45 /mo · $539/yr
- Insurance
- −$92
- HOA
- −$0
- Vacancy / Maint / Mgmt
- −$386
- Net cashflow
- $163
Break-even live
UW: 25.0% down · 7.5% · 30yr · 1.5% tax · 5.0% vac · 8.0% maint · 8.0% mgmt
Financing live
Cash to close
- Down payment
- $54,975
- Closing costs
- $6,597
- Reserves months
- —
- Total cash needed
- —
Loan-product check · same deal, 3 products live
Conventional
25% down · 7.5% · 30yr
- Down + closing
- —
- Monthly P&I
- —
- Monthly cashflow
- —
- DSCR
- —
- Eligible?
- —
Personal DTI + credit; lowest rate.
DSCR
20% down · 8.5% · 30yr
- Down + closing
- —
- Monthly P&I
- —
- Monthly cashflow
- —
- DSCR
- —
- Eligible?
- —
No personal income docs; deal must DSCR.
Hard money
10% down · 12.0% · 12mo
- Down + closing
- —
- Monthly P&I
- —
- Monthly cashflow
- —
- DSCR
- —
- Eligible?
- —
Short-term bridge; refi at stabilization.
Listing history 5 events
-
2026-06-18days on market $219,900 Active 5 DOM
-
2026-06-17days on market $219,900 Active 4 DOM
-
2026-06-16days on market $219,900 Active 3 DOM
-
2026-06-15remarks 693-char remark
-
2026-06-15$219,900 Active 2 DOM
ⓘ Source: listings_history table (triggers on properties + properties_extension) + one-shot
backfill from property_details.listing_events for pre-trigger history.
Tax reassessment forecast FL · Resets to sale price
- Current annual tax
- $539 · $45/mo
- Projected year-2 tax
- $1,825 · $152/mo
- Expected delta
- +$1,286/yr (+$107/mo · 238.6%)
ⓘ Screening estimate from a state-policy table — verify with the county assessor before closing.
Climate risk First Street
- Flood 3/10 Moderate FEMA zone X (unshaded) · 20% chance over 30 yrs
- Wildfire 7/10 Severe
- Heat 9/10 Extreme 7 d/yr ≥107°F today · 20 d/yr by 30 yrs out
- Wind 9/10 Extreme 99% chance of damaging wind over 30 yrs
- Air quality 2/10 Low 2 unhealthy d/yr today · 2 by 30 yrs out
Nearby sold comps map
Loading sold comps map…
Walkable amenities ~0.75 mi
Loading nearby amenities…
Taxation est. · year 1
- Rental income
- $22,071
- − Mortgage interest
- −$12,318
- − Property taxes
- −$539
- − Insurance
- −$1,100
- − Repairs & maintenance
- −$1,766
- − Management
- −$1,766
- − Depreciation
- −$6,397
- Taxable loss
- −$1,814
- Est. tax savings @ 24.0%
- +$435
- After-tax cash flow
- $2,394/yr
For passive investors: Depreciation is non-cash, so a rental often shows a tax loss while cash-flowing — sheltering income. Rental losses are passive: they offset passive income freely, and up to $25,000/yr can offset ordinary (W-2) income if you actively participate and your MAGI is under $100k (phasing out to $0 by $150k); unused losses carry forward. On sale, claimed depreciation is recaptured at up to 25%, and gains may owe capital-gains tax (a 1031 exchange can defer both). Figures are a year-1 estimate at your 24.0% rate — not tax advice; consult a CPA.
Schools (NCES district)
- District
- St. Johns
- NCES district ID
- 1201740
- Math proficiency
- 75% ▼ -5.00%
- Reading proficiency
- 73% ▼ -2.00%
- Median HH income
- $66,842
- Composite
- 64.31/100
- National rank
- #556
- State rank
- #2 of 73 in FL
Livability — Flagler Estates
- Score
- 62/100
- State rank
- #763
- US rank
- #16863
Category grades
Schools grade is shown separately in the Schools card above.
Census & demographics
- Census place
- Flagler Estates, FL
- Population (ZIP)
- 5,750
Population outlook (St. Johns County) Hauer SSP2
- Today (2025)
- 303,941 people
- By 2030
- 342,590 · +12.7%
- By 2040
- 417,328 · +37.3%
- By 2050
- 487,011 · +60.2%
- By 2075
- 635,395 · +109.1%
- By 2100
- 717,469 · +136.1%
Race, ethnicity, and origin ACS 2023
- Neighborhood character
- Predominantly White (76%)
- Race & ethnicity
- White 76% Two or more races 16% Hispanic / Latino 9% Black 7%
- Hispanic origin (detail)
- Mexican 8%
- Common ancestry
- Lithuanian 3% Romanian 3% Estonian 3%
- Foreign-born
- 12% · Canada
- Languages at home
- 86% English-only · Spanish 9% Other Indo-European 5%
Political lean MEDSL · St. Johns
- 2024 margin
- Solid R (+31.4) · D 33.9% · R 65.2%
- 2008→2024 swing
- +0.2pp no change · 2008: -31.6pp · 2024: -31.4pp
- All cycles
- 2024: R+31.4 2020: R+26.7 2016: R+33.4 2012: R+37.8 2008: R+31.6
Not yet ingested
- Civics
- —
Market trends
- HPI YoY
- ▲ 40.24%
- Current HPI
- 250.8035
- Rent YoY
- —
- Metro
- —
- State GDP YoY
- ▲ 3.28%
- F500 in state
- 36
Industry mix (Fortune 500 HQ in FL)
| Industry | F500 HQs | Revenue |
|---|---|---|
| Industrial Technology | 2 | $29B |
|
||
| Insurance | 2 | $17B |
|
||
| Retail | 1 | $60B |
|
||
| Technology Distribution | 1 | $58B |
|
||
| Homebuilding | 1 | $35B |
|
||
| Technology Manufacturing | 1 | $35B |
|
||
Price history
+144.3% since first listed6 events — show timeline
- 2026-06-13 Listed $219,900 Stellar MLS as Distributed by MLS Grid
- 2023-12-27 Sold (Public Records) $185,000 Public Records
- 2023-12-22 Sold (MLS) $185,000 realMLS
- 2023-12-15 Pending — realMLS
- 2023-12-01 Listed $189,900 realMLS
- 2023-09-12 Sold (Public Records) $90,000 Public Records
Property tax history
+2.6%/yrLatest (2023): $539 · +16.2% YoY. Source: county tax records.
Cash-flow waterfall
monthlySold comps — $/sqft
last 12 mo · ≤1 miLoading sold comps…