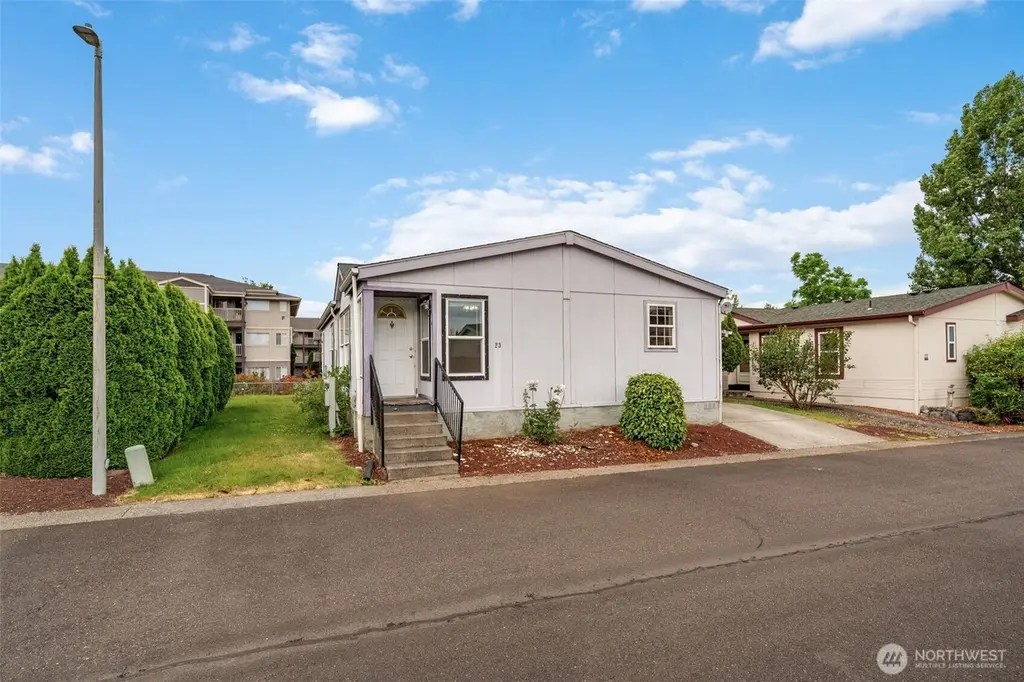
1805 NE 94th St #23 · Hazel Dell, WA
Flood risk No data
- FEMA flood zone
- —
- Chance of flooding over 30 yrs
- —
- Est. flood insurance / yr
- —
Fire risk No data
- Est. fire insurance / yr
- —
Heat risk No data
- Hot days now (above threshold)
- —
- Hot days in 30 yrs
- —
Wind risk No data
- Chance of severe wind over 30 yrs
- —
Air-quality risk No data
- Unhealthy air days now
- —
- Unhealthy air days in 30 yrs
- —
Risk factors via First Street. Map © Google.
Why this score? — see what drove the B+ grade
The composite is a weighted blend of 9 inputs, each scored 0–100. Each bar is that input's sub-score; the figure is the points it added to the 100-point composite (weight × sub-score).
- Cash flow +30.0/30.0
- ARV discount +15.0/15.0
- 1% rule +10.0/10.0
- DSCR +10.0/10.0
- Schools +4.3/10.0
- Livability +4.1/5.0
- Rent growth +3.0/5.0
- Condition / age +2.5/5.0
- Appreciation +0.0/10.0
$79,950
🖨 Deal sheet 📄 Offer letter ✓ Due diligence
Listing remarks
Spacious and partially furnished, this well-maintained home offers comfort, functionality, and exceptional value in a peaceful 55+ community with low space rent that includes sewer service. Featuring 2 bedrooms and 2 bathrooms, the home boasts a large, open living area perfect for relaxing or entertaining. The bright eat-in kitchen offers ample cabinet and counter space, while the primary suite provides a private retreat with an ensuite bath. Enjoy the convenience of an attached garage, dedicated laundry area, and abundant storage throughout. Outside, you'll find a low-maintenance yard and a welcoming setting in a quiet, friendly neighborhood. Perfect for those seeking affordable, easy livi
Key facts
- Well maintained home
- Attached garage
- Abundant storage
Tags
Property features AI
Finance
- Other: Calculated building area: 1300 square feet; Double pane windows listed as energy efficient
- Financial info: Land lease: $776; Listing terms: Cash
- HOA & community: Located in a senior community; Pets allowed: cats and dogs; Situated in Cypress Park (park name)
Exterior
- Parking: Individual garage (has garage)
- Utilities: Public water; Electric service
- Home design: Manufactured double-wide home; Single story; Fleetwood make; Has view; Electric energy source
- Construction: Wood construction; Composition roof; Slab foundation; Manufactured house structure
- Exterior features: Wood exterior products
Interior
- Kitchen: Dishwasher; Double oven; Garbage disposal; Range / Stove; Refrigerator
- Bedrooms: 2 bedrooms
- Flooring: Laminate flooring; Carpet
- Bathrooms: 2 full bathrooms
- Heating & cooling: Forced air heating; Heat pump cooling
- Interior features: Awnings; Bath off primary; Walk-in closet; Landscaped; Double pane windows
- Laundry & utility: Washer; Dryer
Neighborhood map
What this means for you Summary
Snapshot
- This is a 3-bed/2.0-bath manufactured listed at $80k.
Deal economics
- At list price, monthly cash flow is $1k ($15k/yr) — positive.
- The deal already cash-flows at list — no discount required.
- Meets the 1% rule at list price ($2k rent vs $80k).
- Cap rate 24.8% vs local median 3.2% in Hazel Dell — top-decile yield for the area; either an underpriced asset or a hidden risk that comps aren't pricing in. Stress-test before assuming the spread holds.
Location & tenants
- Location reads 82/100 on livability (#67 in WA, #1,216 nationally) — a professional / high-income tenant draw. Strengths: amenities A+, commute A+, housing A+; Watch: crime D+, cost of living D.
- Vancouver School District (suburban): math 43% / reading 53% proficiency, ranked #156 of 291 in WA (top 54%) — families likely to look elsewhere, expect single-tenant / working-renter base with shorter leases.
- Zoned schools: Sarah J Anderson Elementary (660 students, 53% FRL); Columbia River High (1,134 students, 32% FRL) — zoned schools at 43% FRL track the district average.
- Market conditions: Rents rising (+2.0%/yr); 187 active listings in the ZIP; 38 comparable units currently listed for rent nearby; rentals leasing fast (median 8d on market — plan ~1-2 weeks tenant-placement turnaround); solid renter incomes; 3,547 units permitted in Clark County in 2024 (1,361 in 5+ unit buildings).
Forward outlook
- Local home prices are declining (-3.0%/yr); year-one equity from $552 of loan paydown is wiped out by about $2k of value loss. Plan a longer hold.
- Clark County population projected at +29% by 2050 — long-run rental-demand tailwind backs the buy-and-hold thesis.
- At projected returns (-3.0% appreciation + 2.0% rent growth), your $22k cash investment doubles in ~2 years — after that, you're playing with house money.
Negotiation context
- Only 11 days on market — expect competitive offers; lowballing is unlikely to land.
Questions for the listing agent
- Is there a deadline driving the sale (1031 exchange, divorce, estate, relocation)? That informs how much negotiation room exists.
- Schools are F-rated, which usually means shorter tenancies and higher turnover. Who's the typical renter profile here, and what's been the actual vacancy rate?
- Crime grade is D in this area — have there been break-ins, vandalism, or insurance claims at this property in the last 3 years? What carrier currently insures it and at what premium?
- What's the average days-on-market for RENTAL listings here right now (not sales)? A rising rental-DOM trend means longer vacancies and softer asking-rent achievability than the comps imply.
- What's the recent tenant-quality profile in this submarket — average credit score on applications, eviction rate, late-payment / NSF rate, and stable-employment percentage? A property-management company in the area should have these aggregated.
- How much new for-sale + rental construction is in the pipeline within 1–3 miles? Heavy new supply typically softens prices + rents 12–24 months out; constrained supply supports both.
Investment metrics
- 1% rule
- 2.73% ✓
- Cap rate
- 24.78%
- Cash-on-cash
- 66.02%
- DSCR
- 3.94
- GRM
- 3.1
CMA / ARV
- ARV (on-the-fly)
- $107,520
- Comps found
- 7
Show comp detail 7 sales within ~0.75 mi
| Address | Dist | Beds/Ba | Sqft | Sold | Price | $/sf | Match |
|---|---|---|---|---|---|---|---|
| 1805 NE 94th St #6 | 0.00mi | 3/2.0 | 1,296 (+1%) | 18mo | $112,000 | $86 | 83 |
| 1805 NE 94th St #56 | 0.00mi | 3/2.0 | 1,188 (-7%) | 9mo | $98,500 | $83 | 80 |
| 1805 NE 94th St #12 | 0.00mi | 3/2.0 | 1,456 (+14%) | 21mo | $135,000 | $93 | 60 |
| 507 NE 99th St #7 | 0.73mi | 3/2.0 | 1,351 (+6%) | 3mo | $125,000 | $93 | 54 |
| 507 NE 99th St #15 | 0.73mi | 3/2.0 | 1,422 (+11%) | 4mo | $117,000 | $82 | 44 |
| 507 NE 99th St #43 | 0.73mi | 2/2.0 (-1) | 1,188 (-7%) | 17mo | $100,000 | $84 | 35 |
| 507 NE 99th St #51 | 0.73mi | 2/2.0 (-1) | 1,188 (-7%) | 20mo | $87,500 | $74 | 32 |
Match score weights: distance 35% · size 25% · config 20% · recency 20%. Top-matched comps best support the ARV.
Projected returns pro-forma
-3.0% appreciation · 2.0% rent growth · sell at horizon
- IRR
- 64.1%
- Equity multiple
- 3.83×
- Total profit
- $63,307
- Equity at exit
- $11,921
- IRR
- 68.2%
- Equity multiple
- 7.58×
- Total profit
- $147,374
- Equity at exit
- $6,913
Cash invested: $22,386 (down + closing). Projections, not guarantees.
Landlord ↔ Tenant lean methodology
- Overall (STATE)
- 28 Tenant-Leaning
- State Washington
- 28 Tenant-Leaning · D+8
- County
- — inherits STATE
- City
- — inherits STATE
ZIP-level market 98665
- Rents YoY
- 2.0%
- Active inventory
- 187
- Price-to-rent
- 3.1×
Monthly cashflow live
- Estimated rent
- $2,181 high interval (Pro) →
- Mortgage (P&I)
- −$419
- Tax from tax record
- −$39 /mo · $462/yr
- Insurance
- −$33
- HOA
- −$0
- Vacancy / Maint / Mgmt
- −$458
- Net cashflow
- $1,232
Break-even live
UW: 25.0% down · 7.5% · 30yr · 1.5% tax · 5.0% vac · 8.0% maint · 8.0% mgmt
Financing live
Cash to close
- Down payment
- $19,988
- Closing costs
- $2,398
- Reserves months
- —
- Total cash needed
- —
Loan-product check · same deal, 3 products live
Conventional
25% down · 7.5% · 30yr
- Down + closing
- —
- Monthly P&I
- —
- Monthly cashflow
- —
- DSCR
- —
- Eligible?
- —
Personal DTI + credit; lowest rate.
DSCR
20% down · 8.5% · 30yr
- Down + closing
- —
- Monthly P&I
- —
- Monthly cashflow
- —
- DSCR
- —
- Eligible?
- —
No personal income docs; deal must DSCR.
Hard money
10% down · 12.0% · 12mo
- Down + closing
- —
- Monthly P&I
- —
- Monthly cashflow
- —
- DSCR
- —
- Eligible?
- —
Short-term bridge; refi at stabilization.
Rent comps 38 comps
| Address | Beds | Baths | Sqft | Rent | $/sqft | DOM | Units | Dist |
|---|---|---|---|---|---|---|---|---|
| 9501 NE 19th Ave Vancouver, WA | 1.0–2.0 | 1.0–2.5 | 844 | $2,099 | $2.49 | 3d | 20 | 0.11mi |
| 9211 NE 15th Ave Vancouver, WA | 1.0–3.0 | 1.0–2.0 | 900 | $2,099 | $2.33 | 2d | 22 | 0.18mi |
| 9703 NE Tenny Creek Dr Vancouver, WA | 3.0 | 2.5 | 1592 | $2,295 | $1.44 | 23d | 1 | 0.20mi |
| 1801 NE 99th St Unit 9802-6 Vancouver, WA | 2.0 | 1.5 | 910 | $1,395 | $1.53 | 23d | 1 | 0.27mi |
| 1532 NE 87th Way Vancouver, WA | 3.0 | 2.5 | 1418 | $2,295 | $1.62 | 23d | 1 | 0.29mi |
| 8601 NE 21st Ave Unit D Vancouver, WA | 3.0 | 2.5 | 1155 | $2,200 | $1.90 | 14d | 1 | 0.29mi |
| 8601 NE 21st Ave Unit D Vancouver, WA | 3.0 | 2.5 | 1155 | $2,200 | $1.90 | 12d | 1 | 0.29mi |
| 2009 NE 102nd Cir Vancouver, WA | 3.0 | 2.5 | 1530 | $2,595 | $1.70 | 2d | 1 | 0.42mi |
| 2409 NE 100th St Vancouver, WA | 4.0 | 4.0 | 1798 | $3,300 | $1.84 | 23d | 1 | 0.43mi |
| 1016 NE 86th St Vancouver, WA | 2.0 | 1.0 | 950 | $1,475 | $1.55 | 23d | 1 | 0.56mi |
| 1437 NE 82nd Dr Vancouver, WA | 3.0 | 2.5 | 1500 | $2,695 | $1.80 | 2d | 1 | 0.59mi |
| 1106 NE 83rd St Vancouver, WA | 1.0–3.0 | 1.0–2.5 | 1058 | $2,318 | $2.19 | 20d | 1 | 0.63mi |
| 10117 NE 9th Ave Vancouver, WA | 1.0–2.0 | 1.0–2.0 | 790 | $1,470 | $1.86 | 2d | 8 | 0.65mi |
| 7900 NE 18th Ave Vancouver, WA | 1.0–3.0 | 1.0 | 755 | $1,650 | $2.19 | 1d | 4 | 0.65mi |
| 2301 NE 81st St Vancouver, WA | 1.0–3.0 | 1.0–2.0 | 1080 | $2,550 | $2.36 | 1d | 10 | 0.66mi |
| 10316 NE Stutz Rd Vancouver, WA | 2.0 | 1.0 | 880 | $1,300 | $1.48 | 23d | 1 | 0.66mi |
| 8005 NE 13th Ave Vancouver, WA | 1.0–2.0 | 1.0–2.0 | 849 | $2,045 | $2.41 | 7d | 14 | 0.68mi |
| 608 NE 86th St Vancouver, WA | 2.0 | 2.0 | 1031 | $1,825 | $1.77 | 2d | 1 | 0.70mi |
| 1115 NE 105th St Vancouver, WA | 1.0–2.0 | 1.0–2.0 | 835 | $1,615 | $1.93 | 7d | 6 | 0.71mi |
| 8003 NE 13th Ave Vancouver, WA | 1.0–2.0 | 1.0–2.0 | 845 | $2,045 | $2.42 | 7d | 16 | 0.71mi |
| 405 NE 85th St Vancouver, WA | 2.0 | 1.5 | 1116 | $2,299 | $2.06 | 2d | 1 | 0.77mi |
| 10223 NE Notchlog Dr Vancouver, WA | 2.0 | 1.0 | 665 | $1,646 | $2.48 | 7d | 1 | 0.77mi |
| 8415 NE Hazel Dell Ave Vancouver, WA | 2.0–3.0 | 1.0 | 871 | $1,750 | $2.01 | 1d | 4 | 0.84mi |
| 345 NE 105th St Vancouver, WA | 3.0 | 1.5 | 1260 | $2,350 | $1.87 | 4d | 1 | 0.92mi |
| 8500 NE Hazel Dell Ave Vancouver, WA | 1.0–2.0 | 1.0–2.0 | 837 | $1,675 | $2.00 | 10d | 2 | 0.96mi |
| 7306 NE 16th Ave #1 Vancouver, WA | 2.0 | 1.0 | 988 | $1,395 | $1.41 | 23d | 1 | 0.98mi |
| 8111 NE 36th Ct Vancouver, WA | 3.0 | 2.5 | 1512 | $2,295 | $1.52 | 7d | 1 | 1.02mi |
| 3005 NE 75th St Vancouver, WA | 3.0 | 2.5 | 1849 | $2,615 | $1.41 | 21d | 1 | 1.04mi |
| 3008 NE 74th St Vancouver, WA | 3.0 | 2.5 | 1834 | $2,450 | $1.34 | 16d | 1 | 1.06mi |
| 3011 NE 113th St Vancouver, WA | 3.0 | 2.5 | 1658 | $2,895 | $1.75 | 23d | 1 | 1.10mi |
| 4013 NE 89th Way Vancouver, WA | 3.0 | 2.5 | 1532 | $2,550 | $1.66 | 11d | 1 | 1.11mi |
| 8007 NE 38th Ave Vancouver, WA | 3.0 | 2.5 | 1477 | $2,395 | $1.62 | 2d | 1 | 1.12mi |
| 7317 NE Hazel Dell Ave #10 Vancouver, WA | 2.0 | 1.0 | 1037 | $1,395 | $1.35 | 23d | 1 | 1.13mi |
| 1307 NE 70th St Vancouver, WA | 3.0 | 2.0 | 1802 | $2,829 | $1.57 | 23d | 1 | 1.16mi |
| 7714 NE 39th Ct Vancouver, WA | 1.0–2.0 | 1.0–2.0 | 921 | $2,035 | $2.21 | 2d | 12 | 1.23mi |
| 145 NW 76th St Vancouver, WA | 3.0 | 2.5 | 1349 | $2,245 | $1.66 | 7d | 1 | 1.27mi |
| 10601 NE 45th Ave Vancouver, WA | 3.0 | 2.0 | 1409 | $2,750 | $1.95 | 43d | 1 | 1.45mi |
| 8225 NE St Johns Rd Vancouver, WA | 3.0 | 2.0 | 1584 | $2,048 | $1.29 | 2d | 1 | 1.49mi |
Listing history 8 events
-
2026-06-17days on market $79,950 Active 11 DOM
-
2026-06-16days on market $79,950 Active 10 DOM
-
2026-06-15days on market $79,950 Active 9 DOM
-
2026-06-13pricedays on market $79,950 Active 7 DOM
-
2026-06-09days on market $88,000 Active 3 DOM
-
2026-06-08days on market $88,000 Active 2 DOM
-
2026-06-07remarks 699-char remark
-
2026-06-07$88,000 Active 1 DOM
ⓘ Source: listings_history table (triggers on properties + properties_extension) + one-shot
backfill from property_details.listing_events for pre-trigger history.
Tax reassessment forecast WA · Resets to sale price
- Current annual tax
- $462 · $39/mo
- Projected year-2 tax
- $784 · $65/mo
- Expected delta
- +$321/yr (+$27/mo · 69.5%)
ⓘ Screening estimate from a state-policy table — verify with the county assessor before closing.
Nearby sold comps map
Loading sold comps map…
Walkable amenities ~0.75 mi
Loading nearby amenities…
Taxation est. · year 1
- Rental income
- $26,167
- − Mortgage interest
- −$4,478
- − Property taxes
- −$462
- − Insurance
- −$400
- − Repairs & maintenance
- −$2,093
- − Management
- −$2,093
- − Depreciation
- −$2,326
- Taxable income
- $14,314
- Est. tax owed @ 24.0%
- −$3,435
- After-tax cash flow
- $11,344/yr
For passive investors: Depreciation is non-cash, so a rental often shows a tax loss while cash-flowing — sheltering income. Rental losses are passive: they offset passive income freely, and up to $25,000/yr can offset ordinary (W-2) income if you actively participate and your MAGI is under $100k (phasing out to $0 by $150k); unused losses carry forward. On sale, claimed depreciation is recaptured at up to 25%, and gains may owe capital-gains tax (a 1031 exchange can defer both). Figures are a year-1 estimate at your 24.0% rate — not tax advice; consult a CPA.
Schools (NCES district)
- District
- Vancouver School District
- NCES district ID
- 5309270
- Math proficiency
- 43% ▬ 0.00%
- Reading proficiency
- 53% ▬ 0.00%
- Median HH income
- $52,562
- Composite
- 43.45/100
- National rank
- #6479
- State rank
- #156 of 291 in WA
Livability — Hazel Dell
- Score
- 82/100
- State rank
- #67
- US rank
- #1216
Category grades
Schools grade is shown separately in the Schools card above.
Census & demographics
- Census place
- Hazel Dell, WA
- County
- Clark County · 513,189 people
- City population
- 28,243
- Metro
- Portland-Vancouver-Hillsboro, OR-WA
- Population (ZIP)
- 28,910
- Household income
- $88,559
- Rent vs Own
- Severe rent burden
- 1070.0
Population outlook (Clark County) Hauer SSP2
- Today (2025)
- 529,610 people
- By 2030
- 563,242 · +6.4%
- By 2040
- 625,905 · +18.2%
- By 2050
- 681,558 · +28.7%
- By 2075
- 805,967 · +52.2%
- By 2100
- 877,450 · +65.7%
Race, ethnicity, and origin ACS 2023
- Neighborhood character
- Predominantly White (70%)
- Race & ethnicity
- White 70% Hispanic / Latino 14% Two or more races 11% Asian 5% Black 3%
- Hispanic origin (detail)
- Mexican 12%
- Common ancestry
- Portuguese 5% Italian 4% Slovak 3%
- Foreign-born
- 12% · Canada, China
- Languages at home
- 80% English-only · Spanish 9% Russian/Polish/Slavic 3% Other Asian/Pacific 2%
Political lean MEDSL · Clark
- 2024 margin
- Lean D (+7.0) · D 52.1% · R 45.1% · Other 2.8%
- 2008→2024 swing
- +0.9pp no change · 2008: 6.1pp · 2024: 7.0pp
- All cycles
- 2024: D+7.0 2020: D+5.1 2016: D+0.1 2012: D+0.1 2008: D+6.1
Not yet ingested
- Civics
- —
Market trends
- HPI YoY
- ▼ -274.20%
- Current HPI
- 303.1342
- Rent YoY
- ▲ 2.00%
- Metro
- Portland-Vancouver-Hillsboro, OR-WA
- State GDP YoY
- ▲ 4.65%
- F500 in state
- 22
Industry mix (Fortune 500 HQ in WA)
| Industry | F500 HQs | Revenue |
|---|---|---|
| Retail | 2 | $269B |
|
||
| Technology / Retail | 1 | $638B |
|
||
| Technology | 1 | $245B |
|
||
| Telecommunications | 1 | $38B |
|
||
| Food / Beverage | 1 | $36B |
|
||
| Automotive / Trucks | 1 | $34B |
|
||
Price history
1 event — show timeline
- 2026-06-06 Listed $88,000 NWMLS as Distributed by MLS Grid
Property tax history
-1.3%/yrLatest (2026): $462 · +41.4% YoY. Source: county tax records.
Cash-flow waterfall
monthlySold comps — $/sqft
last 12 mo · ≤1 miLoading sold comps…