 Triplex
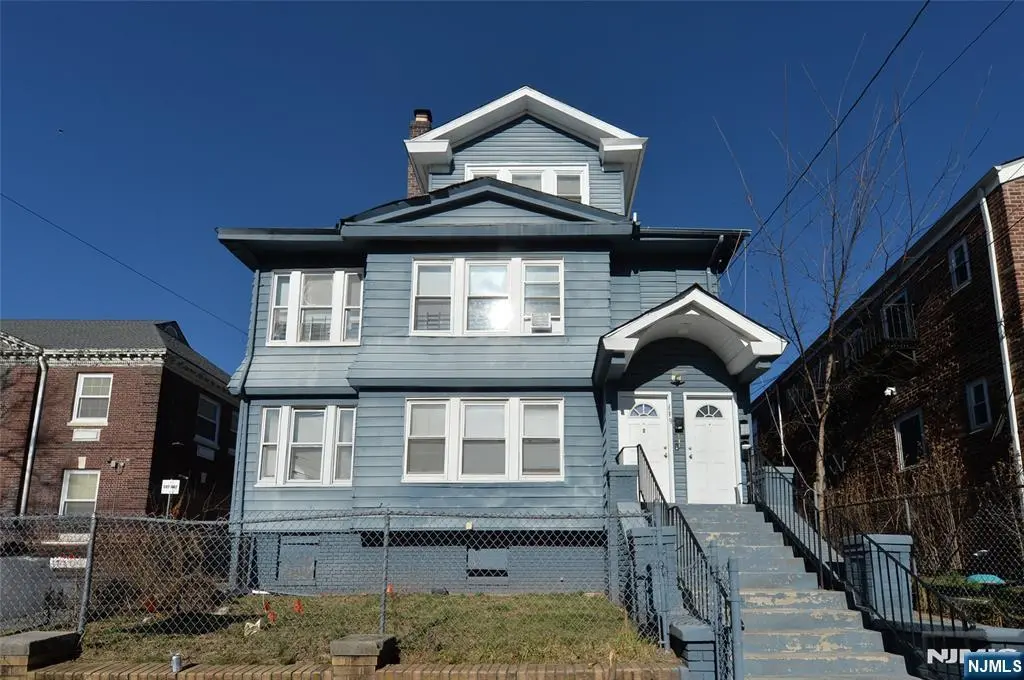
349-351 Osborne Ter · Newark, NJ
Flood risk 1/10 · Minimal
- FEMA flood zone
- X (unshaded)
- Chance of flooding over 30 yrs
- 0.0%
- Est. flood insurance / yr
- $507 – $1,088
Fire risk 1/10 · Minimal
- Est. fire insurance / yr
- $526 – $976
Heat risk 7/10 · Major
- Hot days now (above 101°F)
- 7 days/yr
- Hot days in 30 yrs
- 14 days/yr
Wind risk 6/10 · Moderate
- Chance of severe wind over 30 yrs
- 27.0%
Air-quality risk 4/10 · Minor
- Unhealthy air days now
- 4 days/yr
- Unhealthy air days in 30 yrs
- 5 days/yr
Risk factors via First Street. Map © Google.
Why this score? — see what drove the D grade
The composite is a weighted blend of 9 inputs, each scored 0–100. Each bar is that input's sub-score; the figure is the points it added to the 100-point composite (weight × sub-score).
- Appreciation +10.0/10.0
- Cash flow +9.2/30.0
- ARV discount +7.5/15.0
- Livability +3.4/5.0
- Rent growth +3.2/5.0
- 1% rule +2.8/10.0
- DSCR +2.6/10.0
- Condition / age +2.5/5.0
- Schools +1.4/10.0
$929,000
🖨 Deal sheet (PDF) 📄 Offer letter ✓ Due diligence
Multi-family units
County records classify this as Multi-Family (2-4 Unit). Listing-text estimate: 3 units. confirmed
Listing remarks MLS
Turnkey 3-Family Investment in Newark’s Coveted Weequahic Section! Discover 349 Osborne Terrace, a beautifully updated 3-family home offering nearly 6,000 sq. ft. of living space on an oversized 50×138 lotideal for investors or an owner-occupant seeking strong rental income. Fully renovated in 2019, each unit boasts sun-filled living areas, generously sized bedrooms, modern eat-in kitchens, and updated bathrooms, with upgraded flooring and well-maintained interiors throughout. Recent improvements include refreshed kitchens/baths and newer mechanicals, ensuring a move-in ready, hassle-free property. Strategically located just minutes from Beth Israel Hospital, Newark Penn Station, major highways, and the airport, this home offers both income potential and unbeatable convenience. Don’t miss your chance to own a turnkey, high-producing 3-family in one of Newark’s most desirable neighborhoods! Owner holds a Real Estate License
Key facts
- Updated bathrooms
- Updated kitchens
- Oversized lot
Tags
Neighborhood map
What this means for you Summary
Snapshot
- This is a 3 × 3-bed/1.7-bath units multifamily listed at $929k.
Deal economics
- At list price, monthly cash flow is $-704 ($-8k/yr) — negative. Per door: $-235/mo.
- To cash-flow at today's rent, offer at most $827k (11.0% below list).
- To meet the 1% rule (rent ≥ 1% of price), the offer needs to be $724k (22.1% below list).
- Recommended offer: $724k (22.1% below list) — sets the bar for 1% rule.
- Cap rate 5.4% vs local median 3.0% in Newark — top-decile yield for the area; either an underpriced asset or a hidden risk that comps aren't pricing in. Stress-test before assuming the spread holds.
Location & tenants
- Location reads 67/100 on livability (#343 in NJ) — a middle-class / working-renter tenant base. Strengths: commute A+, amenities A-; Watch: housing D+, crime F, employment D-.
- Newark Public School District (urban): math 9% / reading 26% proficiency, ranked #452 of 472 in NJ (top 96%) — low school quality limits family demand, transient renter base, plan for 1-2y turnover; 79% free/reduced lunch — lower-income household profile, screen leases tightly.
- Zoned schools: Ann Street School (math 13% / reading 34%, grade F, #921 of 1,303 statewide, top 71%, 1,200 students, 78% FRL); East Side High School (math 17% / reading 22%, grade F, #357 of 399 statewide, top 90%, 2,255 students, 77% FRL) — zoned schools at 77% FRL track the district average.
- Market conditions: Rents rising (+2.8%/yr); 36 active listings in the ZIP; 3,364 units permitted in Essex County in 2024 (2,551 in 5+ unit buildings).
- At $7,236/mo this rent would consume 149% of the median local household income ($58k/yr) (locally 2148% of renters already pay >50% of income on rent) — very limited rent-growth headroom before tenants either downsize or default.
Forward outlook
- In year one you build about $99k of equity ($6k loan paydown + $93k appreciation (10.0% local appreciation)).
- Essex County population projected at +3% by 2050 — modest demand growth; plan on rents tracking national, not racing it.
- By year 2, paydown + projected appreciation supports a ~$160k cash-out refi (75% LTV) — recoverable capital for the next deal without selling this one.
Negotiation context
- It's been on market 101 days — a 9% lower offer ($845k) is reasonable based on typical stale-listing flexibility.
- 2 sale attempts with the ask held roughly flat each time — persistent listings suggest the price (not the market) is what's stuck; bring a comps-based counter.
- Current owner paid $90k; list at $929k implies a 929% gain — meaningful room to come down on a strong offer.
Risks & watch-outs
- Climate carrying-cost: major wind risk, 27% chance of damaging wind over 30y; extreme-heat days projected 7→14/yr by 2055 (HVAC capex compounding) — expect insurance premiums to compound above CPI over the hold.
Questions for the listing agent
- What do current leases actually rent for vs. the listed asking? Can we see a recent rent roll and the last 12 months of T-12 income?
- It's been on market 101 days. Have you received any prior offers? Is the seller open to a 22% concession, seller financing, or rate buy-down credit?
- Can we see the unit-by-unit rent roll, current vacancy, and any below-market leases? What's the average tenancy length?
- What capital expenditures (roof, boiler, parking lot, exteriors) have been made in the last 5 years, and what's planned in the next 2?
- Why hasn't it sold? Are there any deal-killer items the seller is aware of (foundation, flood, title, zoning, code violations)?
- Is there a deadline driving the sale (1031 exchange, divorce, estate, relocation)? That informs how much negotiation room exists.
- Schools are D-rated, which usually means shorter tenancies and higher turnover. Who's the typical renter profile here, and what's been the actual vacancy rate?
- Crime grade is F in this area — have there been break-ins, vandalism, or insurance claims at this property in the last 3 years? What carrier currently insures it and at what premium?
- The area grade is low — what's the realistic commute time and amenity access for the typical tenant pool here? Any planned neighborhood developments (good or bad) we should know about?
- What's the average days-on-market for RENTAL listings here right now (not sales)? A rising rental-DOM trend means longer vacancies and softer asking-rent achievability than the comps imply.
- What's the recent tenant-quality profile in this submarket — average credit score on applications, eviction rate, late-payment / NSF rate, and stable-employment percentage? A property-management company in the area should have these aggregated.
- How much new apartment / multifamily construction is in the pipeline within 1–3 miles? Heavy new supply (>2% of stock underway) typically softens rents 12–24 months out; light construction supports rent growth.
Investment metrics
- 1% rule
- 0.78% ✗
- Cap rate
- 5.38%
- Cash-on-cash
- -3.25%
- DSCR
- 0.86
- GRM
- 10.7
CMA / ARV
No comps found within radius.
Show comp detail 12 sales within ~0.75 mi
| Address | Dist | Beds/Ba | Sqft | Sold | Price | $/sf | Match |
|---|---|---|---|---|---|---|---|
| 198-200 Shephard Ave | 0.05mi | 10/3.0 (+1) | — | 6mo | $810,000 | — | 67 |
| 138-140 Goldsmith Ave | 0.33mi | 9/4.0 | — | 6mo | $860,000 | — | 63 |
| 388-392 Chadwick Ave | 0.34mi | 10/4.0 (+1) | — | 4mo | $925,000 | — | 59 |
| 129 Dewey St | 0.39mi | 9/3.0 | — | 3mo | $700,000 | — | 59 |
| 91-93 Vassar Ave | 0.39mi | 9/3.0 | — | 5mo | $750,000 | — | 57 |
| 64 Schuyler Ave | 0.30mi | 10/3.0 (+1) | — | 7mo | $760,000 | — | 54 |
| 343-345 HAWTHORNE Ave | 0.49mi | 8/5.0 (-1) | — | 6mo | $855,000 | — | 54 |
| 420 Jelliff Ave | 0.64mi | 9/5.0 | — | 6mo | $740,000 | — | 52 |
| 251-253 Wainwright St | 0.61mi | 9/4.0 | — | 7mo | $740,000 | — | 49 |
| 471 Hawthorne Ave | 0.56mi | 8/4.0 (-1) | — | 4mo | $900,000 | — | 48 |
| 10 Tillinghast St | 0.52mi | 8/3.0 (-1) | — | 3mo | $630,000 | — | 48 |
| 67 Wainwright St | 0.56mi | 8/7.0 (-1) | — | 8mo | $999,000 | — | 42 |
Match score weights: distance 35% · size 25% · config 20% · recency 20%. Top-matched comps best support the ARV.
Projected returns pro-forma
10.0% appreciation · 2.75% rent growth · sell at horizon
- IRR
- 21.9%
- Equity multiple
- 2.77×
- Total profit
- $459,434
- Equity at exit
- $836,917
- IRR
- 19.7%
- Equity multiple
- 6.32×
- Total profit
- $1,384,772
- Equity at exit
- $1,804,843
Cash invested: $260,120 (down + closing). Projections, not guarantees.
Landlord ↔ Tenant lean methodology
- Overall (CITY)
- 0 Strongly Tenant-Friendly
- State New Jersey
- 21 Tenant-Leaning · D+6
- County
- — inherits STATE
- City Newark
- 0 Strongly Tenant-Friendly · D+59
ZIP-level market 07112
- Home prices YoY
- 10.7%
- Rents YoY
- 2.8%
- Active inventory
- 36
- Price-to-rent
- 32.1×
Monthly cashflow live
- Estimated rent
- $7,236 high interval (Pro) →
- Mortgage (P&I)
- −$4,872
- Tax est. 1.5%
- −$1,161 /mo · $13,935/yr
- Insurance
- −$387
- HOA
- −$0
- Vacancy / Maint / Mgmt
- −$1,520
- Net cashflow
- $-704
Break-even live
Sensitivity live
| Price | -10% $-62 | -5% $-383 | +0% $-704 | +5% $-1,025 | +10% $-1,346 |
|---|---|---|---|---|---|
| Rent | -10% $-1,275 | -5% $-989 | +0% $-704 | +5% $-418 | +10% $-132 |
| Rate | -1.0pp $-236 | -0.5pp $-467 | base $-704 | +0.5pp $-944 | +1.0pp $-1,189 |
3-unit breakdown (identical units grouped — click to expand)
| Units | Beds | Baths | Est. rent |
|---|---|---|---|
| 3× units | 3 | 1.7 | $7,236 |
| #1 | 3 | 1.7 | $2,412 |
| #2 | 3 | 1.7 | $2,412 |
| #3 | 3 | 1.7 | $2,412 |
| Total (3 units) | $7,236 | ||
UW: 25.0% down · 7.5% · 30yr · 1.5% tax · 5.0% vac · 8.0% maint · 8.0% mgmt
Financing live
Cash to close
- Down payment
- $232,250
- Closing costs
- $27,870
- Reserves months
- —
- Total cash needed
- —
Loan-product check · same deal, 3 products live
Conventional
25% down · 7.5% · 30yr
- Down + closing
- —
- Monthly P&I
- —
- Monthly cashflow
- —
- DSCR
- —
- Eligible?
- —
Personal DTI + credit; lowest rate.
DSCR
20% down · 8.5% · 30yr
- Down + closing
- —
- Monthly P&I
- —
- Monthly cashflow
- —
- DSCR
- —
- Eligible?
- —
No personal income docs; deal must DSCR.
Hard money
10% down · 12.0% · 12mo
- Down + closing
- —
- Monthly P&I
- —
- Monthly cashflow
- —
- DSCR
- —
- Eligible?
- —
Short-term bridge; refi at stabilization.
Listing history 18 events
-
2026-06-21days on market $929,000 Active 101 DOM
-
2026-06-18days on market $929,000 Active 98 DOM
-
2026-06-17days on market $929,000 Active 97 DOM
-
2026-06-16days on market $929,000 Active 96 DOM
-
2026-06-15days on market $929,000 Active 95 DOM
-
2026-06-13days on market $929,000 Active 93 DOM
-
2026-06-13days on market $929,000 Active 92 DOM
-
2026-06-09days on market $929,000 Active 89 DOM
-
2026-06-08days on market $929,000 Active 88 DOM
-
2026-06-07days on market $929,000 Active 87 DOM
-
2026-06-04days on market $929,000 Active 84 DOM
-
2026-06-03days on market $929,000 Active 83 DOM
-
2026-06-02days on market $929,000 Active 82 DOM
-
2026-06-01days on market $929,000 Active 81 DOM
-
2026-05-31days on market $929,000 Active 80 DOM
-
2026-03-12$929,000 Active 999-char remark
Show marketing remark (933 chars)
Turnkey 3-Family Investment in Newark?s Coveted Weequahic Section!Discover 349 Osborne Terrace, a beautifully updated 3-family home offering nearly 6,000 sq. ft. of living space on an oversized 50�138 lotideal for investors or an owner-occupant seeking strong rental income. Fully renovated in 2019, each unit boasts sun-filled living areas, generously sized bedrooms, modern eat-in kitchens, and updated bathrooms, with upgraded flooring and well-maintained interiors throughout. Recent improvements include refreshed kitchens/baths and newer mechanicals, ensuring a move-in ready, hassle-free property.Strategically located just minutes from Beth Israel Hospital, Newark Penn Station, major highways, and the airport, this home offers both income potential and unbeatable convenience. Don?t miss your chance to own a turnkey, high-producing 3-family in one of Newark?s most desirable neighborhoods!Owner holds a Real Estate License
-
2026-03-12$929,000 Active 933-char remark
Show marketing remark (933 chars)
Turnkey 3-Family Investment in Newark?s Coveted Weequahic Section!Discover 349 Osborne Terrace, a beautifully updated 3-family home offering nearly 6,000 sq. ft. of living space on an oversized 50�138 lotideal for investors or an owner-occupant seeking strong rental income. Fully renovated in 2019, each unit boasts sun-filled living areas, generously sized bedrooms, modern eat-in kitchens, and updated bathrooms, with upgraded flooring and well-maintained interiors throughout. Recent improvements include refreshed kitchens/baths and newer mechanicals, ensuring a move-in ready, hassle-free property.Strategically located just minutes from Beth Israel Hospital, Newark Penn Station, major highways, and the airport, this home offers both income potential and unbeatable convenience. Don?t miss your chance to own a turnkey, high-producing 3-family in one of Newark?s most desirable neighborhoods!Owner holds a Real Estate License
-
2016-09-16soldstatus $90,300
ⓘ Source: listings_history table (triggers on properties + properties_extension) + one-shot
backfill from property_details.listing_events for pre-trigger history.
Climate risk First Street
- Flood 1/10 Low FEMA zone X (unshaded) · 0% chance over 30 yrs
- Wildfire 1/10 Low
- Heat 7/10 Severe 7 d/yr ≥101°F today · 14 d/yr by 30 yrs out
- Wind 6/10 Major 27% chance of damaging wind over 30 yrs
- Air quality 4/10 Moderate 4 unhealthy d/yr today · 5 by 30 yrs out
Nearby sold comps map
Loading sold comps map…
Walkable amenities ~0.75 mi
Loading nearby amenities…
Taxation est. · year 1
- Rental income
- $86,832
- − Mortgage interest
- −$52,038
- − Property taxes
- −$13,935
- − Insurance
- −$4,645
- − Repairs & maintenance
- −$6,947
- − Management
- −$6,947
- − Depreciation
- −$27,025
- Taxable loss
- −$24,705
- Est. tax savings @ 24.0%
- +$5,929
- After-tax cash flow
- $-2,515/yr
For passive investors: Depreciation is non-cash, so a rental often shows a tax loss while cash-flowing — sheltering income. Rental losses are passive: they offset passive income freely, and up to $25,000/yr can offset ordinary (W-2) income if you actively participate and your MAGI is under $100k (phasing out to $0 by $150k); unused losses carry forward. On sale, claimed depreciation is recaptured at up to 25%, and gains may owe capital-gains tax (a 1031 exchange can defer both). Figures are a year-1 estimate at your 24.0% rate — not tax advice; consult a CPA.
Schools (NCES district)
- District
- Newark Public School District
- NCES district ID
- 3411340
- Math proficiency
- 9% ▼ -17.00%
- Reading proficiency
- 26% ▼ -10.00%
- Median HH income
- $33,891
- Composite
- 14.24/100
- National rank
- #9449
- State rank
- #452 of 472 in NJ
Livability — Newark
- Score
- 67/100
- State rank
- #343
- US rank
- #11138
Category grades
Schools grade is shown separately in the Schools card above.
Census & demographics
- Census place
- Newark, NJ
- County
- Essex County · 825,405 people
- City population
- 310,602
- Metro
- New York-Newark-Jersey City, NY-NJ-PA
- Population (ZIP)
- 29,456
- Household income
- $58,200
- Rent vs Own
- Severe rent burden
- 2148.0
Population outlook (Essex County) Hauer SSP2
- Today (2025)
- 825,042 people
- By 2030
- 834,010 · +1.1%
- By 2040
- 846,221 · +2.6%
- By 2050
- 850,047 · +3.0%
- By 2075
- 837,009 · +1.5%
- By 2100
- 784,345 · -4.9%
Race, ethnicity, and origin ACS 2023
- Neighborhood character
- Predominantly Black (85%)
- Race & ethnicity
- Black 85% Hispanic / Latino 9% Two or more races 5% White 1%
- Hispanic origin (detail)
- Puerto Rican 3% Dominican 2%
- Common ancestry
- Swiss 1% Hispanic 1% Italian 1%
- Foreign-born
- 24% · Canada, China, United Kingdom
- Languages at home
- 78% English-only · Spanish 9% French/Haitian/Cajun 2% Other Indo-European 1%
Political lean MEDSL · Essex
- 2024 margin
- Solid D (+44.9) · D 71.7% · R 26.8% · Other 1.5%
- 2008→2024 swing
- -7.7pp toward R · 2008: 52.6pp · 2024: 44.9pp
- All cycles
- 2024: D+44.9 2020: D+55.4 2016: D+56.4 2012: D+55.5 2008: D+52.6
Not yet ingested
- Civics
- —
Market trends
- HPI YoY
- ▲ 40.64%
- Current HPI
- 422.0928
- Rent YoY
- ▲ 2.75%
- Metro
- New York-Newark-Jersey City, NY-NJ-PA
- State GDP YoY
- ▲ 2.05%
- F500 in state
- 34
Industry mix (Fortune 500 HQ in NJ)
| Industry | F500 HQs | Revenue |
|---|---|---|
| Consumer Goods | 3 | $31B |
|
||
| Pharmaceuticals | 2 | $153B |
|
||
| Technology | 2 | $21B |
|
||
| Insurance | 2 | $20B |
|
||
| Healthcare | 2 | $19B |
|
||
| Financial Services | 1 | $70B |
|
||
Price history
+928.8% since first listed3 events — show timeline
- 2026-03-12 Listed $929,000 GSMLS
- 2026-03-12 Listed $929,000 NJMLS
- 2016-09-16 Sold (MLS) $90,300 GSMLS
Cash-flow waterfall
monthlySold comps — $/sqft
last 12 mo · ≤1 miLoading sold comps…