 Duplex
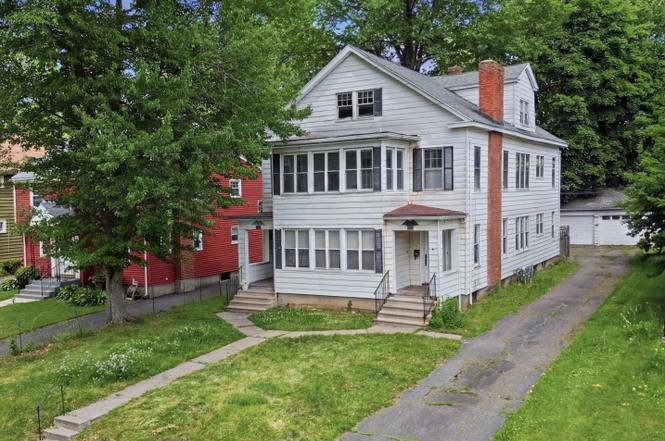
20 Bretton Rd · West Hartford, CT
Flood risk 1/10 · Minimal
- FEMA flood zone
- X (unshaded)
- Chance of flooding over 30 yrs
- 0.0%
- Est. flood insurance / yr
- $473 – $860
Fire risk 1/10 · Minimal
- Est. fire insurance / yr
- $829 – $1,539
Heat risk 5/10 · Moderate
- Hot days now (above 98°F)
- 7 days/yr
- Hot days in 30 yrs
- 16 days/yr
Wind risk 6/10 · Moderate
- Chance of severe wind over 30 yrs
- 27.0%
Air-quality risk 3/10 · Minor
- Unhealthy air days now
- 3 days/yr
- Unhealthy air days in 30 yrs
- 4 days/yr
Risk factors via First Street. Map © Google.
Why this score? — see what drove the C+ grade
The composite is a weighted blend of 9 inputs, each scored 0–100. Each bar is that input's sub-score; the figure is the points it added to the 100-point composite (weight × sub-score).
- Cash flow +18.6/30.0
- ARV discount +15.0/15.0
- 1% rule +6.3/10.0
- DSCR +5.9/10.0
- Schools +5.6/10.0
- Livability +4.0/5.0
- Rent growth +3.8/5.0
- Condition / age +2.5/5.0
- Appreciation +0.0/10.0
$499,900
🖨 Deal sheet 📄 Offer letter ✓ Due diligence
Multi-family units
County records classify this as Multi-Family (2-4 Unit). Listing-text estimate: 2 units. confirmed
Listing remarks
Fantastic opportunity to own a spacious two-family home in a prime West Hartford location, just steps from Morley Elementary School and within walking distance to West Hartford Center's shops, restaurants, and amenities. Each unit offers 3 bedrooms, a generous living room, dining room, and kitchen, with separate utilities for added convenience. The second and third floors are combined to create an expansive upper unit with plenty of living space. Additional features include a detached 2-car garage and solid construction with great bones throughout. Priced to reflect its current condition, this property offers tremendous potential for owner-occupants, investors, or renovators looking to add
Key facts
- Separate utilities
- Solid construction
- Expansive upper unit
Tags
Property features AI
Exterior
- Parking: Detached garage; 2-car garage
- Utilities: Public water connected; Public sewer connected; Hot water system (other); Fuel tank located in basement
- Home design: Multi-family property (2-family)
- Construction: Concrete foundation; Other construction
- Exterior features: Vinyl siding; Asphalt shingle roof
Interior
- Bedrooms: 6 bedrooms
- Bathrooms: 3 full bathrooms
- Heating & cooling: Hot water heating (oil-fired); Window unit cooling
- Interior features: 14 total rooms; Full basement; Walk-up attic; 2 fireplaces
Neighborhood map
What this means for you Summary
Snapshot
- This is a 2 × 3-bed/1.5-bath units multifamily listed at $500k.
Deal economics
- At list price, monthly cash flow is $489 ($6k/yr) — positive. Per door: $244/mo.
- The deal already cash-flows at list — no discount required.
- Meets the 1% rule at list price ($6k rent vs $500k).
- Cap rate 7.5% vs local median 3.3% in West Hartford — top-decile yield for the area; either an underpriced asset or a hidden risk that comps aren't pricing in. Stress-test before assuming the spread holds.
Location & tenants
- Location reads 79/100 on livability (#27 in CT, #1,989 nationally) — a middle-class / working-renter tenant base. Strengths: employment A+, housing A+, crime B+; Watch: amenities F, cost of living F.
- West Hartford School District (urban): math 56% / reading 67% proficiency, ranked #39 of 153 in CT (top 26%) — acceptable for families but not a draw, mixed tenant base, ~2y average lease; only 16% free/reduced lunch — higher-income household profile.
- Zoned schools: Morley School (math 62% / reading 67%, grade B, #118 of 553 statewide, top 23%, 299 students, 15% FRL); Hall High School (math 62% / reading 82%, grade B+, #14 of 194 statewide, top 8%, 1,408 students, 20% FRL) — zoned schools at 18% FRL track the district average.
- Market conditions: Rents rising fast (+5.4%/yr); 40 active listings in the ZIP; 1 comparable units currently listed for rent nearby; solid renter incomes; 1,867 units permitted in Capitol Planning Region in 2024 (1,399 in 5+ unit buildings).
- At $5,670/mo this rent would consume 68% of the median local household income ($100k/yr) (locally 652% of renters already pay >50% of income on rent) — very limited rent-growth headroom before tenants either downsize or default.
Forward outlook
- Local home prices are declining (-3.0%/yr); year-one equity from $3k of loan paydown is wiped out by about $15k of value loss. Plan a longer hold.
Negotiation context
- Only 4 days on market — expect competitive offers; lowballing is unlikely to land.
Risks & watch-outs
- Watch-outs: property tax is 2.8% of price; built in 1922 — expect roof / HVAC / electrical / plumbing capex.
- Climate carrying-cost: major wind risk, 27% chance of damaging wind over 30y; extreme-heat days projected 7→16/yr by 2055 (HVAC capex compounding) — expect insurance premiums to compound above CPI over the hold.
Questions for the listing agent
- Can we see the unit-by-unit rent roll, current vacancy, and any below-market leases? What's the average tenancy length?
- What capital expenditures (roof, boiler, parking lot, exteriors) have been made in the last 5 years, and what's planned in the next 2?
- Built in 1922 — when were the roof, HVAC, electrical panel, plumbing, and water heater last replaced?
- Property tax is high relative to price — has the assessment been appealed recently, and will the sale trigger a re-assessment?
- Is there a deadline driving the sale (1031 exchange, divorce, estate, relocation)? That informs how much negotiation room exists.
- Schools are A-rated — typically a magnet for longer-tenancy family renters. What's the average tenant stay here, and is there a school-zone premium baked into asking?
- What's the average days-on-market for RENTAL listings here right now (not sales)? A rising rental-DOM trend means longer vacancies and softer asking-rent achievability than the comps imply.
- What's the recent tenant-quality profile in this submarket — average credit score on applications, eviction rate, late-payment / NSF rate, and stable-employment percentage? A property-management company in the area should have these aggregated.
- How much new apartment / multifamily construction is in the pipeline within 1–3 miles? Heavy new supply (>2% of stock underway) typically softens rents 12–24 months out; light construction supports rent growth.
Investment metrics
- 1% rule
- 1.13% ✓
- Cap rate
- 7.47%
- Cash-on-cash
- 4.19%
- DSCR
- 1.19
- GRM
- 7.3
CMA / ARV
- ARV (on-the-fly)
- $723,976
- Comps found
- 8
Show comp detail 8 sales within ~0.75 mi
| Address | Dist | Beds/Ba | Sqft | Sold | Price | $/sf | Match |
|---|---|---|---|---|---|---|---|
| 40 Bretton Rd | 0.05mi | 6/3.0 | 3,748 (+8%) | 10mo | $720,000 | $192 | 76 |
| 105 Ardmore Rd | 0.12mi | 6/2.5 | 3,080 (-11%) | 5mo | $700,000 | $227 | 70 |
| 53 Quaker Ln S | 0.32mi | 6/4.0 | 3,669 (+6%) | 7mo | $767,000 | $209 | 65 |
| 92 Ardmore Rd | 0.08mi | 6/2.0 | 3,248 (-6%) | 23mo | $606,000 | $187 | 62 |
| 78-80 Lancaster Rd | 0.39mi | 5/3.0 (-1) | 3,281 (-5%) | 12mo | $710,000 | $216 | 58 |
| 28 Quaker Ln S | 0.17mi | 7/3.0 (+1) | 3,804 (+10%) | 22mo | $550,000 | $145 | 53 |
| 60 Whitman Ave | 0.73mi | 6/3.0 | 3,794 (+10%) | 2mo | $830,000 | $219 | 48 |
| 152 Maplewood Ave | 0.55mi | 7/3.0 (+1) | 3,743 (+8%) | 20mo | $625,000 | $167 | 39 |
Match score weights: distance 35% · size 25% · config 20% · recency 20%. Top-matched comps best support the ARV.
Projected returns pro-forma
-3.0% appreciation · 5.37% rent growth · sell at horizon
- IRR
- -6.7%
- Equity multiple
- 0.75×
- Total profit
- $-35,628
- Equity at exit
- $74,537
- IRR
- 6.0%
- Equity multiple
- 1.50×
- Total profit
- $70,355
- Equity at exit
- $43,222
Cash invested: $139,972 (down + closing). Projections, not guarantees.
Landlord ↔ Tenant lean methodology
- Overall (STATE)
- 27 Tenant-Leaning
- State Connecticut
- 27 Tenant-Leaning · D+7
- County
- — inherits STATE
- City
- — inherits STATE
ZIP-level market 06119
- Rents YoY
- 5.4%
- Active inventory
- 40
- Price-to-rent
- 14.7×
Monthly cashflow live
- Estimated rent
- $5,670 high interval (Pro) →
- Mortgage (P&I)
- −$2,622
- Tax from tax record
- −$1,161 /mo · $13,930/yr
- Insurance
- −$208
- HOA
- −$0
- Vacancy / Maint / Mgmt
- −$1,191
- Net cashflow
- $489
Break-even live
2-unit breakdown (identical units grouped — click to expand)
| Units | Beds | Baths | Est. rent |
|---|---|---|---|
| 2× units | 3 | 1.5 | $5,670 |
| #1 | 3 | 1.5 | $2,835 |
| #2 | 3 | 1.5 | $2,835 |
| Total (2 units) | $5,670 | ||
UW: 25.0% down · 7.5% · 30yr · 1.5% tax · 5.0% vac · 8.0% maint · 8.0% mgmt
Financing live
Cash to close
- Down payment
- $124,975
- Closing costs
- $14,997
- Reserves months
- —
- Total cash needed
- —
Loan-product check · same deal, 3 products live
Conventional
25% down · 7.5% · 30yr
- Down + closing
- —
- Monthly P&I
- —
- Monthly cashflow
- —
- DSCR
- —
- Eligible?
- —
Personal DTI + credit; lowest rate.
DSCR
20% down · 8.5% · 30yr
- Down + closing
- —
- Monthly P&I
- —
- Monthly cashflow
- —
- DSCR
- —
- Eligible?
- —
No personal income docs; deal must DSCR.
Hard money
10% down · 12.0% · 12mo
- Down + closing
- —
- Monthly P&I
- —
- Monthly cashflow
- —
- DSCR
- —
- Eligible?
- —
Short-term bridge; refi at stabilization.
Rent comps 1 comps
| Address | Beds | Baths | Sqft | Rent | $/sqft | DOM | Units | Dist |
|---|---|---|---|---|---|---|---|---|
| 1729 Boulevard West Hartford, CT | 5.0 | 3.5 | 3004 | $6,500 | $2.16 | 23d | 1 | 1.14mi |
Listing history 5 events
-
2026-06-18days on market $499,900 Active 4 DOM
-
2026-06-17days on market $499,900 Active 3 DOM
-
2026-06-16days on market $499,900 Active 2 DOM
-
2026-06-15remarks 699-char remark
-
2026-06-15$499,900 Active 1 DOM
ⓘ Source: listings_history table (triggers on properties + properties_extension) + one-shot
backfill from property_details.listing_events for pre-trigger history.
Tax reassessment forecast CT · Partial reset (capped growth)
- Current annual tax
- $13,930 · $1,161/mo
- Projected year-2 tax
- $13,930 · $1,161/mo
- Expected delta
- $0/yr ($0/mo · 0.0%)
ⓘ Screening estimate from a state-policy table — verify with the county assessor before closing.
Climate risk First Street
- Flood 1/10 Low FEMA zone X (unshaded) · 0% chance over 30 yrs
- Wildfire 1/10 Low
- Heat 5/10 Major 7 d/yr ≥98°F today · 16 d/yr by 30 yrs out
- Wind 6/10 Major 27% chance of damaging wind over 30 yrs
- Air quality 3/10 Moderate 3 unhealthy d/yr today · 4 by 30 yrs out
Nearby sold comps map
Loading sold comps map…
Walkable amenities ~0.75 mi
Loading nearby amenities…
Taxation est. · year 1
- Rental income
- $68,040
- − Mortgage interest
- −$28,002
- − Property taxes
- −$13,930
- − Insurance
- −$2,500
- − Repairs & maintenance
- −$5,443
- − Management
- −$5,443
- − Depreciation
- −$14,543
- Taxable loss
- −$1,821
- Est. tax savings @ 24.0%
- +$437
- After-tax cash flow
- $6,301/yr
For passive investors: Depreciation is non-cash, so a rental often shows a tax loss while cash-flowing — sheltering income. Rental losses are passive: they offset passive income freely, and up to $25,000/yr can offset ordinary (W-2) income if you actively participate and your MAGI is under $100k (phasing out to $0 by $150k); unused losses carry forward. On sale, claimed depreciation is recaptured at up to 25%, and gains may owe capital-gains tax (a 1031 exchange can defer both). Figures are a year-1 estimate at your 24.0% rate — not tax advice; consult a CPA.
Schools (NCES district)
- District
- West Hartford School District
- NCES district ID
- 0904920
- Math proficiency
- 56% ▼ -6.00%
- Reading proficiency
- 67% ▼ -5.00%
- Median HH income
- $85,173
- Composite
- 55.64/100
- National rank
- #1228
- State rank
- #39 of 153 in CT
Livability — West Hartford
- Score
- 79/100
- State rank
- #27
- US rank
- #1989
Category grades
Schools grade is shown separately in the Schools card above.
Census & demographics
- Census place
- West Hartford, CT
- County
- Hartford County · 754,208 people
- City population
- 63,441
- Metro
- Hartford-East Hartford-Middletown, CT
- Population (ZIP)
- 14,793
- Household income
- $99,688
- Rent vs Own
- Severe rent burden
- 652.0
Population outlook (Capitol County) Hauer SSP2
- By 2040
- 1,063,519
Race, ethnicity, and origin ACS 2023
- Neighborhood character
- Predominantly White (69%)
- Race & ethnicity
- White 69% Hispanic / Latino 11% Black 11% Two or more races 8% Asian 5%
- Hispanic origin (detail)
- Mexican 2% Puerto Rican 4%
- Common ancestry
- Romanian 4% Lithuanian 3% Italian 3%
- Foreign-born
- 15% · Canada, Jamaica
- Languages at home
- 78% English-only · Spanish 9% Other Indo-European 7% Russian/Polish/Slavic 1%
Political lean MEDSL · Capitol
- 2024 margin
- Strong D (+21.9) · D 60.1% · R 38.2% · Other 1.7%
- All cycles
- 2024: D+21.9
Not yet ingested
- Civics
- —
Market trends
- HPI YoY
- ▼ -240.37%
- Current HPI
- 174.078
- Rent YoY
- ▲ 5.37%
- Metro
- Hartford-East Hartford-Middletown, CT
- State GDP YoY
- ▲ 1.06%
- F500 in state
- 38
Industry mix (Fortune 500 HQ in CT)
| Industry | F500 HQs | Revenue |
|---|---|---|
| Industrial Machinery | 4 | $38B |
|
||
| Insurance | 3 | $71B |
|
||
| Financial Services | 2 | $25B |
|
||
| Transportation / Logistics | 2 | $18B |
|
||
| Healthcare | 1 | $247B |
|
||
| Telecommunications | 1 | $55B |
|
||
Price history
1 event — show timeline
- 2026-06-14 Listed $499,900 Smart MLS
Property tax history
+3.6%/yrLatest (2025): $13,930 · +5.7% YoY. Source: county tax records.
Cash-flow waterfall
monthlySold comps — $/sqft
last 12 mo · ≤1 miLoading sold comps…