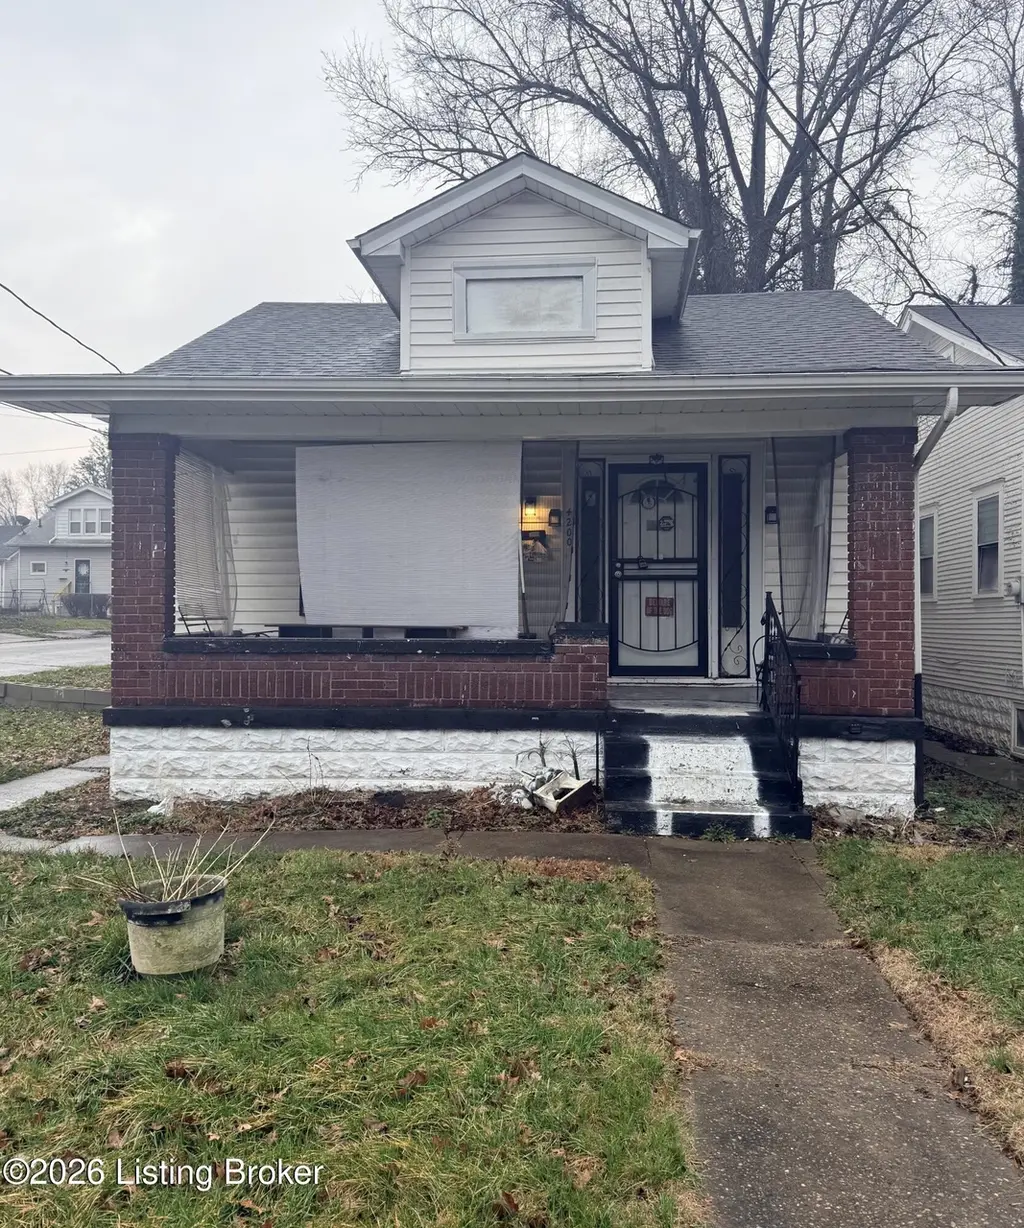
4200 Sunset Ave · Louisville, KY
Flood risk 1/10 · Minimal
- FEMA flood zone
- X (shaded)
- Chance of flooding over 30 yrs
- 0.0%
- Est. flood insurance / yr
- $473 – $860
Fire risk 1/10 · Minimal
- Est. fire insurance / yr
- $839 – $1,559
Heat risk 5/10 · Moderate
- Hot days now (above 104°F)
- 7 days/yr
- Hot days in 30 yrs
- 20 days/yr
Wind risk 2/10 · Minimal
- Chance of severe wind over 30 yrs
- 1.0%
Air-quality risk 2/10 · Minimal
- Unhealthy air days now
- 1 days/yr
- Unhealthy air days in 30 yrs
- 3 days/yr
Risk factors via First Street. Map © Google.
Why this score? — see what drove the B- grade
The composite is a weighted blend of 9 inputs, each scored 0–100. Each bar is that input's sub-score; the figure is the points it added to the 100-point composite (weight × sub-score).
- Cash flow +26.1/30.0
- ARV discount +15.0/15.0
- DSCR +8.8/10.0
- 1% rule +6.6/10.0
- Rent growth +3.7/5.0
- Livability +3.2/5.0
- Condition / age +2.5/5.0
- Schools +2.3/10.0
- Appreciation +0.0/10.0
$94,900
🖨 Deal sheet 📄 Offer letter ✓ Due diligence
Listing remarks MLS
Come see this beautifully restored 2 bedroom 1 bath home on a corner lot right next to Chickasaw park. Looking to take a nice walk in the park steps from your front door? This is the home for you. Each room in this home has been remodeled to capture the elegance and character of the original architect. Come see for yourself!
Key facts
- Restored elegance
- Corner lot
- 4,251 sq ft lot
Tags
Property features AI
Finance
- HOA & community: No association fee
Exterior
- Parking: 1-car garage; Front and rear entry
- Utilities: Electricity connected; Natural gas available
- Home design: Single family residence; 1 story; Built in 1928; Shingle roof
- Construction: Vinyl siding construction; Concrete block and poured concrete foundation
- Exterior features: Corner lot; Full chain-link fencing
Interior
- Kitchen: Kitchen on the first floor
- Bedrooms: 2 bedrooms, both on the first floor; Primary bedroom on the first floor
- Bathrooms: 1 full bathroom on the first floor
- Heating & cooling: Natural gas heating; Central air conditioning
- Interior features: Basement unfinished; First-floor laundry; Sidewalk on lot
- Laundry & utility: Laundry on the first floor
Neighborhood map
What this means for you Summary
Snapshot
- This is a 2-bed/1.0-bath single-family listed at $95k.
Deal economics
- At list price, monthly cash flow is $238 ($3k/yr) — positive.
- The deal already cash-flows at list — no discount required.
- Meets the 1% rule at list price ($1k rent vs $95k).
- Recommended offer: $89k (6.0% below list) — sets the bar for market timing.
- Cap rate 9.3% vs local median 5.0% in Louisville — top-decile yield for the area; either an underpriced asset or a hidden risk that comps aren't pricing in. Stress-test before assuming the spread holds.
Location & tenants
- Location reads 63/100 on livability (#333 in KY) — a middle-class / working-renter tenant base. Strengths: cost of living A+, housing A+; Watch: employment C-, health & safety D+, schools D-.
- Jefferson County (urban): math 19% / reading 35% proficiency, ranked #121 of 165 in KY (top 73%) — low school quality limits family demand, transient renter base, plan for 1-2y turnover.
- Market conditions: Rents rising fast (+4.9%/yr); 140 active listings in the ZIP; 40 comparable units currently listed for rent nearby; rentals at typical pace (median 21d on market — plan ~3-4 weeks tenant-placement turnaround); lower-income renter base — watch delinquency; 2,836 units permitted in Jefferson County in 2024 (1,558 in 5+ unit buildings).
- This rent runs 42% of the median local income ($32k/yr) — at the standard rent-burdened threshold; future hikes will face affordability resistance.
Forward outlook
- Local home prices are declining (-3.0%/yr); year-one equity from $656 of loan paydown is wiped out by about $3k of value loss. Plan a longer hold.
- Jefferson County population projected at +13% by 2050 — modest demand growth; plan on rents tracking national, not racing it.
- At projected returns (-3.0% appreciation + 4.9% rent growth), your $27k cash investment doubles in ~9 years — after that, you're playing with house money.
Negotiation context
- It's been on market 86 days — a 6% lower offer ($89k) is reasonable based on typical stale-listing flexibility.
- 2 sale attempts since 7y ago; this cycle's ask has dropped $10k (10%) from the opening price — seller is motivated, your offer sets the floor, not the list.
- Current owner paid $72k; 32% above their basis — modest negotiation headroom, anchor on the comps not their cost.
Risks & watch-outs
- Watch-outs: built in 1928 — expect roof / HVAC / electrical / plumbing capex.
- Climate carrying-cost: extreme-heat days projected 7→20/yr by 2055 (HVAC capex compounding) — expect insurance premiums to compound above CPI over the hold.
Questions for the listing agent
- It's been on market 86 days. Have you received any prior offers? Is the seller open to a 6% concession, seller financing, or rate buy-down credit?
- Built in 1928 — when were the roof, HVAC, electrical panel, plumbing, and water heater last replaced?
- Why hasn't it sold? Are there any deal-killer items the seller is aware of (foundation, flood, title, zoning, code violations)?
- Is there a deadline driving the sale (1031 exchange, divorce, estate, relocation)? That informs how much negotiation room exists.
- Schools are D-rated, which usually means shorter tenancies and higher turnover. Who's the typical renter profile here, and what's been the actual vacancy rate?
- Crime grade is F in this area — have there been break-ins, vandalism, or insurance claims at this property in the last 3 years? What carrier currently insures it and at what premium?
- What's the average days-on-market for RENTAL listings here right now (not sales)? A rising rental-DOM trend means longer vacancies and softer asking-rent achievability than the comps imply.
- What's the recent tenant-quality profile in this submarket — average credit score on applications, eviction rate, late-payment / NSF rate, and stable-employment percentage? A property-management company in the area should have these aggregated.
- How much new for-sale + rental construction is in the pipeline within 1–3 miles? Heavy new supply typically softens prices + rents 12–24 months out; constrained supply supports both.
Investment metrics
- 1% rule
- 1.16% ✓
- Cap rate
- 9.30%
- Cash-on-cash
- 10.74%
- DSCR
- 1.48
- GRM
- 7.2
CMA / ARV
- ARV (on-the-fly)
- $114,240
- Comps found
- 12
Show comp detail 12 sales within ~0.75 mi
| Address | Dist | Beds/Ba | Sqft | Sold | Price | $/sf | Match |
|---|---|---|---|---|---|---|---|
| 4401 Sunset Ave | 0.20mi | 2/1.0 | 800 (-2%) | 6mo | $24,500 | $31 | 82 |
| 1120 S 42nd St | 0.04mi | 3/1.0 (+1) | 869 (+6%) | 9mo | $85,000 | $98 | 75 |
| 1051 Cecil Ave | 0.16mi | 1/1.0 (-1) | 896 (+10%) | 4mo | $28,000 | $31 | 68 |
| 1023 S 40th St | 0.30mi | 2/1.0 | 737 (-10%) | 4mo | $110,000 | $149 | 67 |
| 1012 Woodway Ln | 0.18mi | 2/1.0 | 744 (-9%) | 14mo | $115,000 | $155 | 65 |
| 1004 S 39th St | 0.36mi | 2/1.0 | 788 (-3%) | 18mo | $55,000 | $70 | 63 |
| 1004 S 45th St | 0.35mi | 2/1.0 | 700 (-14%) | 2mo | $78,000 | $111 | 59 |
| 4412 Exley Ct | 0.27mi | 3/1.0 (+1) | 900 (+10%) | 12mo | $140,000 | $156 | 56 |
| 1011 S 36th St | 0.62mi | 2/1.0 | 867 (+6%) | 19mo | $135,000 | $156 | 45 |
| 827 Sutcliffe Ave | 0.70mi | 2/1.0 | 896 (+10%) | 18mo | $125,000 | $140 | 36 |
| 3505 Regatta Way | 0.69mi | 3/1.0 (+1) | 925 (+13%) | 10mo | $170,000 | $184 | 32 |
| 808 S 37th St | 0.66mi | 2/1.0 | 930 (+14%) | 20mo | $60,000 | $65 | 30 |
Match score weights: distance 35% · size 25% · config 20% · recency 20%. Top-matched comps best support the ARV.
Projected returns pro-forma
-3.0% appreciation · 4.87% rent growth · sell at horizon
- IRR
- 1.8%
- Equity multiple
- 1.07×
- Total profit
- $1,885
- Equity at exit
- $14,150
- IRR
- 13.1%
- Equity multiple
- 2.13×
- Total profit
- $30,153
- Equity at exit
- $8,205
Cash invested: $26,572 (down + closing). Projections, not guarantees.
Landlord ↔ Tenant lean methodology
- Overall (STATE)
- 83 Strongly Landlord-Friendly
- State Kentucky
- 83 Strongly Landlord-Friendly · R+16
- County
- — inherits STATE
- City
- — inherits STATE
ZIP-level market 40211
- Home prices YoY
- -33.4%
- Rents YoY
- 4.9%
- Active inventory
- 140
- Price-to-rent
- 7.2×
Monthly cashflow live
- Estimated rent
- $1,101 high interval (Pro) →
- Mortgage (P&I)
- −$498
- Tax from tax record
- −$94 /mo · $1,134/yr
- Insurance
- −$40
- HOA
- −$0
- Vacancy / Maint / Mgmt
- −$231
- Net cashflow
- $238
Break-even live
UW: 25.0% down · 7.5% · 30yr · 1.5% tax · 5.0% vac · 8.0% maint · 8.0% mgmt
Financing live
Cash to close
- Down payment
- $23,725
- Closing costs
- $2,847
- Reserves months
- —
- Total cash needed
- —
Loan-product check · same deal, 3 products live
Conventional
25% down · 7.5% · 30yr
- Down + closing
- —
- Monthly P&I
- —
- Monthly cashflow
- —
- DSCR
- —
- Eligible?
- —
Personal DTI + credit; lowest rate.
DSCR
20% down · 8.5% · 30yr
- Down + closing
- —
- Monthly P&I
- —
- Monthly cashflow
- —
- DSCR
- —
- Eligible?
- —
No personal income docs; deal must DSCR.
Hard money
10% down · 12.0% · 12mo
- Down + closing
- —
- Monthly P&I
- —
- Monthly cashflow
- —
- DSCR
- —
- Eligible?
- —
Short-term bridge; refi at stabilization.
Rent comps 40 comps
| Address | Beds | Baths | Sqft | Rent | $/sqft | DOM | Units | Dist |
|---|---|---|---|---|---|---|---|---|
| 4221 Sunset Ave Louisville, KY | 3.0 | 1.0 | 1075 | $1,199 | $1.12 | 23d | 1 | 0.09mi |
| 833 S 41st St Louisville, KY | 3.0 | 2.0 | 786 | $1,250 | $1.59 | 23d | 1 | 0.41mi |
| 4514 Winnrose Way Louisville, KY | 3.0 | 1.5 | 1064 | $1,500 | $1.41 | 1d | 1 | 0.43mi |
| 714 S 42nd St Louisville, KY | 3.0 | 1.0 | 1078 | $1,150 | $1.07 | 16d | 1 | 0.51mi |
| 3611 Regatta Way Louisville, KY | 3.0 | 1.0 | 1035 | $1,450 | $1.40 | 16d | 1 | 0.52mi |
| 823 S 38th St Louisville, KY | 3.0 | 1.0 | 1100 | $1,195 | $1.09 | 3d | 1 | 0.56mi |
| 714 S 40th St #2 Louisville, KY | 3.0 | 1.0 | 1000 | $1,250 | $1.25 | 23d | 1 | 0.58mi |
| 729 S 39th St Unit 1 Louisville, KY | 2.0 | 1.0 | 800 | $800 | $1.00 | 23d | 1 | 0.61mi |
| 3515 W Kentucky St Unit 3515-12 Louisville, KY | 1.0 | 1.0 | 700 | $695 | $0.99 | 23d | 1 | 0.68mi |
| 1145 Louis Coleman Jr Dr Louisville, KY | 2.0 | 1.0 | 913 | $875 | $0.96 | 23d | 1 | 0.73mi |
| 4309 Elliott Ave Unit 1 Louisville, KY | 2.0 | 1.0 | 750 | $650 | $0.87 | 3d | 1 | 0.84mi |
| 4309 Elliott Ave Unit 1 Louisville, KY | 2.0 | 1.0 | 750 | $695 | $0.93 | 23d | 1 | 0.84mi |
| 3215 Virginia Ave Louisville, KY | 3.0 | 1.0 | 975 | $924 | $0.95 | 23d | 1 | 0.85mi |
| 652 S 37th St #9 Louisville, KY | 3.0 | 1.0 | 1070 | $1,095 | $1.02 | 23d | 1 | 0.86mi |
| 648 S 37th St #3 Louisville, KY | 2.0 | 1.0 | 807 | $850 | $1.05 | 23d | 1 | 0.86mi |
| 814 S 33rd St Louisville, KY | 3.0 | 1.0 | 1104 | $1,350 | $1.22 | 3d | 1 | 0.91mi |
| 1804 Russell Lee Dr Louisville, KY | 1.0–3.0 | 1.0–1.5 | 810 | $1,124 | $1.39 | 1d | 1 | 0.96mi |
| 691 Madelon Ct Louisville, KY | 1.0 | 1.0 | 650 | $675 | $1.04 | 11d | 1 | 0.98mi |
| 3122 W Kentucky St Louisville, KY | 3.0 | 1.0 | 1030 | $1,150 | $1.12 | 23d | 1 | 0.98mi |
| 832 Hazel St Louisville, KY | 2.0 | 1.0 | 720 | $1,095 | $1.52 | 3d | 1 | 1.02mi |
| 3819 River Park Dr Louisville, KY | 3.0 | 1.0 | 1108 | $1,090 | $0.98 | 20d | 1 | 1.03mi |
| 2016 S 40th St Louisville, KY | 2.0 | 1.0 | 700 | $980 | $1.40 | 16d | 1 | 1.03mi |
| 4018 Vermont Ave Unit 1 Louisville, KY | 2.0 | 1.0 | 700 | $699 | $1.00 | 3d | 1 | 1.04mi |
| 1443 S 32nd St Unit 2 Louisville, KY | 1.0 | 1.0 | 550 | $780 | $1.42 | 23d | 1 | 1.06mi |
| 1418 Beech St Unit 2 Louisville, KY | 2.0 | 1.0 | 1000 | $980 | $0.98 | 21d | 1 | 1.12mi |
| 666 Eastlawn Ave Louisville, KY | 2.0 | 1.0 | 936 | $895 | $0.96 | 16d | 1 | 1.13mi |
| 701 Hazel St Unit 3 Louisville, KY | 2.0 | 1.0 | 832 | $800 | $0.96 | 10d | 1 | 1.14mi |
| 2913 Dumesnil St Apt 3 Louisville, KY | 3.0 | 1.0 | 1112 | $740 | $0.67 | 10d | 1 | 1.17mi |
| 1439 Beech St Apt 1 Louisville, KY | 3.0 | 1.5 | 1000 | $820 | $0.82 | 23d | 1 | 1.17mi |
| 3421 River Park Dr Louisville, KY | 3.0 | 1.0 | 994 | $1,250 | $1.26 | 23d | 1 | 1.18mi |
| 2821 Greenwood Ave #1 Louisville, KY | 3.0 | 1.0 | 1113 | $1,300 | $1.17 | 23d | 1 | 1.22mi |
| 2807 Dumesnil St Unit 101 Louisville, KY | 1.0 | 1.0 | 750 | $950 | $1.27 | 23d | 1 | 1.25mi |
| 2128 S 40th St Louisville, KY | 2.0 | 1.0 | 942 | $980 | $1.04 | 16d | 1 | 1.25mi |
| 302 Cecil Ave Louisville, KY | 2.0 | 1.0 | 984 | $1,025 | $1.04 | 16d | 1 | 1.31mi |
| 1339 S 28th St Unit 3 Louisville, KY | 3.0 | 1.0 | 1125 | $1,175 | $1.04 | 20d | 1 | 1.32mi |
| 247 Cecil Ave Louisville, KY | 3.0 | 2.0 | 1083 | $1,305 | $1.20 | 19d | 1 | 1.34mi |
| 2724 Garland Ave Unit 202 Louisville, KY | 2.0 | 1.0 | 950 | $745 | $0.78 | 3d | 1 | 1.35mi |
| 2708 Greenwood Ave Apt 1 Louisville, KY | 3.0 | 1.0 | 1100 | $1,300 | $1.18 | 23d | 1 | 1.35mi |
| 2710 W Kentucky St Apt 2 Louisville, KY | 3.0 | 1.0 | 1015 | $1,300 | $1.28 | 23d | 1 | 1.36mi |
| 2706 Hale Ave Unit 1 Louisville, KY | 3.0 | 1.0 | 1100 | $1,400 | $1.27 | 23d | 1 | 1.36mi |
Listing history 19 events
-
2026-06-18days on market $94,900 Active 86 DOM
-
2026-06-17days on market $94,900 Active 85 DOM
-
2026-06-16days on market $94,900 Active 84 DOM
-
2026-06-15days on market $94,900 Active 83 DOM
-
2026-06-13days on market $94,900 Active 81 DOM
-
2026-06-10days on market $94,900 Active 78 DOM
-
2026-06-09days on market $94,900 Active 77 DOM
-
2026-06-08days on market $94,900 Active 76 DOM
-
2026-06-07days on market $94,900 Active 75 DOM
-
2026-06-03days on market $94,900 Active 71 DOM
-
2026-06-02days on market $94,900 Active 70 DOM
-
2026-06-01days on market $94,900 Active 69 DOM
-
2026-05-31days on market $94,900 Active 68 DOM
-
2026-05-06price $94,900
-
2026-03-24$105,000 Active
-
2019-12-05soldstatus $72,000
-
2019-11-18soldstatus $72,000 Closed 326-char remark
Show marketing remark (326 chars)
Come see this beautifully restored 2 bedroom 1 bath home on a corner lot right next to Chickasaw park. Looking to take a nice walk in the park steps from your front door? This is the home for you. Each room in this home has been remodeled to capture the elegance and character of the original architect. Come see for yourself!
-
2019-11-01status Pending 326-char remark
Show marketing remark (326 chars)
Come see this beautifully restored 2 bedroom 1 bath home on a corner lot right next to Chickasaw park. Looking to take a nice walk in the park steps from your front door? This is the home for you. Each room in this home has been remodeled to capture the elegance and character of the original architect. Come see for yourself!
-
2019-10-19$74,500 Active 326-char remark
Show marketing remark (326 chars)
Come see this beautifully restored 2 bedroom 1 bath home on a corner lot right next to Chickasaw park. Looking to take a nice walk in the park steps from your front door? This is the home for you. Each room in this home has been remodeled to capture the elegance and character of the original architect. Come see for yourself!
ⓘ Source: listings_history table (triggers on properties + properties_extension) + one-shot
backfill from property_details.listing_events for pre-trigger history.
Tax reassessment forecast KY · Resets to sale price
- Current annual tax
- $1,134 · $94/mo
- Projected year-2 tax
- $1,134 · $94/mo
- Expected delta
- $0/yr ($0/mo · 0.0%)
ⓘ Screening estimate from a state-policy table — verify with the county assessor before closing.
Climate risk First Street
- Flood 1/10 Low FEMA zone X (shaded) · 0% chance over 30 yrs
- Wildfire 1/10 Low
- Heat 5/10 Major 7 d/yr ≥104°F today · 20 d/yr by 30 yrs out
- Wind 2/10 Low 100% chance of damaging wind over 30 yrs
- Air quality 2/10 Low 1 unhealthy d/yr today · 3 by 30 yrs out
Nearby sold comps map
Loading sold comps map…
Walkable amenities ~0.75 mi
Loading nearby amenities…
Taxation est. · year 1
- Rental income
- $13,209
- − Mortgage interest
- −$5,316
- − Property taxes
- −$1,134
- − Insurance
- −$474
- − Repairs & maintenance
- −$1,057
- − Management
- −$1,057
- − Depreciation
- −$2,761
- Taxable income
- $1,411
- Est. tax owed @ 24.0%
- −$339
- After-tax cash flow
- $2,516/yr
For passive investors: Depreciation is non-cash, so a rental often shows a tax loss while cash-flowing — sheltering income. Rental losses are passive: they offset passive income freely, and up to $25,000/yr can offset ordinary (W-2) income if you actively participate and your MAGI is under $100k (phasing out to $0 by $150k); unused losses carry forward. On sale, claimed depreciation is recaptured at up to 25%, and gains may owe capital-gains tax (a 1031 exchange can defer both). Figures are a year-1 estimate at your 24.0% rate — not tax advice; consult a CPA.
Schools (NCES district)
- District
- Jefferson County
- NCES district ID
- 2102990
- Math proficiency
- 19% ▼ -17.00%
- Reading proficiency
- 35% ▼ -11.00%
- Median HH income
- $47,885
- Composite
- 23.45/100
- National rank
- #7884
- State rank
- #121 of 165 in KY
Livability — Louisville
- Score
- 63/100
- State rank
- #333
- US rank
- #15887
Category grades
Schools grade is shown separately in the Schools card above.
Census & demographics
- Census place
- Louisville, KY
- County
- Jefferson County · 790,184 people
- City population
- 769,292
- Metro
- Louisville/Jefferson County, KY-IN
- Population (ZIP)
- 20,407
- Household income
- $31,749
- Rent vs Own
- Severe rent burden
- 1483.0
Population outlook (Jefferson County) Hauer SSP2
- Today (2025)
- 823,112 people
- By 2030
- 849,343 · +3.2%
- By 2040
- 895,696 · +8.8%
- By 2050
- 933,630 · +13.4%
- By 2075
- 1,028,262 · +24.9%
- By 2100
- 1,072,675 · +30.3%
Race, ethnicity, and origin ACS 2023
- Neighborhood character
- Predominantly Black (90%)
- Race & ethnicity
- Black 90% White 5% Two or more races 4% Hispanic / Latino 1%
- Common ancestry
- Italian 1%
- Foreign-born
- 1% · Canada
- Languages at home
- 98% English-only · Spanish 1%
Political lean MEDSL · Jefferson
- 2024 margin
- D (+16.6) · D 57.4% · R 40.9% · Other 1.7%
- 2008→2024 swing
- +4.5pp toward D · 2008: 12.0pp · 2024: 16.6pp
- All cycles
- 2024: D+16.6 2020: D+20.1 2016: D+13.3 2012: D+11.1 2008: D+12.0
Not yet ingested
- Civics
- —
Market trends
- HPI YoY
- ▼ -88.22%
- Current HPI
- 176.337
- Rent YoY
- ▲ 4.87%
- Metro
- Louisville/Jefferson County, KY-IN
- State GDP YoY
- ▲ 1.81%
- F500 in state
- 4
Industry mix (Fortune 500 HQ in KY)
| Industry | F500 HQs | Revenue |
|---|---|---|
| Healthcare | 1 | $118B |
|
||
| Food / Beverage | 1 | $7B |
|
||
Price history
+27.4% since first listed6 events — show timeline
- 2026-05-06 Price Changed $94,900 Metro Search MLS
- 2026-03-24 Listed $105,000 Metro Search MLS
- 2019-12-05 Sold (Public Records) $72,000 Public Records
- 2019-11-18 Sold (MLS) $72,000 Metro Search MLS
- 2019-11-01 Pending — Metro Search MLS
- 2019-10-19 Listed $74,500 Metro Search MLS
Property tax history
+5.1%/yrLatest (2025): $1,134 · -1.9% YoY. Source: county tax records.
Cash-flow waterfall
monthlySold comps — $/sqft
last 12 mo · ≤1 miLoading sold comps…