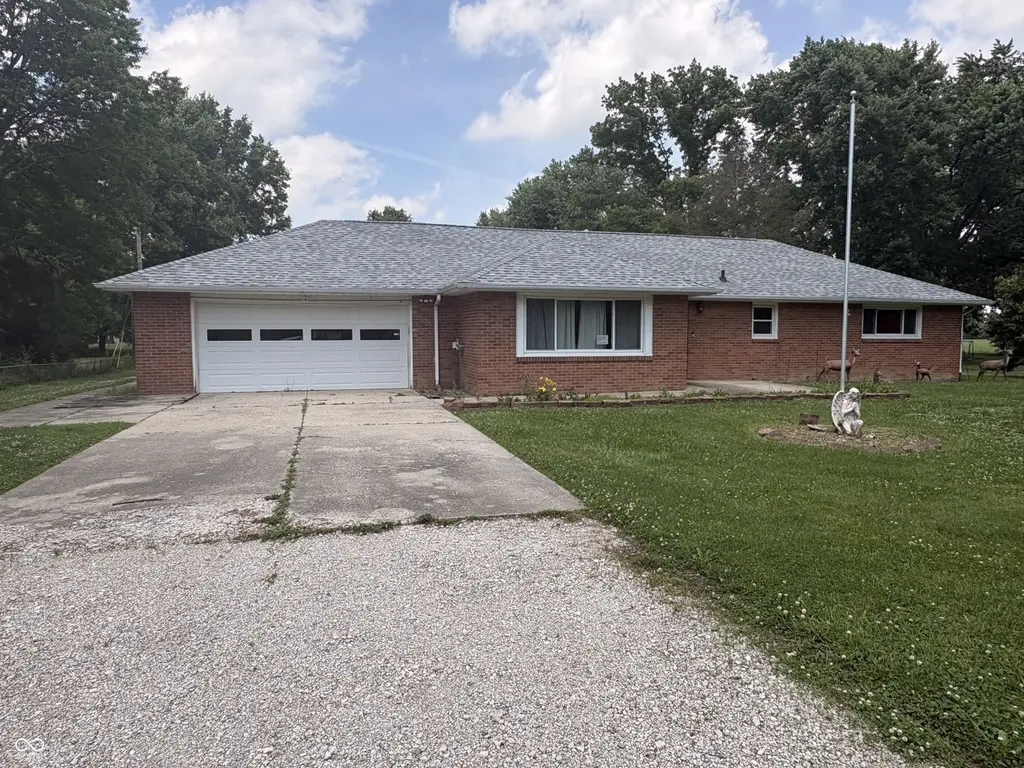
3214 Chapel Rd · Anderson, IN
Flood risk 1/10 · Minimal
- FEMA flood zone
- X (unshaded)
- Chance of flooding over 30 yrs
- 0.0%
- Est. flood insurance / yr
- $473 – $860
Fire risk 3/10 · Minor
- Est. fire insurance / yr
- $717 – $1,331
Heat risk 3/10 · Minor
- Hot days now (above 100°F)
- 7 days/yr
- Hot days in 30 yrs
- 18 days/yr
Wind risk 2/10 · Minimal
- Chance of severe wind over 30 yrs
- 1.0%
Air-quality risk 2/10 · Minimal
- Unhealthy air days now
- 1 days/yr
- Unhealthy air days in 30 yrs
- 2 days/yr
Risk factors via First Street. Map © Google.
Why this score? — see what drove the D grade
The composite is a weighted blend of 9 inputs, each scored 0–100. Each bar is that input's sub-score; the figure is the points it added to the 100-point composite (weight × sub-score).
- Cash flow +21.3/30.0
- DSCR +6.8/10.0
- 1% rule +4.3/10.0
- Rent growth +3.0/5.0
- Livability +3.0/5.0
- Condition / age +2.5/5.0
- Schools +1.6/10.0
- ARV discount +0.0/15.0
- Appreciation +0.0/10.0
$160,000
🖨 Deal sheet 📄 Offer letter ✓ Due diligence
Listing remarks
This solid brick ranch offers the opportunity to create a home that feels uniquely yours. Imagine mornings spent sipping coffee while watching the sunrise over the countryside, evenings gathered around a backyard fire, and weekends tackling fun projects that transform this house into your perfect retreat. The expensive updates are already taken care of for you, including an updated well, and updated septic system, giving you confidence in the home's strong foundation and major mechanical components. With great bones and a price that leaves room in the budget, you can focus on the exciting part: choosing the flooring, paint colors, and fixtures that fit your style. Whether you're dreaming of
Key facts
- Strong foundation
- Updated well
- Solid brick ranch
Tags
Property features AI
Exterior
- Parking: Attached 2-car garage
- Utilities: Private water source; Septic system; 100 Amp electric service
- Home design: Single-family residence; One story; Fixer condition
- Construction: Brick construction; Block foundation
- Exterior features: Nearly 1-acre lot in a rural subdivision setting; No fence; Has view
Interior
- Kitchen: Electric oven; Refrigerator
- Bedrooms: Three bedrooms on the main level
- Bathrooms: One full bathroom with tub and shower; One half bathroom
- Heating & cooling: Forced air heating; Central air conditioning
- Interior features: Eat-in kitchen; Smart thermostat; Basement
- Laundry & utility: Laundry connections (all); Laundry located in garage; Gas water heater
Neighborhood map
What this means for you Summary
Snapshot
- This is a 3-bed/1.5-bath single-family listed at $160k.
Deal economics
- At list price, monthly cash flow is $233 ($3k/yr) — positive.
- The deal already cash-flows at list — no discount required.
- To meet the 1% rule (rent ≥ 1% of price), the offer needs to be $149k (6.6% below list).
- Recommended offer: $149k (6.6% below list) — sets the bar for 1% rule.
- Cap rate 8.0% vs local median 6.5% in Anderson — meaningfully above typical; check what's discounted (condition, days-on-market, listing class) to confirm the premium yield is real.
Location & tenants
- Location reads 60/100 on livability (#521 in IN) — a middle-class / working-renter tenant base. Strengths: cost of living A+, housing A+; Watch: schools F, crime D-, amenities F.
- Anderson Community School Corporation (urban): math 15% / reading 23% proficiency, ranked #280 of 301 in IN (top 93%) — low school quality limits family demand, transient renter base, plan for 1-2y turnover; 70% free/reduced lunch — lower-income household profile, screen leases tightly.
- Market conditions: Rents rising (+1.8%/yr); 159 active listings in the ZIP; 184 units permitted in Madison County in 2024 (0 in 5+ unit buildings).
- This rent runs 31% of the median local income ($58k/yr) — at the standard rent-burdened threshold; future hikes will face affordability resistance.
Forward outlook
- Local home prices are declining (-3.0%/yr); year-one equity from $1k of loan paydown is wiped out by about $5k of value loss. Plan a longer hold.
- Madison County population projected at -14% by 2050 — secular population decline; favor cash flow + early exit over multi-decade hold.
Negotiation context
- Only 8 days on market — expect competitive offers; lowballing is unlikely to land.
Risks & watch-outs
- Watch-outs: built in 1955 — expect roof / HVAC / electrical / plumbing capex.
Questions for the listing agent
- Built in 1955 — when were the roof, HVAC, electrical panel, plumbing, and water heater last replaced?
- Is there a deadline driving the sale (1031 exchange, divorce, estate, relocation)? That informs how much negotiation room exists.
- Schools are F-rated, which usually means shorter tenancies and higher turnover. Who's the typical renter profile here, and what's been the actual vacancy rate?
- Crime grade is D in this area — have there been break-ins, vandalism, or insurance claims at this property in the last 3 years? What carrier currently insures it and at what premium?
- The area grade is low — what's the realistic commute time and amenity access for the typical tenant pool here? Any planned neighborhood developments (good or bad) we should know about?
- What's the average days-on-market for RENTAL listings here right now (not sales)? A rising rental-DOM trend means longer vacancies and softer asking-rent achievability than the comps imply.
- What's the recent tenant-quality profile in this submarket — average credit score on applications, eviction rate, late-payment / NSF rate, and stable-employment percentage? A property-management company in the area should have these aggregated.
- How much new for-sale + rental construction is in the pipeline within 1–3 miles? Heavy new supply typically softens prices + rents 12–24 months out; constrained supply supports both.
Investment metrics
- 1% rule
- 0.93% ✗
- Cap rate
- 8.04%
- Cash-on-cash
- 6.24%
- DSCR
- 1.28
- GRM
- 8.9
CMA / ARV
- ARV (on-the-fly)
- $114,768
- Comps found
- 1
Show comp detail 1 sale within ~0.75 mi
| Address | Dist | Beds/Ba | Sqft | Sold | Price | $/sf | Match |
|---|---|---|---|---|---|---|---|
| 3190 Chapel Rd | 0.02mi | 3/2.0 | 1,715 (+8%) | 0mo | $123,600 | $72 | 84 |
Match score weights: distance 35% · size 25% · config 20% · recency 20%. Top-matched comps best support the ARV.
Projected returns pro-forma
-3.0% appreciation · 1.82% rent growth · sell at horizon
- IRR
- -7.9%
- Equity multiple
- 0.71×
- Total profit
- $-12,918
- Equity at exit
- $23,857
- IRR
- 0.2%
- Equity multiple
- 1.01×
- Total profit
- $527
- Equity at exit
- $13,834
Cash invested: $44,800 (down + closing). Projections, not guarantees.
Landlord ↔ Tenant lean methodology
- Overall (STATE)
- 90 Strongly Landlord-Friendly
- State Indiana
- 90 Strongly Landlord-Friendly · R+11
- County
- — inherits STATE
- City
- — inherits STATE
ZIP-level market 46012
- Home prices YoY
- -18.6%
- Rents YoY
- 1.8%
- Active inventory
- 159
- Price-to-rent
- 8.9×
Monthly cashflow live
- Estimated rent
- $1,494 medium interval (Pro) →
- Mortgage (P&I)
- −$839
- Tax from tax record
- −$42 /mo · $501/yr
- Insurance
- −$67
- HOA
- −$0
- Vacancy / Maint / Mgmt
- −$314
- Net cashflow
- $233
Break-even live
UW: 25.0% down · 7.5% · 30yr · 1.5% tax · 5.0% vac · 8.0% maint · 8.0% mgmt
Financing live
Cash to close
- Down payment
- $40,000
- Closing costs
- $4,800
- Reserves months
- —
- Total cash needed
- —
Loan-product check · same deal, 3 products live
Conventional
25% down · 7.5% · 30yr
- Down + closing
- —
- Monthly P&I
- —
- Monthly cashflow
- —
- DSCR
- —
- Eligible?
- —
Personal DTI + credit; lowest rate.
DSCR
20% down · 8.5% · 30yr
- Down + closing
- —
- Monthly P&I
- —
- Monthly cashflow
- —
- DSCR
- —
- Eligible?
- —
No personal income docs; deal must DSCR.
Hard money
10% down · 12.0% · 12mo
- Down + closing
- —
- Monthly P&I
- —
- Monthly cashflow
- —
- DSCR
- —
- Eligible?
- —
Short-term bridge; refi at stabilization.
Listing history 6 events
-
2026-06-18days on market $160,000 Active 8 DOM
-
2026-06-17days on market $160,000 Active 7 DOM
-
2026-06-16days on market $160,000 Active 6 DOM
-
2026-06-15days on market $160,000 Active 5 DOM
-
2026-06-13remarks 699-char remark
-
2026-06-13$160,000 Active 3 DOM
ⓘ Source: listings_history table (triggers on properties + properties_extension) + one-shot
backfill from property_details.listing_events for pre-trigger history.
Tax reassessment forecast IN · Partial reset (capped growth)
- Current annual tax
- $501 · $42/mo
- Projected year-2 tax
- $930 · $78/mo
- Expected delta
- +$430/yr (+$36/mo · 85.8%)
ⓘ Screening estimate from a state-policy table — verify with the county assessor before closing.
Climate risk First Street
- Flood 1/10 Low FEMA zone X (unshaded) · 0% chance over 30 yrs
- Wildfire 3/10 Moderate
- Heat 3/10 Moderate 7 d/yr ≥100°F today · 18 d/yr by 30 yrs out
- Wind 2/10 Low 100% chance of damaging wind over 30 yrs
- Air quality 2/10 Low 1 unhealthy d/yr today · 2 by 30 yrs out
Nearby sold comps map
Loading sold comps map…
Walkable amenities ~0.75 mi
Loading nearby amenities…
Taxation est. · year 1
- Rental income
- $17,930
- − Mortgage interest
- −$8,962
- − Property taxes
- −$501
- − Insurance
- −$800
- − Repairs & maintenance
- −$1,434
- − Management
- −$1,434
- − Depreciation
- −$4,655
- Taxable income
- $144
- Est. tax owed @ 24.0%
- −$34
- After-tax cash flow
- $2,761/yr
For passive investors: Depreciation is non-cash, so a rental often shows a tax loss while cash-flowing — sheltering income. Rental losses are passive: they offset passive income freely, and up to $25,000/yr can offset ordinary (W-2) income if you actively participate and your MAGI is under $100k (phasing out to $0 by $150k); unused losses carry forward. On sale, claimed depreciation is recaptured at up to 25%, and gains may owe capital-gains tax (a 1031 exchange can defer both). Figures are a year-1 estimate at your 24.0% rate — not tax advice; consult a CPA.
Schools (NCES district)
- District
- Anderson Community School Corporation
- NCES district ID
- 1800150
- Math proficiency
- 15% ▼ -14.00%
- Reading proficiency
- 23% ▼ -7.00%
- Median HH income
- $38,208
- Composite
- 15.93/100
- National rank
- #9250
- State rank
- #280 of 301 in IN
Livability — Anderson
- Score
- 60/100
- State rank
- #521
- US rank
- #18709
Category grades
Schools grade is shown separately in the Schools card above.
Census & demographics
- County
- Madison County · 69,445 people
- City population
- 57,762
- Metro
- Indianapolis-Carmel-Anderson, IN
- Population (ZIP)
- 20,855
- Household income
- $58,041
- Rent vs Own
- Severe rent burden
- 987.0
Population outlook (Madison County) Hauer SSP2
- Today (2025)
- 125,800 people
- By 2030
- 122,640 · -2.5%
- By 2040
- 115,420 · -8.3%
- By 2050
- 108,148 · -14.0%
- By 2075
- 91,838 · -27.0%
- By 2100
- 75,670 · -39.8%
Race, ethnicity, and origin ACS 2023
- Neighborhood character
- Predominantly White (85%)
- Race & ethnicity
- White 85% Hispanic / Latino 5% Two or more races 4% Black 4%
- Hispanic origin (detail)
- Mexican 4%
- Common ancestry
- Slovak 3% Serbian 2% Italian 1%
- Foreign-born
- 2% · Canada, Vietnam
- Languages at home
- 96% English-only · Spanish 3%
Political lean MEDSL · Madison
- 2024 margin
- Strong R (+26.9) · D 35.6% · R 62.5% · Other 1.9%
- 2008→2024 swing
- -33.5pp toward R · 2008: 6.5pp · 2024: -26.9pp
- All cycles
- 2024: R+26.9 2020: R+22.6 2016: R+25.7 2012: R+4.5 2008: D+6.5
Not yet ingested
- Civics
- —
Market trends
- HPI YoY
- ▼ -61.16%
- Current HPI
- 266.9819
- Rent YoY
- ▲ 1.82%
- Metro
- Indianapolis-Carmel-Anderson, IN
- State GDP YoY
- ▲ 2.90%
- F500 in state
- 18
Industry mix (Fortune 500 HQ in IN)
| Industry | F500 HQs | Revenue |
|---|---|---|
| Industrial Machinery | 2 | $37B |
|
||
| Healthcare | 1 | $177B |
|
||
| Pharmaceuticals | 1 | $45B |
|
||
| Metals / Steel | 1 | $18B |
|
||
| Agriculture | 1 | $17B |
|
||
| Packaging | 1 | $12B |
|
||
Price history
1 event — show timeline
- 2026-06-09 Listed $160,000 MIBOR as Distributed by MLS Grid
Property tax history
+1.4%/yrLatest (2024): $501 · +1.9% YoY. Source: county tax records.
Cash-flow waterfall
monthlySold comps — $/sqft
last 12 mo · ≤1 miLoading sold comps…