 🏗️ New Construction
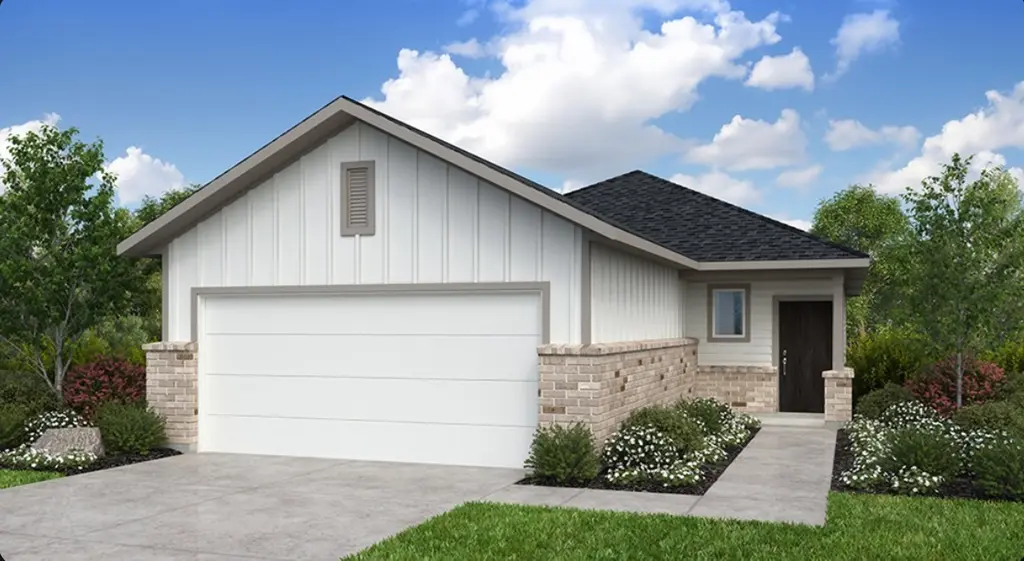
8147 Copper Meadows Ln · Houston, TX
Flood risk 4/10 · Minor
- FEMA flood zone
- X (unshaded)
- Chance of flooding over 30 yrs
- 0.2%
- Est. flood insurance / yr
- $507 – $1,088
Fire risk 4/10 · Minor
- Est. fire insurance / yr
- $1,222 – $2,270
Heat risk 9/10 · Severe
- Hot days now (above 110°F)
- 7 days/yr
- Hot days in 30 yrs
- 22 days/yr
Wind risk 9/10 · Severe
- Chance of severe wind over 30 yrs
- 99.0%
Air-quality risk 2/10 · Minimal
- Unhealthy air days now
- 2 days/yr
- Unhealthy air days in 30 yrs
- 2 days/yr
Risk factors via First Street. Map © Google.
Why this score? — see what drove the D- grade
The composite is a weighted blend of 9 inputs, each scored 0–100. Each bar is that input's sub-score; the figure is the points it added to the 100-point composite (weight × sub-score).
- Cash flow +8.5/30.0
- ARV discount +7.5/15.0
- Condition / age +4.8/5.0
- Schools +4.4/10.0
- Livability +3.7/5.0
- 1% rule +2.9/10.0
- DSCR +2.3/10.0
- Rent growth +2.2/5.0
- Appreciation +0.0/10.0
$295,990
🖨 Deal sheet (PDF) 📄 Offer letter ✓ Due diligence
Listing remarks
What's Special: White Cabinets | Flat Lot | Close to Park | Close to Amenity. New Construction, September Completion! Built by Taylor Morrison, America's Most Trusted Home Builder. Welcome to the Austin at 8147 Copper Meadows Lane in Mason Woods. This single-story home offers open living and comfort. The spacious great room flows into the kitchen and dining area. A covered patio extends the living outdoors. The private primary suite features a walk-in closet and well-designed bath, while two bedrooms and a two-car garage add flexibility and convenience. Mason Woods offers easy access to major employers and top shopping and dining, with quick routes to the Grand Parkway, I-10, and US 290 for
Key facts
- Walk-in closet
- Covered patio
- 5,050 sq ft lot
Tags
Property features AI
Finance
- HOA & community: Community association managed by Crest Management; Annual association fee (covers common areas); Community amenities include fitness center, playground, and trails; Curbs in community
Exterior
- Parking: Attached garage (2 spaces)
- Security: Smoke detector(s)
- Utilities: Public water
- Home design: Residential property; New construction (under construction); Faces southwest; Slab foundation
- Construction: Brick construction; Composition roof; Built in 2026
- Exterior features: Covered patio; Patio; Deck; Fully fenced yard; Sprinkler/irrigation; Pond on lot; Subdivision setting
Interior
- Kitchen: Dishwasher; Disposal; Gas oven; Gas range; Microwave; Oven; Pantry; Granite counters
- Bedrooms: Primary bedroom (first floor) — approx. 13x12; Bedroom (first floor) — approx. 10x9; Bedroom (first floor) — approx. 10x9
- Flooring: Carpet; Plank; Vinyl
- Bathrooms: 2 full bathrooms; Primary bathroom (first floor)
- Heating & cooling: Central heating (gas); Central air (electric)
- Interior features: Double vanity; Granite counters; Pantry; Tub with shower; Programmable thermostat; Tankless water heater
- Laundry & utility: Washer hookup; Electric dryer hookup
Neighborhood map
What this means for you Summary
Snapshot
- This is a 3-bed/2.0-bath single-family listed at $296k. Condition is rated excellent.
Deal economics
- At list price, monthly cash flow is $-268 ($-3k/yr) — negative.
- To cash-flow at today's rent, offer at most $270k (8.9% below list).
- To meet the 1% rule (rent ≥ 1% of price), the offer needs to be $245k (17.3% below list).
- Recommended offer: $245k (17.3% below list) — sets the bar for 1% rule.
- Cap rate 5.2% vs local median 3.1% in Houston — top-decile yield for the area; either an underpriced asset or a hidden risk that comps aren't pricing in. Stress-test before assuming the spread holds.
Location & tenants
- Location reads 74/100 on livability (#184 in TX, #4,771 nationally) — a middle-class / working-renter tenant base. Strengths: amenities A+, cost of living A+, housing A+; Watch: crime F.
- Cypress-Fairbanks ISD (suburban): math 45% / reading 52% proficiency, ranked #161 of 826 in TX (top 20%) — families likely to look elsewhere, expect single-tenant / working-renter base with shorter leases.
- Zoned schools: Postma El (math 45% / reading 59%, grade C-, #742 of 4,322 statewide, top 19%, 1,247 students, 45% FRL); Rowe Middle (math 26% / reading 44%, grade F, #842 of 1,662 statewide, top 51%, 1,310 students, 80% FRL); Cypress-Fairbanks J J A E P (12 students, 0% FRL) — zoned schools at 42% FRL track the district average.
- Market conditions: Rents soft (-1.3%/yr); 2065 active listings in the ZIP; 10 comparable units currently listed for rent nearby; rentals lingering (median 46d on market — plan ~5-8 weeks vacancy on turnover, expect pricing pressure); 60% of comp listings sitting > 30 days — soft ceiling on asking rent; high-income renter base; 29,883 units permitted in Harris County in 2024 (8,621 in 5+ unit buildings).
Forward outlook
- Local home prices are declining (-3.0%/yr); year-one equity from $2k of loan paydown is wiped out by about $9k of value loss. Plan a longer hold.
- Harris County population projected at +47% by 2050 — long-run rental-demand tailwind backs the buy-and-hold thesis.
Negotiation context
- It's been on market 21 days — a 2% lower offer ($292k) is reasonable based on typical stale-listing flexibility.
Risks & watch-outs
- Climate carrying-cost: severe wind risk, 99% chance of damaging wind over 30y; extreme-heat days projected 7→22/yr by 2055 (HVAC capex compounding) — expect insurance premiums to compound above CPI over the hold.
Questions for the listing agent
- What do current leases actually rent for vs. the listed asking? Can we see a recent rent roll and the last 12 months of T-12 income?
- What does the HOA fee cover, when was the last increase, and are there any pending special assessments or reserve-fund shortfalls?
- Is there a deadline driving the sale (1031 exchange, divorce, estate, relocation)? That informs how much negotiation room exists.
- Schools are D-rated, which usually means shorter tenancies and higher turnover. Who's the typical renter profile here, and what's been the actual vacancy rate?
- Crime grade is F in this area — have there been break-ins, vandalism, or insurance claims at this property in the last 3 years? What carrier currently insures it and at what premium?
- The area grade is low — what's the realistic commute time and amenity access for the typical tenant pool here? Any planned neighborhood developments (good or bad) we should know about?
- What's the average days-on-market for RENTAL listings here right now (not sales)? A rising rental-DOM trend means longer vacancies and softer asking-rent achievability than the comps imply.
- What's the recent tenant-quality profile in this submarket — average credit score on applications, eviction rate, late-payment / NSF rate, and stable-employment percentage? A property-management company in the area should have these aggregated.
- How much new for-sale + rental construction is in the pipeline within 1–3 miles? Heavy new supply typically softens prices + rents 12–24 months out; constrained supply supports both.
Investment metrics
- 1% rule
- 0.79% ✗
- Cap rate
- 5.25%
- Cash-on-cash
- -3.73%
- DSCR
- 0.83
- GRM
- 10.5
CMA / ARV
- ARV (median comp)
- $308,464
- List price
- $295,990
- Delta
- -4.04%
- Verdict
- FAIR
- Comps
- 20 within 1.0 mi
Show comp detail 12 sales within ~0.75 mi
| Address | Dist | Beds/Ba | Sqft | Sold | Price | $/sf | Match |
|---|---|---|---|---|---|---|---|
| 8303 Blue Shell Ln | 0.25mi | 3/2.0 | 1,377 (+1%) | 4mo | $297,990 | $216 | 83 |
| 21715 Coral Mist Dr | 0.26mi | 3/2.0 | 1,391 (+2%) | 3mo | $313,990 | $226 | 82 |
| 21831 Yellow Pineapple Ln | 0.18mi | 3/2.0 | 1,444 (+6%) | 2mo | $307,790 | $213 | 80 |
| 8086 Magnolia Prairie Ln | 0.19mi | 3/2.0 | 1,443 (+6%) | 2mo | $311,438 | $216 | 80 |
| 8123 Kay Harbor Dr | 0.20mi | 3/2.0 | 1,535 (+12%) | 2mo | $310,990 | $203 | 69 |
| 21810 Black Tulip Ln | 0.28mi | 3/2.0 | 1,492 (+9%) | 4mo | $311,755 | $209 | 68 |
| 21819 Coral Mist Dr | 0.14mi | 3/2.0 | 1,555 (+14%) | 4mo | $311,690 | $200 | 67 |
| 8082 Magnolia Prairie Ln | 0.20mi | 3/2.0 | 1,555 (+14%) | 2mo | $299,890 | $193 | 66 |
| 7955 Fijian Cypress Dr | 0.66mi | 3/2.0 | 1,396 (+2%) | 2mo | $269,875 | $193 | 64 |
| 8334 Blue Shell Ln | 0.32mi | 3/2.0 | 1,535 (+12%) | 2mo | $316,990 | $207 | 63 |
| 8431 Manta Ray Dr | 0.47mi | 3/2.0 | 1,497 (+10%) | 2mo | $310,000 | $207 | 60 |
| 21815 White Bellflower Ln | 0.63mi | 3/2.0 | 1,479 (+8%) | 1mo | $275,000 | $186 | 56 |
Match score weights: distance 35% · size 25% · config 20% · recency 20%. Top-matched comps best support the ARV.
Projected returns pro-forma
-3.0% appreciation · 0.0% rent growth · sell at horizon
- IRR
- -26.1%
- Equity multiple
- 0.14×
- Total profit
- $-74,173
- Equity at exit
- $45,993
- IRR
- -37.6%
- Equity multiple
- -0.32×
- Total profit
- $-114,002
- Equity at exit
- $26,670
Cash invested: $86,370 (down + closing). Projections, not guarantees.
Landlord ↔ Tenant lean methodology
- Overall (STATE)
- 87 Strongly Landlord-Friendly
- State Texas
- 87 Strongly Landlord-Friendly · R+5
- County
- — inherits STATE
- City
- — inherits STATE
ZIP-level market 77433
- Home prices YoY
- -28.5%
- Rents YoY
- -1.3%
- Active inventory
- 2065
- Price-to-rent
- 10.1×
Monthly cashflow live
- Estimated rent
- $2,449 high interval (Pro) →
- Mortgage (P&I)
- −$1,618
- Tax est. 1.5%
- −$386 /mo · $4,627/yr
- Insurance
- −$129
- HOA
- −$71
- Vacancy / Maint / Mgmt
- −$514
- Net cashflow
- $-268
Break-even live
Sensitivity live
| Price | -10% $-55 | -5% $-162 | +0% $-268 | +5% $-375 | +10% $-482 |
|---|---|---|---|---|---|
| Rent | -10% $-462 | -5% $-365 | +0% $-268 | +5% $-172 | +10% $-75 |
| Rate | -1.0pp $-113 | -0.5pp $-190 | base $-268 | +0.5pp $-348 | +1.0pp $-430 |
UW: 25.0% down · 7.5% · 30yr · 1.5% tax · 5.0% vac · 8.0% maint · 8.0% mgmt
Financing live
Cash to close
- Down payment
- $77,116
- Closing costs
- $9,254
- Reserves months
- —
- Total cash needed
- —
Loan-product check · same deal, 3 products live
Conventional
25% down · 7.5% · 30yr
- Down + closing
- —
- Monthly P&I
- —
- Monthly cashflow
- —
- DSCR
- —
- Eligible?
- —
Personal DTI + credit; lowest rate.
DSCR
20% down · 8.5% · 30yr
- Down + closing
- —
- Monthly P&I
- —
- Monthly cashflow
- —
- DSCR
- —
- Eligible?
- —
No personal income docs; deal must DSCR.
Hard money
10% down · 12.0% · 12mo
- Down + closing
- —
- Monthly P&I
- —
- Monthly cashflow
- —
- DSCR
- —
- Eligible?
- —
Short-term bridge; refi at stabilization.
Rent comps 10 comps
| Address | Beds | Baths | Sqft | Rent | $/sqft | DOM | Units | Dist |
|---|---|---|---|---|---|---|---|---|
| 7911 Tuscan Cypress Dr Cypress, TX | 4.0 | 3.0 | 1730 | $2,475 | $1.43 | 46d | 1 | 0.67mi |
| 7558 Magnolia Orchid Ln Cypress, TX | 4.0 | 2.5 | 1743 | $2,390 | $1.37 | 46d | 1 | 0.74mi |
| 22025 Avalon Landing Ln Cypress, TX | 1.0–3.0 | 1.0–2.0 | 954 | $2,663 | $2.79 | 1d | 12 | 0.85mi |
| 21054 Montego Breeze Ln Cypress, TX | 3.0–5.0 | 2.0–3.5 | 1935 | $2,199 | $1.14 | 15d | 21 | 1.12mi |
| 21038 Treasure Gate Ln Cypress, TX | 4.0 | 2.5 | 1804 | $2,676 | $1.48 | 46d | 1 | 1.17mi |
| 21815 Sunshine Cove Ln Cypress, TX | 3.0 | 2.0 | 1780 | $2,650 | $1.49 | 46d | 1 | 1.17mi |
| 21235 Catalina Palm Dr Cypress, TX | 4.0 | 2.0 | 1756 | $2,600 | $1.48 | 46d | 1 | 1.20mi |
| 21447 FM 529 Rd Cypress, TX | 1.0–3.0 | 1.0–2.0 | 996 | $2,205 | $2.21 | 1d | 28 | 1.34mi |
| 21054 Breezeway Cove Dr Bridgeland, TX | 3.0–4.0 | 2.5–3.5 | 1784 | $2,450 | $1.37 | 1d | 41 | 1.45mi |
| 7310 Coconut Bay Dr Cypress, TX | 4.0 | 2.0 | 1620 | $2,307 | $1.42 | 46d | 1 | 1.46mi |
HOA detail
- Monthly dues
- $71 · $852/yr
Listing history 4 events
-
2026-06-02status $295,990 Pending 21 DOM
-
2026-06-01days on market $295,990 Active 21 DOM
-
2026-05-31days on market $295,990 Active 20 DOM
-
2026-05-11$295,990 Active 955-char remark
ⓘ Source: listings_history table (triggers on properties + properties_extension) + one-shot
backfill from property_details.listing_events for pre-trigger history.
Climate risk First Street
- Flood 4/10 Moderate FEMA zone X (unshaded) · 20% chance over 30 yrs
- Wildfire 4/10 Moderate
- Heat 9/10 Extreme 7 d/yr ≥110°F today · 22 d/yr by 30 yrs out
- Wind 9/10 Extreme 99% chance of damaging wind over 30 yrs
- Air quality 2/10 Low 2 unhealthy d/yr today · 2 by 30 yrs out
Nearby sold comps map
Loading sold comps map…
Walkable amenities ~0.75 mi
Loading nearby amenities…
Taxation est. · year 1
- Rental income
- $29,382
- − Mortgage interest
- −$17,279
- − Property taxes
- −$4,627
- − Insurance
- −$1,542
- − Repairs & maintenance
- −$2,351
- − Management
- −$2,351
- − HOA
- −$852
- − Depreciation
- −$8,973
- Taxable loss
- −$8,592
- Est. tax savings @ 24.0%
- +$2,062
- After-tax cash flow
- $-1,158/yr
For passive investors: Depreciation is non-cash, so a rental often shows a tax loss while cash-flowing — sheltering income. Rental losses are passive: they offset passive income freely, and up to $25,000/yr can offset ordinary (W-2) income if you actively participate and your MAGI is under $100k (phasing out to $0 by $150k); unused losses carry forward. On sale, claimed depreciation is recaptured at up to 25%, and gains may owe capital-gains tax (a 1031 exchange can defer both). Figures are a year-1 estimate at your 24.0% rate — not tax advice; consult a CPA.
Condition & rehab AI · 11 photos
This single-story home is in excellent condition with no visible repairs or maintenance needed. It offers a spacious layout, modern finishes, and a well-maintained exterior. Upgrades to the exterior and interior can further enhance its curb appeal and value.
Value-add opportunities
- Both Painting exterior and interior walls — Enhances curb appeal and interior aesthetics
- Both Landscaping improvements — Enhances curb appeal and adds value
- Resale Upgrading kitchen appliances — Modernizes the kitchen and appeals to potential buyers
- Resale Upgrading bathroom fixtures — Modernizes the bathrooms and appeals to potential buyers
Renovation cost estimate screening
Value-add ROI direction
- Both Painting exterior and interior walls — Enhances curb appeal and interior aesthetics ↑
- Both Landscaping improvements — Enhances curb appeal and adds value ↑
- Resale Upgrading kitchen appliances — Modernizes the kitchen and appeals to potential buyers ↑
- Resale Upgrading bathroom fixtures — Modernizes the bathrooms and appeals to potential buyers ↑
ⓘ Cost ranges are severity-bucket heuristics (US national rule-of-thumb). Get contractor quotes + a written scope before underwriting a rehab budget.
Schools (NCES district)
- District
- Cypress-Fairbanks ISD
- NCES district ID
- 4816110
- Math proficiency
- 45% ▼ -12.00%
- Reading proficiency
- 52% ▼ -2.00%
- Median HH income
- $72,025
- Composite
- 43.63/100
- National rank
- #2968
- State rank
- #161 of 826 in TX
Livability — Houston
- Score
- 74/100
- State rank
- #184
- US rank
- #4771
Category grades
Schools grade is shown separately in the Schools card above.
Census & demographics
- County
- Harris County · 4,702,590 people
- City population
- 3,226,434
- Metro
- Houston-The Woodlands-Sugar Land, TX
- Population (ZIP)
- 116,550
- Household income
- $143,934
- Rent vs Own
- Severe rent burden
- 1700.0
Population outlook (Harris County) Hauer SSP2
- Today (2025)
- 5,571,493 people
- By 2030
- 6,089,821 · +9.3%
- By 2040
- 7,142,806 · +28.2%
- By 2050
- 8,185,864 · +46.9%
- By 2075
- 10,574,329 · +89.8%
- By 2100
- 12,109,958 · +117.4%
Race, ethnicity, and origin ACS 2023
- Neighborhood character
- Highly diverse neighborhood (Simpson 0.73)
- Race & ethnicity
- White 39% Hispanic / Latino 27% Black 17% Two or more races 14% Asian 13%
- Hispanic origin (detail)
- Mexican 16%
- Common ancestry
- Lithuanian 2% Romanian 1% Italian 1%
- Foreign-born
- 21% · Canada, Vietnam, China
- Languages at home
- 66% English-only · Spanish 19% Other Indo-European 4% Vietnamese 4%
Political lean MEDSL · Harris
- 2024 margin
- Lean D (+5.5) · D 52.0% · R 46.4% · Other 1.6%
- 2008→2024 swing
- +3.9pp toward D · 2008: 1.6pp · 2024: 5.5pp
- All cycles
- 2024: D+5.5 2020: D+13.3 2016: D+12.4 2012: D+0.1 2008: D+1.6
Not yet ingested
- Civics
- —
Market trends
- HPI YoY
- ▼ -87.83%
- Current HPI
- 220.2136
- Rent YoY
- ▼ -1.27%
- Metro
- Houston-The Woodlands-Sugar Land, TX
- State GDP YoY
- ▲ 3.95%
- F500 in state
- 110
Industry mix (Fortune 500 HQ in TX)
| Industry | F500 HQs | Revenue |
|---|---|---|
| Energy | 16 | $1,198B |
|
||
| Technology | 5 | $198B |
|
||
| Engineering / Construction | 4 | $72B |
|
||
| Energy Services | 3 | $60B |
|
||
| Utilities | 3 | $41B |
|
||
| Healthcare | 2 | $330B |
|
||
Price history
2 events — show timeline
- 2026-06-01 Pending — HARMLS
- 2026-05-11 Listed $295,990 HARMLS
Cash-flow waterfall
monthlySold comps — $/sqft
last 12 mo · ≤1 miLoading sold comps…