10400 NW 30th Ct #202 · Sunrise, FL
Flood risk No data
- FEMA flood zone
- —
- Chance of flooding over 30 yrs
- —
- Est. flood insurance / yr
- —
Fire risk No data
- Est. fire insurance / yr
- —
Heat risk No data
- Hot days now (above threshold)
- —
- Hot days in 30 yrs
- —
Wind risk No data
- Chance of severe wind over 30 yrs
- —
Air-quality risk No data
- Unhealthy air days now
- —
- Unhealthy air days in 30 yrs
- —
Risk factors via First Street. Map © Google.
Why this score? — see what drove the C- grade
The composite is a weighted blend of 9 inputs, each scored 0–100. Each bar is that input's sub-score; the figure is the points it added to the 100-point composite (weight × sub-score).
- Cash flow +18.6/30.0
- 1% rule +8.0/10.0
- ARV discount +7.5/15.0
- DSCR +5.8/10.0
- Livability +4.2/5.0
- Schools +4.1/10.0
- Rent growth +2.7/5.0
- Condition / age +2.5/5.0
- Appreciation +0.0/10.0
$215,000
🖨 Deal sheet 📄 Offer letter ✓ Due diligence
Listing remarks
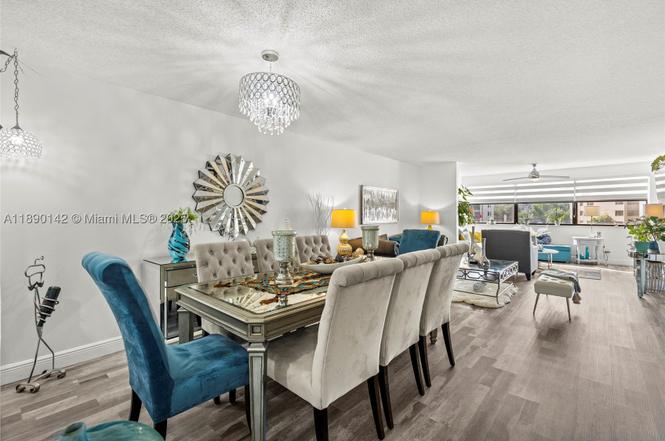
Gorgeous completely renovated 2 bedroom , 2 bath condo with over 1,300 sq. ft. of spacious living! This home features waterproof vinyl flooring, a beautifully redone kitchen with quartz countertops and subway tile backsplash, elegant light fixtures, and silhouette window treatments that enhance the abundant natural light throughout. Enjoy the convenience of an in-unit washer and dryer. Located in a vibrant 55+ community just minutes from Sawgrass Mall, offering incredible amenities -multiple pools, sauna, hot tub, golf, arts and crafts, live shows, bus service and so much more!
Key facts
- Quartz countertops
- Completely renovated
- Redone kitchen
Tags
Property features AI
Finance
- Financial info: Pets not allowed
- HOA & community: Monthly association fee; Association amenities include clubhouse, fitness center, billiard room, hobby room, library, pool, sauna, spa/hot tub, tennis courts, shuffleboard court, golf course access, transportation service, elevators; Association covers amenities, cable TV, golf, internet, grounds maintenance, recreation facilities, roof, sewer, trash, and water; Senior community; Golf course community
Exterior
- Parking: Assigned parking; Guest parking; 1 covered/assigned space (garage)
- Security: Smoke detector(s)
- Utilities: Cable available
- Home design: Attached property; 4-story building; Entry on level 2; Resale unit; Block construction
- Construction: Block construction
- Exterior features: Smoke detector(s); Association pool (heated)
Interior
- Kitchen: Electric range; Self-cleaning oven; Microwave; Dishwasher; Disposal; Icemaker; Refrigerator
- Bedrooms: Includes a bedroom on the main level
- Flooring: Laminate flooring; Vinyl flooring
- Bathrooms: 2 full bathrooms
- Heating & cooling: Central heating (electric); Central air conditioning; Ceiling fans
- Interior features: Blinds on windows; Accessible elevator installed; Entrance foyer; Living/dining room; Eat-in kitchen; Breakfast area; Pantry; Closet cabinetry; Dual sinks; Split bedrooms; Walk-in closets; Second floor entry; Bedroom on main level; Elevator
- Laundry & utility: Washer; Dryer; Utility room; Laundry room
Neighborhood map
What this means for you Summary
Snapshot
- This is a 2-bed/2.0-bath condo listed at $215k.
Deal economics
- At list price, monthly cash flow is $208 ($3k/yr) — positive.
- The deal already cash-flows at list — no discount required.
- Meets the 1% rule at list price ($3k rent vs $215k).
- Recommended offer: $189k (12.0% below list) — sets the bar for market timing.
- Cap rate 7.5% vs local median 4.9% in Sunrise — top-decile yield for the area; either an underpriced asset or a hidden risk that comps aren't pricing in. Stress-test before assuming the spread holds.
Location & tenants
- Location reads 83/100 on livability (#56 in FL, #986 nationally) — a professional / high-income tenant draw. Strengths: commute A+, housing A+, health & safety A+; Watch: employment C-, amenities F.
- Broward (suburban): math 42% / reading 53% proficiency, ranked #46 of 73 in FL (top 63%) — families likely to look elsewhere, expect single-tenant / working-renter base with shorter leases.
- Market conditions: Rents flat; 559 active listings in the ZIP; 40 comparable units currently listed for rent nearby; rentals at typical pace (median 22d on market — plan ~3-4 weeks tenant-placement turnaround); 2,111 units permitted in Broward County in 2024 (1,265 in 5+ unit buildings).
- At $2,795/mo this rent would consume 47% of the median local household income ($72k/yr) (locally 931% of renters already pay >50% of income on rent) — very limited rent-growth headroom before tenants either downsize or default.
Forward outlook
- Local home prices are declining (-3.0%/yr); year-one equity from $1k of loan paydown is wiped out by about $6k of value loss. Plan a longer hold.
- Broward County population projected at +34% by 2050 — long-run rental-demand tailwind backs the buy-and-hold thesis.
Negotiation context
- It's been on market 255 days — a 12% lower offer ($189k) is reasonable based on typical stale-listing flexibility.
- 2 sale attempts since 3y ago; this cycle's ask has dropped $30k (12%) from the opening price — seller is motivated, your offer sets the floor, not the list.
- Current owner paid $112k; list at $215k implies a 92% gain — meaningful room to come down on a strong offer.
Risks & watch-outs
- Watch-outs: HOA is 26% of rent.
Questions for the listing agent
- It's been on market 255 days. Have you received any prior offers? Is the seller open to a 12% concession, seller financing, or rate buy-down credit?
- What does the HOA fee cover, when was the last increase, and are there any pending special assessments or reserve-fund shortfalls?
- Any open or pending special assessments — roof, HVAC, plumbing, elevator, façade? What's the per-unit balance and payoff schedule, and is the seller paying it off at close or rolling it to the buyer?
- Why hasn't it sold? Are there any deal-killer items the seller is aware of (foundation, flood, title, zoning, code violations)?
- Is there a deadline driving the sale (1031 exchange, divorce, estate, relocation)? That informs how much negotiation room exists.
- What's the average days-on-market for RENTAL listings here right now (not sales)? A rising rental-DOM trend means longer vacancies and softer asking-rent achievability than the comps imply.
- What's the recent tenant-quality profile in this submarket — average credit score on applications, eviction rate, late-payment / NSF rate, and stable-employment percentage? A property-management company in the area should have these aggregated.
- How much new apartment / multifamily construction is in the pipeline within 1–3 miles? Heavy new supply (>2% of stock underway) typically softens rents 12–24 months out; light construction supports rent growth.
Investment metrics
- 1% rule
- 1.30% ✓
- Cap rate
- 7.46%
- Cash-on-cash
- 4.16%
- DSCR
- 1.18
- GRM
- 6.4
CMA / ARV
No comps found within radius.
Projected returns pro-forma
-3.0% appreciation · 0.6% rent growth · sell at horizon
- IRR
- -13.2%
- Equity multiple
- 0.54×
- Total profit
- $-27,795
- Equity at exit
- $32,057
- IRR
- -9.9%
- Equity multiple
- 0.48×
- Total profit
- $-31,429
- Equity at exit
- $18,589
Cash invested: $60,200 (down + closing). Projections, not guarantees.
Landlord ↔ Tenant lean methodology
- Overall (STATE)
- 87 Strongly Landlord-Friendly
- State Florida
- 87 Strongly Landlord-Friendly · R+3
- County
- — inherits STATE
- City
- — inherits STATE
ZIP-level market 33322
- Home prices YoY
- -33.3%
- Rents YoY
- 0.6%
- Active inventory
- 559
- Price-to-rent
- 6.4×
Monthly cashflow live
- Estimated rent
- $2,795 high interval (Pro) →
- Mortgage (P&I)
- −$1,127
- Tax from tax record
- −$69 /mo · $831/yr
- Insurance
- −$90
- HOA
- −$713
- Vacancy / Maint / Mgmt
- −$587
- Net cashflow
- $208
Break-even live
UW: 25.0% down · 7.5% · 30yr · 1.5% tax · 5.0% vac · 8.0% maint · 8.0% mgmt
Financing live
Cash to close
- Down payment
- $53,750
- Closing costs
- $6,450
- Reserves months
- —
- Total cash needed
- —
Loan-product check · same deal, 3 products live
Conventional
25% down · 7.5% · 30yr
- Down + closing
- —
- Monthly P&I
- —
- Monthly cashflow
- —
- DSCR
- —
- Eligible?
- —
Personal DTI + credit; lowest rate.
DSCR
20% down · 8.5% · 30yr
- Down + closing
- —
- Monthly P&I
- —
- Monthly cashflow
- —
- DSCR
- —
- Eligible?
- —
No personal income docs; deal must DSCR.
Hard money
10% down · 12.0% · 12mo
- Down + closing
- —
- Monthly P&I
- —
- Monthly cashflow
- —
- DSCR
- —
- Eligible?
- —
Short-term bridge; refi at stabilization.
Rent comps 40 comps
| Address | Beds | Baths | Sqft | Rent | $/sqft | DOM | Units | Dist |
|---|---|---|---|---|---|---|---|---|
| 3344 NW 103rd Ave Sunrise, FL | 3.0 | 2.0 | 1512 | $3,100 | $2.05 | 7d | 1 | 0.26mi |
| 3160 NW 101st Ave Sunrise, FL | 3.0 | 2.0 | 1780 | $4,000 | $2.25 | 24d | 1 | 0.27mi |
| 10240 NW 33rd Pl Sunrise, FL | 3.0 | 2.0 | 1512 | $2,950 | $1.95 | 24d | 1 | 0.28mi |
| 10758 NW 30th Pl Sunrise, FL | 2.0 | 2.0 | 1074 | $2,200 | $2.05 | 17d | 1 | 0.28mi |
| 2920 NW 99th Ter Sunrise, FL | 3.0 | 2.5 | 1680 | $4,800 | $2.86 | 24d | 1 | 0.38mi |
| 2734 N Nob Hill Rd Sunrise, FL | 2.0 | 2.0 | 954 | $2,400 | $2.52 | 24d | 1 | 0.44mi |
| 9999 Summerbreeze Dr Sunrise, FL | 1.0–2.0 | 1.0–2.0 | 889 | $2,200 | $2.47 | 1d | 8 | 0.45mi |
| 9999 Summerbreeze Dr Sunrise, FL | 1.0–2.0 | 1.0–2.0 | 889 | $2,200 | $2.47 | 18d | 6 | 0.45mi |
| 9999 Summerbreeze Dr Sunrise, FL | 1.0–2.0 | 1.0–2.0 | 889 | $2,200 | $2.47 | 5d | 9 | 0.45mi |
| 9999 Summerbreeze Dr Sunrise, FL | 1.0–2.0 | 1.0–2.0 | 889 | $2,200 | $2.47 | 1d | 9 | 0.45mi |
| 2698 N Nob Hill Rd Sunrise, FL | 2.0 | 2.0 | 1008 | $2,275 | $2.26 | 24d | 1 | 0.48mi |
| 10991 NW 30th Pl #10991 Sunrise, FL | 3.0 | 2.0 | 1144 | $2,950 | $2.58 | 24d | 1 | 0.53mi |
| 3633 NW 99th Ter Unit 7B Sunrise, FL | 2.0 | 2.0 | 1224 | $2,500 | $2.04 | 7d | 1 | 0.60mi |
| 3633 NW 99th Ter Unit 7B Sunrise, FL | 2.0 | 2.0 | 1224 | $2,500 | $2.04 | 22d | 1 | 0.60mi |
| 9827 NW 37th St Unit 4F Sunrise, FL | 2.0 | 2.0 | 1190 | $2,400 | $2.02 | 24d | 1 | 0.66mi |
| 3749 NW 107th Way Unit 3749 Sunrise, FL | 3.0 | 2.0 | 1656 | $3,200 | $1.93 | 24d | 1 | 0.67mi |
| 3749 NW 107th Way Sunrise, FL | 3.0 | 2.0 | 1656 | $3,400 | $2.05 | 24d | 1 | 0.67mi |
| 2590 NW 98th Ave Sunrise, FL | 2.0 | 2.0 | 1247 | $3,000 | $2.41 | 1d | 1 | 0.67mi |
| 2590 NW 98th Ave Sunrise, FL | 2.0 | 2.0 | 1247 | $3,000 | $2.41 | 24d | 1 | 0.67mi |
| 9982 Nob Hill Ct #9982 Sunrise, FL | 2.0 | 2.0 | 900 | $2,200 | $2.44 | 12d | 1 | 0.71mi |
| 3504 NW 111th Ave #3504 Sunrise, FL | 3.0 | 2.0 | 1508 | $2,900 | $1.92 | 4d | 1 | 0.72mi |
| 3504 NW 111th Ave #3504 Sunrise, FL | 3.0 | 2.0 | 1508 | $2,950 | $1.96 | 22d | 1 | 0.72mi |
| 9954 Nob Hill Ct #9954 Sunrise, FL | 2.0 | 2.0 | 900 | $1,900 | $2.11 | 24d | 1 | 0.73mi |
| 9926 Nob Hill Ct #9926 Sunrise, FL | 2.0 | 2.0 | 915 | $2,400 | $2.62 | 24d | 1 | 0.74mi |
| 3832 NW 107th Way Sunrise, FL | 3.0 | 2.0 | 1230 | $3,150 | $2.56 | 24d | 1 | 0.75mi |
| 11338 NW 33rd St Sunrise, FL | 3.0 | 2.5 | 1801 | $5,000 | $2.78 | 24d | 1 | 0.76mi |
| 3571 NW 95th Ter #707 Sunrise, FL | 3.0 | 2.0 | 1241 | $3,100 | $2.50 | 24d | 1 | 0.76mi |
| 9878 Nob Hill Ct #9878 Sunrise, FL | 2.0 | 2.0 | 900 | $2,100 | $2.33 | 12d | 1 | 0.77mi |
| 9878 Nob Hill Ct #9878 Sunrise, FL | 2.0 | 2.0 | 900 | $2,200 | $2.44 | 24d | 1 | 0.77mi |
| 3621 NW 95th Ter #523 Sunrise, FL | 2.0 | 2.0 | 970 | $2,150 | $2.22 | 24d | 1 | 0.79mi |
| 3548 NW 111th Ter Sunrise, FL | 3.0 | 2.0 | 1024 | $2,675 | $2.61 | 20d | 1 | 0.79mi |
| 11386 NW 33rd St Unit 11386 Sunrise, FL | 2.0 | 2.5 | 1498 | $2,900 | $1.94 | 17d | 1 | 0.79mi |
| 10931 NW 39th St Sunrise, FL | 2.0 | 2.0 | 1133 | $2,509 | $2.21 | 19d | 1 | 0.80mi |
| 10931 NW 39th St Sunrise, FL | 1.0 | 1.0 | 902 | $2,099 | $2.33 | 20d | 1 | 0.80mi |
| 10931 NW 39th St Sunrise, FL | 1.0 | 1.0 | 902 | $2,054 | $2.28 | 3d | 1 | 0.80mi |
| 10931 NW 39th St Sunrise, FL | 2.0 | 2.0 | 1133 | $2,533 | $2.24 | 5d | 1 | 0.80mi |
| 10931 NW 39th St Sunrise, FL | 1.0 | 1.0 | 902 | $2,001 | $2.22 | 16d | 1 | 0.80mi |
| 10931 NW 39th St Sunrise, FL | 2.0 | 2.0 | 1133 | $2,565 | $2.26 | 24d | 1 | 0.80mi |
| 10901 NW 40th St Sunrise, FL | 1.0–2.0 | 1.0–2.0 | 900 | $2,400 | $2.67 | 2d | 8 | 0.80mi |
| 10784 NW 23rd Ct Sunrise, FL | 3.0 | 2.0 | 1430 | $3,150 | $2.20 | 12d | 1 | 0.81mi |
HOA detail condo
- Monthly dues
- $713 · $8,556/yr
- Likely covers
- waterpool
- Assessments
- None detected in remarks — confirm with the listing agent.
Listing history 21 events
-
2026-06-18days on market $215,000 Active 255 DOM
-
2026-06-17days on market $215,000 Active 254 DOM
-
2026-06-16days on market $215,000 Active 253 DOM
-
2026-06-15days on market $215,000 Active 252 DOM
-
2026-06-13days on market $215,000 Active 250 DOM
-
2026-06-09days on market $215,000 Active 246 DOM
-
2026-06-07days on market $215,000 Active 244 DOM
-
2026-06-04days on market $215,000 Active 241 DOM
-
2026-06-03days on market $215,000 Active 240 DOM
-
2026-06-02days on market $215,000 Active 239 DOM
-
2026-06-01days on market $215,000 Active 238 DOM
-
2026-05-31days on market $215,000 Active 237 DOM
-
2026-04-09price $215,000
-
2026-01-26price $225,000
-
2025-12-14price $240,000
-
2025-10-06$245,000 Active
-
2024-03-13historical
-
2023-11-20price $259,900
-
2023-11-01$269,500 Active
-
2020-06-01soldstatus $112,000
-
1986-11-01soldstatus $63,500
ⓘ Source: listings_history table (triggers on properties + properties_extension) + one-shot
backfill from property_details.listing_events for pre-trigger history.
Tax reassessment forecast FL · Resets to sale price
- Current annual tax
- $831 · $69/mo
- Projected year-2 tax
- $1,784 · $149/mo
- Expected delta
- +$953/yr (+$79/mo · 114.6%)
ⓘ Screening estimate from a state-policy table — verify with the county assessor before closing.
Nearby sold comps map
Loading sold comps map…
Walkable amenities ~0.75 mi
Loading nearby amenities…
Taxation est. · year 1
- Rental income
- $33,536
- − Mortgage interest
- −$12,043
- − Property taxes
- −$831
- − Insurance
- −$1,075
- − Repairs & maintenance
- −$2,683
- − Management
- −$2,683
- − HOA
- −$8,556
- − Depreciation
- −$6,255
- Taxable loss
- −$590
- Est. tax savings @ 24.0%
- +$142
- After-tax cash flow
- $2,643/yr
For passive investors: Depreciation is non-cash, so a rental often shows a tax loss while cash-flowing — sheltering income. Rental losses are passive: they offset passive income freely, and up to $25,000/yr can offset ordinary (W-2) income if you actively participate and your MAGI is under $100k (phasing out to $0 by $150k); unused losses carry forward. On sale, claimed depreciation is recaptured at up to 25%, and gains may owe capital-gains tax (a 1031 exchange can defer both). Figures are a year-1 estimate at your 24.0% rate — not tax advice; consult a CPA.
Schools (NCES district)
- District
- Broward
- NCES district ID
- 1200180
- Math proficiency
- 42% ▼ -18.00%
- Reading proficiency
- 53% ▼ -5.00%
- Median HH income
- $52,139
- Composite
- 40.88/100
- National rank
- #3621
- State rank
- #46 of 73 in FL
Livability — Sunrise
- Score
- 83/100
- State rank
- #56
- US rank
- #986
Category grades
Schools grade is shown separately in the Schools card above.
Census & demographics
- Census place
- Sunrise, FL
- County
- Broward County · 1,963,430 people
- City population
- 77,492
- Metro
- Miami-Fort Lauderdale-Pompano Beach, FL
- Population (ZIP)
- 41,128
- Household income
- $71,755
- Rent vs Own
- Severe rent burden
- 931.0
Population outlook (Broward County) Hauer SSP2
- Today (2025)
- 2,207,033 people
- By 2030
- 2,360,704 · +7.0%
- By 2040
- 2,661,208 · +20.6%
- By 2050
- 2,946,698 · +33.5%
- By 2075
- 3,602,273 · +63.2%
- By 2100
- 3,970,984 · +79.9%
Race, ethnicity, and origin ACS 2023
- Neighborhood character
- Highly diverse neighborhood (Simpson 0.72)
- Race & ethnicity
- Hispanic / Latino 35% White 32% Black 24% Two or more races 22% Asian 4%
- Hispanic origin (detail)
- Puerto Rican 5% Cuban 6% Dominican 2% Salvadoran 1%
- Common ancestry
- Hispanic 5% Romanian 2% Scotch-Irish 2%
- Foreign-born
- 41% · Canada, Jamaica, South Korea
- Languages at home
- 58% English-only · Spanish 30% French/Haitian/Cajun 6% Other Indo-European 1%
Political lean MEDSL · Broward
- 2024 margin
- D (+17.0) · D 58.0% · R 41.0%
- 2008→2024 swing
- -17.8pp toward R · 2008: 34.7pp · 2024: 17.0pp
- All cycles
- 2024: D+17.0 2020: D+29.8 2016: D+35.0 2012: D+34.9 2008: D+34.7
Not yet ingested
- Civics
- —
Market trends
- HPI YoY
- ▼ -203.34%
- Current HPI
- 407.5452
- Rent YoY
- ▲ 0.60%
- Metro
- Miami-Fort Lauderdale-Pompano Beach, FL
- State GDP YoY
- ▲ 3.28%
- F500 in state
- 36
Industry mix (Fortune 500 HQ in FL)
| Industry | F500 HQs | Revenue |
|---|---|---|
| Industrial Technology | 2 | $29B |
|
||
| Insurance | 2 | $17B |
|
||
| Retail | 1 | $60B |
|
||
| Technology Distribution | 1 | $58B |
|
||
| Homebuilding | 1 | $35B |
|
||
| Technology Manufacturing | 1 | $35B |
|
||
Price history
+238.6% since first listed9 events — show timeline
- 2026-04-09 Price Changed $215,000 MARMLS
- 2026-01-26 Price Changed $225,000 MARMLS
- 2025-12-14 Price Changed $240,000 MARMLS
- 2025-10-06 Listed $245,000 MARMLS
- 2024-03-13 Listing Removed — MARMLS
- 2023-11-20 Price Changed $259,900 MARMLS
- 2023-11-01 Listed $269,500 MARMLS
- 2020-06-01 Sold (Public Records) $112,000 Public Records
- 1986-11-01 Sold (Public Records) $63,500 Public Records
Property tax history
+7.7%/yrLatest (2025): $831 · +4.7% YoY. Source: county tax records.
Cash-flow waterfall
monthlySold comps — $/sqft
last 12 mo · ≤1 miLoading sold comps…