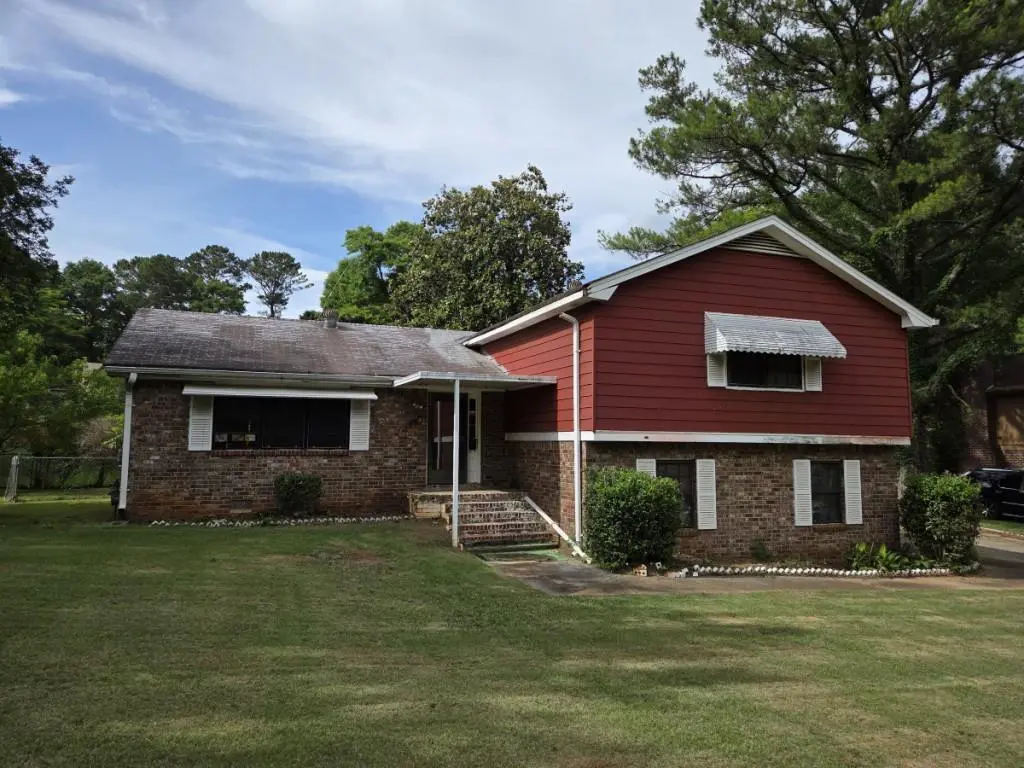
556 Greenview Ave SE · Conyers, GA
Flood risk 1/10 · Minimal
- FEMA flood zone
- X (unshaded)
- Chance of flooding over 30 yrs
- 0.0%
- Est. flood insurance / yr
- $507 – $1,088
Fire risk 2/10 · Minimal
- Est. fire insurance / yr
- $963 – $1,789
Heat risk 6/10 · Moderate
- Hot days now (above 105°F)
- 7 days/yr
- Hot days in 30 yrs
- 18 days/yr
Wind risk 6/10 · Moderate
- Chance of severe wind over 30 yrs
- 27.0%
Air-quality risk 4/10 · Minor
- Unhealthy air days now
- 5 days/yr
- Unhealthy air days in 30 yrs
- 7 days/yr
Risk factors via First Street. Map © Google.
Why this score? — see what drove the B- grade
The composite is a weighted blend of 9 inputs, each scored 0–100. Each bar is that input's sub-score; the figure is the points it added to the 100-point composite (weight × sub-score).
- Cash flow +24.0/30.0
- ARV discount +15.0/15.0
- DSCR +7.7/10.0
- 1% rule +7.4/10.0
- Rent growth +3.5/5.0
- Livability +3.4/5.0
- Condition / age +2.5/5.0
- Schools +1.9/10.0
- Appreciation +0.0/10.0
$175,000
🖨 Deal sheet (PDF) 📄 Offer letter ✓ Due diligence
Listing remarks MLS
Great opportunity to build equity with a total renovation in Conyers! 4 bedroom/2.5 bathroom home with solid bones, half brick siding all around, and a desirable split level floor plan. Big bedrooms upstairs and a den with a fireplace downstairs. Screened patio is accessible from both the den and outside for easy entertaining. The 2-car garage has extra space for storage, and the connected outside shed has plenty of additional space too. Grassy, level lot with an extra wide driveway and a fenced back yard for pets. Convenient to I-20, restaurants, and shopping.
Key facts
- Total renovation
- Screened patio
- Fenced back yard
Tags
Property features AI
Exterior
- Parking: Garage (2 spaces)
- Utilities: Public water; Public sewer; Electric: other; Other utilities
- Home design: Multi/split levels; Ownership: other; Property condition: fixer
- Construction: Brick and frame construction; Shingle roof; Brick/mortar foundation
- Exterior features: Screened patio/porch; Back yard fencing; Shed(s); Other exterior features
Interior
- Kitchen: Stained cabinets; Laminate countertops; Dishwasher; Refrigerator
- Bedrooms: Four upper-level bedrooms; Bedroom features: other
- Flooring: Other
- Bathrooms: Two full bathrooms; One half bathroom; Two full bathrooms on the upper level; One half bathroom on the lower level; Master bathroom: other
- Heating & cooling: Central heating; Central air (electric)
- Interior features: Entrance foyer; Brick fireplace in family room; No common walls; Den; Crawl space basement
- Laundry & utility: Laundry located in garage on lower level
Neighborhood map
What this means for you Summary
Snapshot
- This is a 4-bed/2.5-bath single-family listed at $175k.
Deal economics
- At list price, monthly cash flow is $341 ($4k/yr) — positive.
- The deal already cash-flows at list — no discount required.
- Meets the 1% rule at list price ($2k rent vs $175k).
- Recommended offer: $172k (1.5% below list) — sets the bar for market timing.
- Cap rate 8.6% vs local median 4.4% in Conyers — top-decile yield for the area; either an underpriced asset or a hidden risk that comps aren't pricing in. Stress-test before assuming the spread holds.
Location & tenants
- Location reads 67/100 on livability (#167 in GA) — a middle-class / working-renter tenant base. Strengths: cost of living A+, housing A+; Watch: crime D, amenities D, commute F.
- Rockdale County (suburban): math 14% / reading 29% proficiency, ranked #136 of 174 in GA (top 78%) — low school quality limits family demand, transient renter base, plan for 1-2y turnover.
- Zoned schools: Sims Elementary School (math 17% / reading 22%, grade F, #878 of 1,228 statewide, top 75%, 486 students, 81% FRL); Edwards Middle School (math 15% / reading 33%, grade F, #311 of 470 statewide, top 68%, 943 students, 76% FRL); Heritage High School (math 8% / reading 15%, grade F, #345 of 424 statewide, top 82%, 1,877 students, 59% FRL).
- Market conditions: Rents rising fast (+4.2%/yr); 388 active listings in the ZIP; 13 comparable units currently listed for rent nearby; rentals at typical pace (median 26d on market — plan ~3-4 weeks tenant-placement turnaround); solid renter incomes; 483 units permitted in Rockdale County in 2024 (0 in 5+ unit buildings).
Forward outlook
- Local home prices are declining (-3.0%/yr); year-one equity from $1k of loan paydown is wiped out by about $5k of value loss. Plan a longer hold.
- Rockdale County population projected at +29% by 2050 — long-run rental-demand tailwind backs the buy-and-hold thesis.
Negotiation context
- It's been on market 20 days — a 2% lower offer ($172k) is reasonable based on typical stale-listing flexibility.
- 6 sale attempts since 2y ago; this cycle's ask has dropped $10k (5%) from the opening price — seller is motivated, your offer sets the floor, not the list.
Risks & watch-outs
- Watch-outs: property tax is 2.6% of price.
- Climate carrying-cost: major wind risk, 27% chance of damaging wind over 30y; extreme-heat days projected 7→18/yr by 2055 (HVAC capex compounding) — expect insurance premiums to compound above CPI over the hold.
Questions for the listing agent
- Built in 1974 — when were the roof, HVAC, electrical panel, plumbing, and water heater last replaced?
- Property tax is high relative to price — has the assessment been appealed recently, and will the sale trigger a re-assessment?
- Is there a deadline driving the sale (1031 exchange, divorce, estate, relocation)? That informs how much negotiation room exists.
- Schools are D-rated, which usually means shorter tenancies and higher turnover. Who's the typical renter profile here, and what's been the actual vacancy rate?
- Crime grade is D in this area — have there been break-ins, vandalism, or insurance claims at this property in the last 3 years? What carrier currently insures it and at what premium?
- What's the average days-on-market for RENTAL listings here right now (not sales)? A rising rental-DOM trend means longer vacancies and softer asking-rent achievability than the comps imply.
- What's the recent tenant-quality profile in this submarket — average credit score on applications, eviction rate, late-payment / NSF rate, and stable-employment percentage? A property-management company in the area should have these aggregated.
- How much new for-sale + rental construction is in the pipeline within 1–3 miles? Heavy new supply typically softens prices + rents 12–24 months out; constrained supply supports both.
Investment metrics
- 1% rule
- 1.24% ✓
- Cap rate
- 8.63%
- Cash-on-cash
- 8.36%
- DSCR
- 1.37
- GRM
- 6.7
CMA / ARV
- ARV (on-the-fly)
- $298,060
- Comps found
- 12
Show comp detail 12 sales within ~0.75 mi
| Address | Dist | Beds/Ba | Sqft | Sold | Price | $/sf | Match |
|---|---|---|---|---|---|---|---|
| 2617 Laurel Woods Ln SE | 0.32mi | 4/2.0 | 2,035 (-4%) | 5mo | $250,000 | $123 | 72 |
| 917 Curry Cir | 0.59mi | 4/2.5 | 2,228 (+5%) | 3mo | $300,000 | $135 | 62 |
| 693 Deering Rd SE | 0.27mi | 3/2.5 (-1) | 2,396 (+12%) | 2mo | $225,000 | $94 | 60 |
| 1508 Hillside Dr SE | 0.39mi | 3/3.0 (-1) | 1,992 (-6%) | 5mo | $165,000 | $83 | 60 |
| 1919 Colestock Ave SE | 0.54mi | 5/2.5 (+1) | 2,176 (+2%) | 10mo | $361,805 | $166 | 58 |
| 2645 Laurel Woods Ln SE | 0.36mi | 4/2.0 | 1,829 (-14%) | 4mo | $325,000 | $178 | 54 |
| 1601 Creek Xing SE | 0.64mi | 3/2.5 (-1) | 2,220 (+4%) | 6mo | $300,000 | $135 | 53 |
| 1511 Hillside Dr SE | 0.36mi | 3/2.5 (-1) | 1,840 (-14%) | 4mo | $257,000 | $140 | 53 |
| 1581 Marshall Ln SE | 0.56mi | 4/3.5 | 2,347 (+10%) | 1mo | $279,900 | $119 | 52 |
| 1920 Logan Ln SE | 0.54mi | 4/2.5 | 1,829 (-14%) | 4mo | $328,000 | $179 | 48 |
| 3231 Stanton Rd SE | 0.66mi | 4/2.0 | 1,826 (-14%) | 2mo | $300,000 | $164 | 42 |
| 804 Bridgewater Way SE | 0.48mi | 5/3.0 (+1) | 1,824 (-14%) | 7mo | $280,000 | $154 | 41 |
Match score weights: distance 35% · size 25% · config 20% · recency 20%. Top-matched comps best support the ARV.
Projected returns pro-forma
-3.0% appreciation · 4.16% rent growth · sell at horizon
- IRR
- -2.1%
- Equity multiple
- 0.92×
- Total profit
- $-3,928
- Equity at exit
- $26,093
- IRR
- 9.0%
- Equity multiple
- 1.73×
- Total profit
- $35,869
- Equity at exit
- $15,131
Cash invested: $49,000 (down + closing). Projections, not guarantees.
Landlord ↔ Tenant lean methodology
- Overall (STATE)
- 90 Strongly Landlord-Friendly
- State Georgia
- 90 Strongly Landlord-Friendly · R+3
- County
- — inherits STATE
- City
- — inherits STATE
ZIP-level market 30094
- Rents YoY
- 4.2%
- Active inventory
- 388
- Price-to-rent
- 6.7×
Monthly cashflow live
- Estimated rent
- $2,169 high interval (Pro) →
- Mortgage (P&I)
- −$918
- Tax from tax record
- −$382 /mo · $4,583/yr
- Insurance
- −$73
- HOA
- −$0
- Vacancy / Maint / Mgmt
- −$456
- Net cashflow
- $341
Break-even live
Sensitivity live
| Price | -10% $440 | -5% $391 | +0% $341 | +5% $292 | +10% $242 |
|---|---|---|---|---|---|
| Rent | -10% $170 | -5% $256 | +0% $341 | +5% $427 | +10% $513 |
| Rate | -1.0pp $429 | -0.5pp $386 | base $341 | +0.5pp $296 | +1.0pp $250 |
UW: 25.0% down · 7.5% · 30yr · 1.5% tax · 5.0% vac · 8.0% maint · 8.0% mgmt
Financing live
Cash to close
- Down payment
- $43,750
- Closing costs
- $5,250
- Reserves months
- —
- Total cash needed
- —
Loan-product check · same deal, 3 products live
Conventional
25% down · 7.5% · 30yr
- Down + closing
- —
- Monthly P&I
- —
- Monthly cashflow
- —
- DSCR
- —
- Eligible?
- —
Personal DTI + credit; lowest rate.
DSCR
20% down · 8.5% · 30yr
- Down + closing
- —
- Monthly P&I
- —
- Monthly cashflow
- —
- DSCR
- —
- Eligible?
- —
No personal income docs; deal must DSCR.
Hard money
10% down · 12.0% · 12mo
- Down + closing
- —
- Monthly P&I
- —
- Monthly cashflow
- —
- DSCR
- —
- Eligible?
- —
Short-term bridge; refi at stabilization.
Rent comps 13 comps
| Address | Beds | Baths | Sqft | Rent | $/sqft | DOM | Units | Dist |
|---|---|---|---|---|---|---|---|---|
| 3006 Stanton Rd SE Conyers, GA | 3.0 | 2.0 | 2700 | $1,815 | $0.67 | 22d | 1 | 0.23mi |
| 1419 Hillside Pl SE Conyers, GA | 4.0 | 2.0 | 1536 | $1,955 | $1.27 | 6d | 1 | 0.48mi |
| 3131 Goode Rd Conyers, GA | 3.0 | 2.0 | 1824 | $2,000 | $1.10 | 22d | 1 | 0.52mi |
| 3144 Goode Rd Conyers, GA | 3.0 | 1.5 | 1468 | $1,500 | $1.02 | 45d | 1 | 0.55mi |
| 1103 Sunset Rd SE , GA | 3.0–4.0 | 2.5 | 1850 | $2,415 | $1.31 | 19d | 24 | 0.59mi |
| 1510 Marshall Ln SE Conyers, GA | 4.0 | 2.0 | 1525 | $2,073 | $1.36 | 45d | 1 | 0.62mi |
| 2641 Rolling Hills Way SE Conyers, GA | 3.0 | 2.0 | 1452 | $1,791 | $1.23 | 14d | 1 | 0.71mi |
| 411 Cindy Dr SE Conyers, GA | 3.0 | 2.0 | 1424 | $1,820 | $1.28 | 0d | 1 | 0.87mi |
| 3438 Creekwood Dr SE Conyers, GA | 3.0 | 2.0 | 1840 | $1,845 | $1.00 | 25d | 1 | 1.02mi |
| 2133 Boxwood Cir Conyers, GA | 4.0 | 2.5 | 2087 | $2,250 | $1.08 | 25d | 1 | 1.24mi |
| 2165 Boxwood Cir Conyers, GA | 4.0 | 2.5 | 2091 | $2,250 | $1.08 | 45d | 1 | 1.29mi |
| 2304 Blackburn Pass Conyers, GA | 4.0 | 2.5 | 2836 | $2,471 | $0.87 | 45d | 1 | 1.31mi |
| 2120 Weatherstone Cir SE Conyers, GA | 3.0 | 2.0 | 2076 | $2,250 | $1.08 | 25d | 1 | 1.37mi |
Listing history 13 events
-
2026-06-21days on market $175,000 Active 20 DOM
-
2026-06-18days on market $175,000 Active 17 DOM
-
2026-06-17days on market $175,000 Active 16 DOM
-
2026-06-16days on market $175,000 Active 15 DOM
-
2026-06-15days on market $175,000 Active 14 DOM
-
2026-06-13pricedays on market $175,000 Active 12 DOM
-
2026-06-09days on market $179,900 Active 8 DOM
-
2026-06-08pricedays on market $179,900 Active 7 DOM
-
2026-06-07days on market $185,000 Active 6 DOM
-
2026-06-04days on market $185,000 Active 3 DOM
-
2026-06-03days on market $185,000 Active 2 DOM
-
2026-06-02remarks 568-char remark
-
2026-06-02$185,000 Active 1 DOM
ⓘ Source: listings_history table (triggers on properties + properties_extension) + one-shot
backfill from property_details.listing_events for pre-trigger history.
Tax reassessment forecast GA · Resets to sale price
- Current annual tax
- $4,583 · $382/mo
- Projected year-2 tax
- $4,583 · $382/mo
- Expected delta
- $0/yr ($0/mo · 0.0%)
ⓘ Screening estimate from a state-policy table — verify with the county assessor before closing.
Climate risk First Street
- Flood 1/10 Low FEMA zone X (unshaded) · 0% chance over 30 yrs
- Wildfire 2/10 Low
- Heat 6/10 Major 7 d/yr ≥105°F today · 18 d/yr by 30 yrs out
- Wind 6/10 Major 27% chance of damaging wind over 30 yrs
- Air quality 4/10 Moderate 5 unhealthy d/yr today · 7 by 30 yrs out
Nearby sold comps map
Loading sold comps map…
Walkable amenities ~0.75 mi
Loading nearby amenities…
Taxation est. · year 1
- Rental income
- $26,033
- − Mortgage interest
- −$9,803
- − Property taxes
- −$4,583
- − Insurance
- −$875
- − Repairs & maintenance
- −$2,083
- − Management
- −$2,083
- − Depreciation
- −$5,091
- Taxable income
- $1,516
- Est. tax owed @ 24.0%
- −$364
- After-tax cash flow
- $3,731/yr
For passive investors: Depreciation is non-cash, so a rental often shows a tax loss while cash-flowing — sheltering income. Rental losses are passive: they offset passive income freely, and up to $25,000/yr can offset ordinary (W-2) income if you actively participate and your MAGI is under $100k (phasing out to $0 by $150k); unused losses carry forward. On sale, claimed depreciation is recaptured at up to 25%, and gains may owe capital-gains tax (a 1031 exchange can defer both). Figures are a year-1 estimate at your 24.0% rate — not tax advice; consult a CPA.
Schools (NCES district)
- District
- Rockdale County
- NCES district ID
- 1304410
- Math proficiency
- 14% ▼ -17.00%
- Reading proficiency
- 29% ▼ -11.00%
- Median HH income
- $53,325
- Composite
- 19.42/100
- National rank
- #8776
- State rank
- #136 of 174 in GA
Livability — Conyers
- Score
- 67/100
- State rank
- #167
- US rank
- #10533
Category grades
Schools grade is shown separately in the Schools card above.
Census & demographics
- County
- Rockdale County · 96,534 people
- City population
- 96,534
- Metro
- Atlanta-Sandy Springs-Alpharetta, GA
- Population (ZIP)
- 33,731
- Household income
- $88,530
- Rent vs Own
- Severe rent burden
- 549.0
Population outlook (Rockdale County) Hauer SSP2
- Today (2025)
- 99,145 people
- By 2030
- 104,558 · +5.5%
- By 2040
- 116,100 · +17.1%
- By 2050
- 127,827 · +28.9%
- By 2075
- 159,113 · +60.5%
- By 2100
- 181,178 · +82.7%
Race, ethnicity, and origin ACS 2023
- Neighborhood character
- Diverse neighborhood (Simpson 0.60)
- Race & ethnicity
- Black 56% White 29% Two or more races 9% Hispanic / Latino 7% Asian 1%
- Hispanic origin (detail)
- Mexican 4% Puerto Rican 1%
- Common ancestry
- Hispanic 1% Serbian 1% Slovak 1%
- Foreign-born
- 7% · Canada
- Languages at home
- 91% English-only · Spanish 5% French/Haitian/Cajun 1%
Political lean MEDSL · Rockdale
- 2024 margin
- Solid D (+47.5) · D 73.4% · R 25.9%
- 2008→2024 swing
- +37.9pp toward D · 2008: 9.6pp · 2024: 47.5pp
- All cycles
- 2024: D+47.5 2020: D+40.8 2016: D+25.9 2012: D+16.4 2008: D+9.6
Not yet ingested
- Civics
- —
Market trends
- HPI YoY
- ▼ -168.06%
- Current HPI
- 205.627
- Rent YoY
- ▲ 4.16%
- Metro
- Atlanta-Sandy Springs-Alpharetta, GA
- State GDP YoY
- ▲ 2.66%
- F500 in state
- 28
Industry mix (Fortune 500 HQ in GA)
| Industry | F500 HQs | Revenue |
|---|---|---|
| Paper / Packaging | 2 | $29B |
|
||
| Retail | 1 | $160B |
|
||
| Transportation / Logistics | 1 | $91B |
|
||
| Airlines | 1 | $62B |
|
||
| Consumer Goods | 1 | $47B |
|
||
| Utilities | 1 | $25B |
|
||
Price history
-13.9% since first listed16 events — show timeline
- 2026-06-01 Listed $185,000 FMLS
- 2026-06-01 Listed $185,000 GAMLS
- 2025-04-30 Listing Removed — GAMLS
- 2025-04-30 Listing Removed — FMLS
- 2024-12-12 Price Changed $199,900 GAMLS
- 2024-12-11 Relisted — FMLS
- 2024-12-11 Relisted — GAMLS
- 2024-12-11 Price Changed $109,900 GAMLS
- 2024-12-11 Price Changed $199,900 FMLS
- 2024-12-06 Pending — GAMLS
- 2024-12-05 Contingent — FMLS
- 2024-12-05 Price Changed $209,900 FMLS
- 2024-11-27 Price Changed $209,900 GAMLS
- 2024-11-02 Listed $214,900 FMLS
- 2024-10-29 Coming Soon — FMLS
- 2024-10-28 Listed $214,900 GAMLS
Property tax history
+15.1%/yrLatest (2025): $4,583 · +5.5% YoY. Source: county tax records.
Cash-flow waterfall
monthlySold comps — $/sqft
last 12 mo · ≤1 miLoading sold comps…