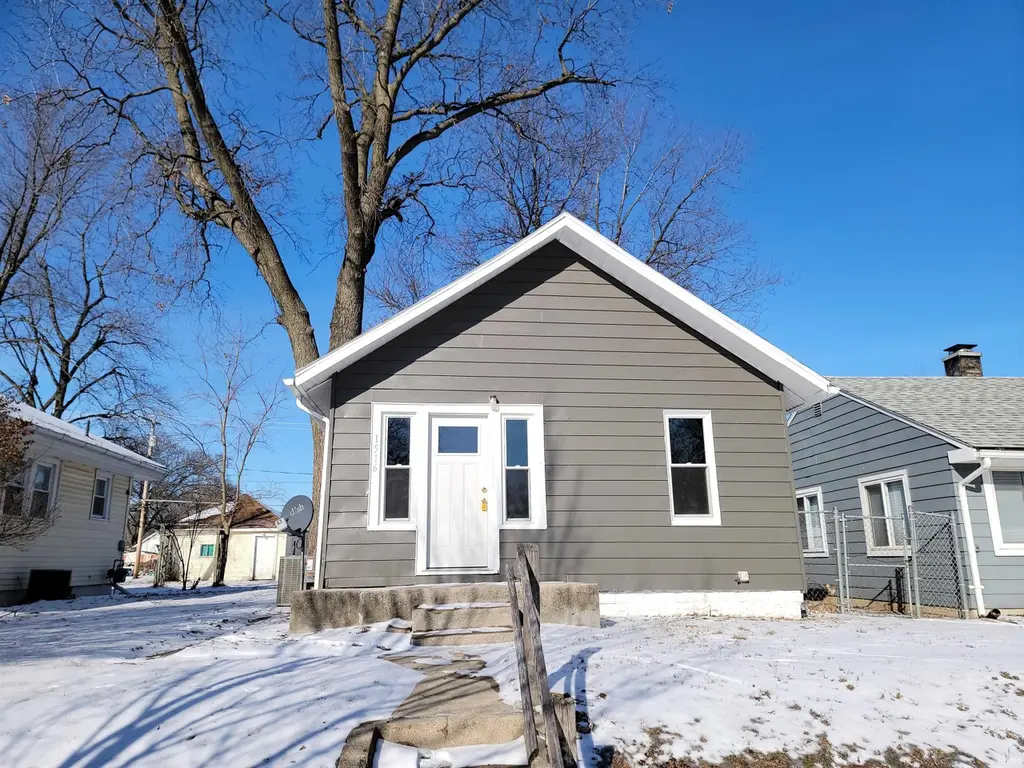
1516 W 4th St · Fort Wayne, IN
Flood risk 1/10 · Minimal
- FEMA flood zone
- X (unshaded)
- Chance of flooding over 30 yrs
- 0.0%
- Est. flood insurance / yr
- $507 – $1,088
Fire risk 1/10 · Minimal
- Est. fire insurance / yr
- $717 – $1,331
Heat risk 3/10 · Minor
- Hot days now (above 100°F)
- 7 days/yr
- Hot days in 30 yrs
- 17 days/yr
Wind risk 2/10 · Minimal
- Chance of severe wind over 30 yrs
- —
Air-quality risk 3/10 · Minor
- Unhealthy air days now
- 2 days/yr
- Unhealthy air days in 30 yrs
- 3 days/yr
Risk factors via First Street. Map © Google.
Why this score? — see what drove the B- grade
The composite is a weighted blend of 9 inputs, each scored 0–100. Each bar is that input's sub-score; the figure is the points it added to the 100-point composite (weight × sub-score).
- Cash flow +27.5/30.0
- DSCR +9.7/10.0
- ARV discount +9.7/15.0
- 1% rule +7.2/10.0
- Rent growth +4.2/5.0
- Livability +4.2/5.0
- Condition / age +2.5/5.0
- Schools +2.2/10.0
- Appreciation +0.0/10.0
$99,900
🖨 Deal sheet 📄 Offer letter ✓ Due diligence
Listing remarks MLS
Nicely remodeled home ready for the new owner. 2 bedroom 1 bathroom 520 square feet home, easy to keep clean with newer flooring throughout! Exterior upgrades, and a nice AC unit. Room sizes are approximate, please verify.
Key facts
- 5,600 sq ft lot
- Built 1930
- Listed 118 days
Neighborhood map
What this means for you Summary
Snapshot
- This is a 2-bed/1.0-bath single-family listed at $100k.
Deal economics
- At list price, monthly cash flow is $297 ($4k/yr) — positive.
- The deal already cash-flows at list — no discount required.
- Meets the 1% rule at list price ($1k rent vs $100k).
- Recommended offer: $91k (9.0% below list) — sets the bar for market timing.
- Cap rate 9.9% vs local median 4.8% in Fort Wayne — top-decile yield for the area; either an underpriced asset or a hidden risk that comps aren't pricing in. Stress-test before assuming the spread holds.
Location & tenants
- Location reads 84/100 on livability (#6 in IN, #676 nationally) — a professional / high-income tenant draw. Strengths: amenities A+, commute A+, cost of living A+; Watch: crime C-, schools D+, employment D+.
- Fort Wayne Community Schools (urban): math 22% / reading 29% proficiency, ranked #263 of 301 in IN (top 87%) — low school quality limits family demand, transient renter base, plan for 1-2y turnover; 60% free/reduced lunch — lower-income household profile, screen leases tightly.
- Market conditions: Rents rising fast (+7.0%/yr); 87 active listings in the ZIP; 12 comparable units currently listed for rent nearby; rentals at typical pace (median 21d on market — plan ~3-4 weeks tenant-placement turnaround); 1,861 units permitted in Allen County in 2024 (576 in 5+ unit buildings).
Forward outlook
- Local home prices are declining (-3.0%/yr); year-one equity from $691 of loan paydown is wiped out by about $3k of value loss. Plan a longer hold.
- Allen County population projected at +10% by 2050 — modest demand growth; plan on rents tracking national, not racing it.
- At projected returns (-3.0% appreciation + 7.0% rent growth), your $28k cash investment doubles in ~7 years — after that, you're playing with house money.
Negotiation context
- It's been on market 119 days — a 9% lower offer ($91k) is reasonable based on typical stale-listing flexibility.
- 4 sale attempts with the ask held roughly flat each time — persistent listings suggest the price (not the market) is what's stuck; bring a comps-based counter.
Risks & watch-outs
- Watch-outs: built in 1930 — expect roof / HVAC / electrical / plumbing capex.
Questions for the listing agent
- It's been on market 119 days. Have you received any prior offers? Is the seller open to a 9% concession, seller financing, or rate buy-down credit?
- Built in 1930 — when were the roof, HVAC, electrical panel, plumbing, and water heater last replaced?
- Why hasn't it sold? Are there any deal-killer items the seller is aware of (foundation, flood, title, zoning, code violations)?
- Is there a deadline driving the sale (1031 exchange, divorce, estate, relocation)? That informs how much negotiation room exists.
- Schools are D-rated, which usually means shorter tenancies and higher turnover. Who's the typical renter profile here, and what's been the actual vacancy rate?
- What's the average days-on-market for RENTAL listings here right now (not sales)? A rising rental-DOM trend means longer vacancies and softer asking-rent achievability than the comps imply.
- What's the recent tenant-quality profile in this submarket — average credit score on applications, eviction rate, late-payment / NSF rate, and stable-employment percentage? A property-management company in the area should have these aggregated.
- How much new for-sale + rental construction is in the pipeline within 1–3 miles? Heavy new supply typically softens prices + rents 12–24 months out; constrained supply supports both.
Investment metrics
- 1% rule
- 1.22% ✓
- Cap rate
- 9.86%
- Cash-on-cash
- 12.73%
- DSCR
- 1.57
- GRM
- 6.8
CMA / ARV
- ARV (median comp)
- $105,000
- List price
- $99,900
- Delta
- -4.86%
- Verdict
- FAIR
- Comps
- 17 within 1.0 mi
Show comp detail 2 sales within ~0.75 mi
| Address | Dist | Beds/Ba | Sqft | Sold | Price | $/sf | Match |
|---|---|---|---|---|---|---|---|
| 1702 Sinclair St | 0.22mi | 1/1.0 (-1) | 564 (+8%) | 3mo | $105,000 | $186 | 68 |
| 2118 Andrew St | 0.65mi | 2/1.0 | 588 (+13%) | 22mo | $105,000 | $179 | 30 |
Match score weights: distance 35% · size 25% · config 20% · recency 20%. Top-matched comps best support the ARV.
Projected returns pro-forma
-3.0% appreciation · 6.98% rent growth · sell at horizon
- IRR
- 6.8%
- Equity multiple
- 1.28×
- Total profit
- $7,808
- Equity at exit
- $14,895
- IRR
- 19.4%
- Equity multiple
- 2.92×
- Total profit
- $53,835
- Equity at exit
- $8,638
Cash invested: $27,972 (down + closing). Projections, not guarantees.
Landlord ↔ Tenant lean methodology
- Overall (STATE)
- 90 Strongly Landlord-Friendly
- State Indiana
- 90 Strongly Landlord-Friendly · R+11
- County
- — inherits STATE
- City
- — inherits STATE
ZIP-level market 46808
- Rents YoY
- 7.0%
- Active inventory
- 87
- Price-to-rent
- 6.8×
Monthly cashflow live
- Estimated rent
- $1,222 high interval (Pro) →
- Mortgage (P&I)
- −$524
- Tax from tax record
- −$103 /mo · $1,241/yr
- Insurance
- −$42
- HOA
- −$0
- Vacancy / Maint / Mgmt
- −$257
- Net cashflow
- $297
Break-even live
UW: 25.0% down · 7.5% · 30yr · 1.5% tax · 5.0% vac · 8.0% maint · 8.0% mgmt
Financing live
Cash to close
- Down payment
- $24,975
- Closing costs
- $2,997
- Reserves months
- —
- Total cash needed
- —
Loan-product check · same deal, 3 products live
Conventional
25% down · 7.5% · 30yr
- Down + closing
- —
- Monthly P&I
- —
- Monthly cashflow
- —
- DSCR
- —
- Eligible?
- —
Personal DTI + credit; lowest rate.
DSCR
20% down · 8.5% · 30yr
- Down + closing
- —
- Monthly P&I
- —
- Monthly cashflow
- —
- DSCR
- —
- Eligible?
- —
No personal income docs; deal must DSCR.
Hard money
10% down · 12.0% · 12mo
- Down + closing
- —
- Monthly P&I
- —
- Monthly cashflow
- —
- DSCR
- —
- Eligible?
- —
Short-term bridge; refi at stabilization.
Rent comps 12 comps
| Address | Beds | Baths | Sqft | Rent | $/sqft | DOM | Units | Dist |
|---|---|---|---|---|---|---|---|---|
| 616 Mechanic St Unit B Fort Wayne, IN | 1.0 | 1.0 | 500 | $750 | $1.50 | 21d | 1 | 0.62mi |
| 835 Van Buren St Fort Wayne, IN | 2.0 | 1.0–2.0 | 750 | $1,995 | $2.66 | 13d | 29 | 0.94mi |
| 517 W Washington Blvd Unit 14 Strauss Fort Wayne, IN | 1.0 | 1.0 | 500 | $995 | $1.99 | 13d | 1 | 1.14mi |
| 116 W Columbia St Fort Wayne, IN | 1.0 | 1.0 | 689 | $1,305 | $1.89 | 13d | 3 | 1.14mi |
| 877 Lavina St Fort Wayne, IN | 1.0–3.0 | 1.0–2.0 | 997 | $2,187 | $2.19 | 43d | 17 | 1.21mi |
| 1250 Ewing St Fort Wayne, IN | 2.0 | 1.0–2.0 | 980 | $2,081 | $2.12 | 21d | 24 | 1.29mi |
| 424 Nussbaum Ave Fort Wayne, IN | 2.0 | 1.0 | 650 | $1,200 | $1.85 | 21d | 1 | 1.32mi |
| 112 W Washington Blvd Fort Wayne, IN | 1.0–2.0 | 1.0–2.0 | 768 | $1,500 | $1.95 | 21d | 2 | 1.34mi |
| 101 Three Rivers N Fort Wayne, IN | 2.0 | 1.0 | 760 | $2,102 | $2.76 | 21d | 11 | 1.38mi |
| 1512 Taylor St Unit 3 Fort Wayne, IN | 1.0 | 1.0 | 500 | $850 | $1.70 | 21d | 1 | 1.39mi |
| 1512 Taylor St Unit 2 Fort Wayne, IN | 1.0 | 1.0 | 500 | $795 | $1.59 | 21d | 1 | 1.39mi |
| 1829 Broadway Unit 1831 Fort Wayne, IN | 1.0 | 1.0 | 600 | $950 | $1.58 | 43d | 1 | 1.41mi |
Listing history 15 events
-
2026-05-07status Active 222-char remark
Show marketing remark (222 chars)
Nicely remodeled home ready for the new owner. 2 bedroom 1 bathroom 520 square feet home, easy to keep clean with newer flooring throughout! Exterior upgrades, and a nice AC unit. Room sizes are approximate, please verify.
-
2026-05-07historical 222-char remark
Show marketing remark (222 chars)
Nicely remodeled home ready for the new owner. 2 bedroom 1 bathroom 520 square feet home, easy to keep clean with newer flooring throughout! Exterior upgrades, and a nice AC unit. Room sizes are approximate, please verify.
-
2026-04-28status Active 222-char remark
Show marketing remark (222 chars)
Nicely remodeled home ready for the new owner. 2 bedroom 1 bathroom 520 square feet home, easy to keep clean with newer flooring throughout! Exterior upgrades, and a nice AC unit. Room sizes are approximate, please verify.
-
2026-04-28price $99,900 222-char remark
Show marketing remark (222 chars)
Nicely remodeled home ready for the new owner. 2 bedroom 1 bathroom 520 square feet home, easy to keep clean with newer flooring throughout! Exterior upgrades, and a nice AC unit. Room sizes are approximate, please verify.
-
2026-04-06price $102,000 222-char remark
Show marketing remark (222 chars)
Nicely remodeled home ready for the new owner. 2 bedroom 1 bathroom 520 square feet home, easy to keep clean with newer flooring throughout! Exterior upgrades, and a nice AC unit. Room sizes are approximate, please verify.
-
2026-03-09price $103,000 222-char remark
Show marketing remark (222 chars)
Nicely remodeled home ready for the new owner. 2 bedroom 1 bathroom 520 square feet home, easy to keep clean with newer flooring throughout! Exterior upgrades, and a nice AC unit. Room sizes are approximate, please verify.
-
2026-01-16$105,000 Active 222-char remark
Show marketing remark (222 chars)
Nicely remodeled home ready for the new owner. 2 bedroom 1 bathroom 520 square feet home, easy to keep clean with newer flooring throughout! Exterior upgrades, and a nice AC unit. Room sizes are approximate, please verify.
-
2025-11-06price $114,400
-
2025-10-27price $115,900
-
2025-10-17price $116,900
-
2025-10-06price $119,900
-
2025-09-23price $121,400
-
2025-09-12price $122,900
-
2025-08-25$124,900 Active
-
2022-06-21price $695
ⓘ Source: listings_history table (triggers on properties + properties_extension) + one-shot
backfill from property_details.listing_events for pre-trigger history.
Tax reassessment forecast IN · Partial reset (capped growth)
- Current annual tax
- $1,241 · $103/mo
- Projected year-2 tax
- $1,241 · $103/mo
- Expected delta
- $0/yr ($0/mo · 0.0%)
ⓘ Screening estimate from a state-policy table — verify with the county assessor before closing.
Climate risk First Street
- Flood 1/10 Low FEMA zone X (unshaded) · 0% chance over 30 yrs
- Wildfire 1/10 Low
- Heat 3/10 Moderate 7 d/yr ≥100°F today · 17 d/yr by 30 yrs out
- Wind 2/10 Low
- Air quality 3/10 Moderate 2 unhealthy d/yr today · 3 by 30 yrs out
Nearby sold comps map
Loading sold comps map…
Walkable amenities ~0.75 mi
Loading nearby amenities…
Taxation est. · year 1
- Rental income
- $14,669
- − Mortgage interest
- −$5,596
- − Property taxes
- −$1,241
- − Insurance
- −$500
- − Repairs & maintenance
- −$1,174
- − Management
- −$1,174
- − Depreciation
- −$2,906
- Taxable income
- $2,079
- Est. tax owed @ 24.0%
- −$499
- After-tax cash flow
- $3,062/yr
For passive investors: Depreciation is non-cash, so a rental often shows a tax loss while cash-flowing — sheltering income. Rental losses are passive: they offset passive income freely, and up to $25,000/yr can offset ordinary (W-2) income if you actively participate and your MAGI is under $100k (phasing out to $0 by $150k); unused losses carry forward. On sale, claimed depreciation is recaptured at up to 25%, and gains may owe capital-gains tax (a 1031 exchange can defer both). Figures are a year-1 estimate at your 24.0% rate — not tax advice; consult a CPA.
Schools (NCES district)
- District
- Fort Wayne Community Schools
- NCES district ID
- 1803630
- Math proficiency
- 22% ▼ -11.00%
- Reading proficiency
- 29% ▼ -7.00%
- Median HH income
- $41,951
- Composite
- 21.68/100
- National rank
- #8275
- State rank
- #263 of 301 in IN
Livability — Fort Wayne
- Score
- 84/100
- State rank
- #6
- US rank
- #676
Category grades
Schools grade is shown separately in the Schools card above.
Census & demographics
- Census place
- Fort Wayne, IN
- County
- Allen County · 326,813 people
- City population
- 326,813
- Metro
- Fort Wayne, IN
- Population (ZIP)
- 19,684
- Household income
- $53,359
- Rent vs Own
- Severe rent burden
- 625.0
Population outlook (Allen County) Hauer SSP2
- Today (2025)
- 394,020 people
- By 2030
- 405,128 · +2.8%
- By 2040
- 423,476 · +7.5%
- By 2050
- 435,137 · +10.4%
- By 2075
- 450,293 · +14.3%
- By 2100
- 424,101 · +7.6%
Race, ethnicity, and origin ACS 2023
- Neighborhood character
- Predominantly White (71%)
- Race & ethnicity
- White 71% Hispanic / Latino 13% Two or more races 9% Black 9% Asian 2%
- Hispanic origin (detail)
- Mexican 10% Puerto Rican 2%
- Common ancestry
- Romanian 3% Lithuanian 2% Slovak 2%
- Foreign-born
- 7% · Canada, Philippines, South Korea
- Languages at home
- 86% English-only · Spanish 10% Korean 2% Other Asian/Pacific 1%
Political lean MEDSL · Allen
- 2024 margin
- R (+12.5) · D 42.9% · R 55.4% · Other 1.7%
- 2008→2024 swing
- -8.1pp toward R · 2008: -4.3pp · 2024: -12.5pp
- All cycles
- 2024: R+12.5 2020: R+11.2 2016: R+19.6 2012: R+16.8 2008: R+4.3
Not yet ingested
- Civics
- —
Market trends
- HPI YoY
- ▼ -288.51%
- Current HPI
- 239.6115
- Rent YoY
- ▲ 6.98%
- Metro
- Fort Wayne, IN
- State GDP YoY
- ▲ 2.90%
- F500 in state
- 18
Industry mix (Fortune 500 HQ in IN)
| Industry | F500 HQs | Revenue |
|---|---|---|
| Industrial Machinery | 2 | $37B |
|
||
| Healthcare | 1 | $177B |
|
||
| Pharmaceuticals | 1 | $45B |
|
||
| Metals / Steel | 1 | $18B |
|
||
| Agriculture | 1 | $17B |
|
||
| Packaging | 1 | $12B |
|
||
Price history
-20.0% since first listed15 events — show timeline
- 2026-05-07 Relisted — IRMLS
- 2026-05-07 Delisted — IRMLS
- 2026-04-28 Relisted — IRMLS
- 2026-04-28 Price Changed $99,900 IRMLS
- 2026-04-06 Price Changed $102,000 IRMLS
- 2026-03-09 Price Changed $103,000 IRMLS
- 2026-01-16 Listed $105,000 IRMLS
- 2025-11-06 Price Changed $114,400 IRMLS
- 2025-10-27 Price Changed $115,900 IRMLS
- 2025-10-17 Price Changed $116,900 IRMLS
- 2025-10-06 Price Changed $119,900 IRMLS
- 2025-09-23 Price Changed $121,400 IRMLS
- 2025-09-12 Price Changed $122,900 IRMLS
- 2025-08-25 Listed $124,900 IRMLS
- 2022-06-21 Price Changed $695 RENT.
Property tax history
+4.9%/yrLatest (2024): $1,241 · +30.8% YoY. Source: county tax records.
Cash-flow waterfall
monthlySold comps — $/sqft
last 12 mo · ≤1 miLoading sold comps…